Poly Aluminium Chloride (PAC) Market Size, Share, and Trends Analysis Report
CAGR :

| Market Size 2023 (Base Year) | USD 2.12 Billion |
| Market Size 2032 (Forecast Year) | USD 3.41 Billion |
| CAGR | 5.4% |
| Forecast Period | 2024 - 2032 |
| Historical Period | 2018 - 2023 |
Poly Aluminium Chloride (PAC) Market Insights
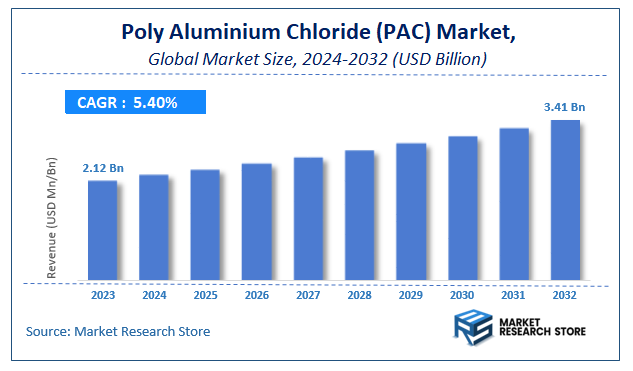
As per the published report by Market Research Store, the Global Poly Aluminium Chloride (PAC) Market size was estimated at USD 2.12 Billion in 2023 and is anticipated to reach reach USD 3.41 Billion by 2032, growing at a projected CAGR of 5.4% during the forecast period 2024-2032. The report provides a detailed analysis of the global Poly Aluminium Chloride (PAC) Market, including market trends, market dynamics, and market opportunities during the forecast period (2024-2032). It delves deeper into several market facets, such as market definition, size, growth, forecast, segmentation, competitive analysis, growth drivers, restraints, financial analysis, SWOT analysis, PORTER’s five force analysis, PESTEL analysis, market share analysis, cost-benefit analysis, challenges, restraints, strategic recommendations, and market players.
To Get more Insights, Request a Free Sample
Poly Aluminium Chloride (PAC) Market: Overview
The growth of the poly aluminium chloride (PAC) market is fueled by rising global demand across various industries and applications. The report highlights lucrative opportunities, analyzing cost structures, key segments, emerging trends, regional dynamics, and advancements by leading players to provide comprehensive market insights. The poly aluminium chloride (PAC) market report offers a detailed industry analysis from 2024 to 2032, combining quantitative and qualitative insights. It examines key factors such as pricing, market penetration, GDP impact, industry dynamics, major players, consumer behavior, and socio-economic conditions. Structured into multiple sections, the report provides a comprehensive perspective on the market from all angles.
Key sections of the poly aluminium chloride (PAC) market report include market segments, outlook, competitive landscape, and company profiles. Market Segments offer in-depth details based on Form, Application, End-User, and other relevant classifications to support strategic marketing initiatives. Market Outlook thoroughly analyzes market trends, growth drivers, restraints, opportunities, challenges, Porter’s Five Forces framework, macroeconomic factors, value chain analysis, and pricing trends shaping the market now and in the future. The Competitive Landscape and Company Profiles section highlights major players, their strategies, and market positioning to guide investment and business decisions. The report also identifies innovation trends, new business opportunities, and investment prospects for the forecast period.
Key Highlights:
- As per the analysis shared by our research analyst, the global poly aluminium chloride (PAC) market is estimated to grow annually at a CAGR of around 5.4% over the forecast period (2024-2032).
- In terms of revenue, the global poly aluminium chloride (PAC) market size was valued at around USD 2.12 Billion in 2023 and is projected to reach USD 3.41 Billion by 2032.
- The market is projected to grow at a significant rate due to increasing applications in water treatment, paper manufacturing, and wastewater management.
- Based on the Form, the Liquid segment is growing at a high rate and will continue to dominate the global market as per industry projections.
- On the basis of Application, the Water Treatment segment is anticipated to command the largest market share.
- In terms of End-User, the Water Treatment segment is projected to lead the global market.
- Based on region, Asia-Pacific is projected to dominate the global market during the forecast period.
Poly Aluminium Chloride (PAC) Market: Report Scope
This report thoroughly analyzes the poly aluminium chloride (PAC) market, exploring its historical trends, current state, and future projections. The market estimates presented result from a robust research methodology, incorporating primary research, secondary sources, and expert opinions. These estimates are influenced by the prevailing market dynamics as well as key economic, social, and political factors. Furthermore, the report considers the impact of regulations, government expenditures, and advancements in research and development on the market. Both positive and negative shifts are evaluated to ensure a comprehensive and accurate market outlook.
| Report Attributes | Report Details |
|---|---|
| Report Name | Poly Aluminium Chloride (PAC) Market |
| Market Size in 2023 | USD 2.12 Billion |
| Market Forecast in 2032 | USD 3.41 Billion |
| Growth Rate | CAGR of 5.4% |
| Number of Pages | 170 |
| Key Companies Covered | CCM, JL Chemtonic, Filtron Envirotech, Whizz Water Sdn Bhd, PT Lautan Luas Tbk, Xantara Sdn Bhd, Kemwater, JSC Southern Basic Chemicals, Saifu chemicals group, THAI PAC Industry Company, Aditya Birla, Innova Corporate, J.P enterprise Chemical Corp, Gujarat Alkalies and Chemicals |
| Segments Covered | By Form, By Application, By End-User, and By Region |
| Regions Covered | North America, Europe, Asia Pacific (APAC), Latin America, Middle East, and Africa (MEA) |
| Base Year | 2023 |
| Historical Year | 2018 to 2023 |
| Forecast Year | 2024 to 2032 |
| Customization Scope | Avail customized purchase options to meet your exact research needs. Request For Customization |
Poly Aluminium Chloride (PAC) Market: Dynamics
Key Growth Drivers:
The increasing demand for clean and safe drinking water, coupled with the rising concerns regarding industrial wastewater treatment, serves as a primary driver for the Poly Aluminium Chloride (PAC) market. Rapid industrialization and urbanization, especially in developing economies, necessitate efficient water treatment solutions where PAC plays a crucial role as a coagulant and flocculant. Furthermore, stringent environmental regulations mandating effective wastewater treatment across various industries, including paper and pulp, textiles, and oil & gas, are propelling the adoption of PAC. The superior performance of PAC over traditional coagulants, such as its effectiveness across a wider pH range and lower sludge production, further contributes to its growing preference and market expansion.
Restraints:
The Poly Aluminium Chloride market faces certain restraints that can potentially hinder its growth. Fluctuations and volatility in the prices of key raw materials like aluminum and hydrochloric acid can significantly impact the production costs of PAC, making it expensive and potentially deterring investments and long-term planning. Additionally, the corrosive nature of PAC necessitates careful handling and storage, leading to increased operational costs and the need for stringent safety measures. Competition from alternative water treatment chemicals, such as ferric chloride and organic coagulants, which may offer cost advantages in certain applications, also poses a challenge to the widespread adoption of PAC.
Opportunities:
The expansion of end-use industries, particularly the paper and pulp sector, presents significant growth opportunities for the PAC market. PAC is widely utilized in the paper industry as a retention aid, improving paper quality and production efficiency, and the increasing global demand for paper products is expected to drive the need for PAC. Moreover, ongoing research and development efforts focused on enhancing the efficiency and environmental friendliness of PAC formulations are likely to create new avenues for market growth. The rising awareness and implementation of stricter water quality standards globally also open up opportunities for PAC as an effective solution for meeting these requirements in both municipal and industrial water treatment applications.
Challenges:
The Poly Aluminium Chloride market encounters several challenges that could impede its progress. Ensuring a consistent and reliable supply chain for raw materials amidst geopolitical tensions and potential trade policy changes can be difficult and may lead to pricing and availability issues. Adhering to increasingly stringent environmental regulations requires continuous investment in compliance measures and can impact production processes. Furthermore, limited awareness about the benefits and applications of PAC, especially in some developing regions, can restrict its market penetration and adoption. Logistical complexities associated with the transportation and storage of PAC can also contribute to operational inefficiencies and increased costs for manufacturers and end-users.
Poly Aluminium Chloride (PAC) Market: Segmentation Insights
The global poly aluminium chloride (PAC) market is segmented based on Form, Application, End-User, and Region. All the segments of the poly aluminium chloride (PAC) market have been analyzed based on present & future trends and the market is estimated from 2024 to 2032.
Based on Form, the global poly aluminium chloride (PAC) market is divided into Liquid, Powder.
On the basis of Application, the global poly aluminium chloride (PAC) market is bifurcated into Water Treatment, Sewage Treatment, Paper Industry, Textile, Oil & Gas, Others.
In terms of End-User, the global poly aluminium chloride (PAC) market is categorized into Water Treatment, Pulp & Paper, Textiles, Oil & Gas, Chemicals.
Poly Aluminium Chloride (PAC) Market: Regional Insights
The Asia-Pacific (APAC) region dominates the global Poly Aluminium Chloride (PAC) market, driven by rapid industrialization, stringent wastewater treatment regulations, and increasing demand from water-intensive industries. According to recent market reports, APAC held over 45% of the global PAC market share in 2023, with China being the largest producer and consumer due to its extensive municipal and industrial water treatment applications. India and Southeast Asian nations are also witnessing significant growth, supported by government initiatives to improve water quality and expand wastewater infrastructure.
North America and Europe follow, with steady demand from the chemical and paper & pulp industries, but APAC's growth rate remains the highest, projected at a CAGR of 5.8% (2024-2030), fueled by urbanization and environmental compliance measures. The region's cost-effective production capabilities and rising investments in water treatment further solidify its dominance.
Poly Aluminium Chloride (PAC) Market: Competitive Landscape
The poly aluminium chloride (PAC) market report offers a thorough analysis of both established and emerging players within the market. It includes a detailed list of key companies, categorized based on the types of products they offer and other relevant factors. The report also highlights the market entry year for each player, providing further context for the research analysis.
The "Global Poly Aluminium Chloride (PAC) Market" study offers valuable insights, focusing on the global market landscape, with an emphasis on major industry players such as;
- CCM
- JL Chemtonic
- Filtron Envirotech
- Whizz Water Sdn Bhd
- PT Lautan Luas Tbk
- Xantara Sdn Bhd
- Kemwater
- JSC Southern Basic Chemicals
- Saifu chemicals group
- THAI PAC Industry Company
- Aditya Birla
- Innova Corporate
- J.P enterprise Chemical Corp
- Gujarat Alkalies and Chemicals
The Global Poly Aluminium Chloride (PAC) Market is Segmented as Follows:
By Form
- Liquid
- Powder
By Application
- Water Treatment
- Sewage Treatment
- Paper Industry
- Textile
- Oil & Gas
- Others
By End-User
- Water Treatment
- Pulp & Paper
- Textiles
- Oil & Gas
- Chemicals
By Region
- North America
- The U.S.
- Canada
- Mexico
- Europe
- France
- The UK
- Spain
- Germany
- Italy
- Rest of Europe
- Asia Pacific
- China
- Japan
- India
- Australia
- South Korea
- Rest of Asia Pacific
- The Middle East & Africa
- Saudi Arabia
- UAE
- Egypt
- Kuwait
- South Africa
- Rest of the Middle East & Africa
- Latin America
- Brazil
- Argentina
- Rest of Latin America
Market Evolution
This section evaluates the market position of the product or service by examining its development pathway and competitive dynamics. It provides a detailed overview of the product's growth stages, including the early (historical) phase, the mid-stage, and anticipated future advancements influenced by innovation and emerging technologies.
Porter’s Analysis
Porter’s Five Forces framework offers a strategic lens for assessing competitor behavior and the positioning of key players in the poly aluminium chloride (PAC) industry. This section explores the external factors shaping competitive dynamics and influencing market strategies in the years ahead. The analysis focuses on five critical forces:
- Competitive Rivalry
- Threat of New Entrants
- Threat of Substitutes
- Supplier Bargaining Power
- Buyer Bargaining Power
Value Chain & Market Attractiveness Analysis
The value chain analysis helps businesses optimize operations by mapping the product flow from suppliers to end consumers, identifying opportunities to streamline processes and gain a competitive edge. Segment-wise market attractiveness analysis evaluates key dimensions like product categories, demographics, and regions, assessing growth potential, market size, and profitability. This enables businesses to focus resources on high-potential segments for better ROI and long-term value.
PESTEL Analysis
PESTEL analysis is a powerful tool in market research reports that enhances market understanding by systematically examining the external macro-environmental factors influencing a business or industry. The acronym stands for Political, Economic, Social, Technological, Environmental, and Legal factors. By evaluating these dimensions, PESTEL analysis provides a comprehensive overview of the broader context within which a market operates, helping businesses identify potential opportunities and threats.
- Political factors assess government policies, stability, trade regulations, and political risks that could impact market operations.
- Economic factors examine variables like inflation, exchange rates, economic growth, and consumer spending power to determine market viability.
- Social factors explore cultural trends, demographics, and lifestyle changes that shape consumer behavior and preferences.
- Technological factors evaluate innovation, R&D, and technological advancements affecting product development and operational efficiencies.
- Environmental factors focus on sustainability, climate change impacts, and eco-friendly practices shaping market trends.
- Legal factors address compliance requirements, industry regulations, and intellectual property laws impacting market entry and operations.
Import-export Analysis & Pricing Analysis
An import-export analysis is vital for market research, revealing global trade dynamics, trends, and opportunities. It examines trade volumes, product categories, and regional competitiveness, offering insights into supply chains and market demand. This section also analyzes past and future pricing trends, helping businesses optimize strategies and enabling consumers to assess product value effectively.
Poly Aluminium Chloride (PAC) Market: Company Profiles
The report identifies key players in the poly aluminium chloride (PAC) market through a competitive landscape and company profiles, evaluating their offerings, financial performance, strategies, and market positioning. It includes a SWOT analysis of the top 3-5 companies, assessing strengths, weaknesses, opportunities, and threats. The competitive landscape highlights rankings, recent activities (mergers, acquisitions, partnerships, product launches), and regional footprints using the Ace matrix. Customization is available to meet client-specific needs.
Regional & Industry Footprint
This section details the geographic reach, sales networks, and market penetration of companies profiled in the poly aluminium chloride (PAC) report, showcasing their operations and distribution across regions. It analyzes the alignment of companies with specific industry verticals, highlighting the industries they serve and the scope of their products and services within those sectors.
Ace Matrix
This section categorizes companies into four distinct groups—Active, Cutting Edge, Innovator, and Emerging—based on their product and business strategies. The evaluation of product strategy focuses on aspects such as the range and depth of offerings, commitment to innovation, product functionalities, and scalability. Key elements like global reach, sector coverage, strategic acquisitions, and long-term growth plans are considered for business strategy. This analysis provides a detailed view of companies' position within the market and highlights their potential for future growth and development.
Research Methodology
The qualitative and quantitative insights for the poly aluminium chloride (PAC) market are derived through a multi-faceted research approach, combining input from subject matter experts, primary research, and secondary data sources. Primary research includes gathering critical information via face-to-face or telephonic interviews, surveys, questionnaires, and feedback from industry professionals, key opinion leaders (KOLs), and customers. Regular interviews with industry experts are conducted to deepen the analysis and reinforce the existing data, ensuring a robust and well-rounded market understanding.
Secondary research for this report was carried out by the Market Research Store team, drawing on a variety of authoritative sources, such as:
- Official company websites, annual reports, financial statements, investor presentations, and SEC filings
- Internal and external proprietary databases, as well as relevant patent and regulatory databases
- Government publications, national statistical databases, and industry-specific market reports
- Media coverage, including news articles, press releases, and webcasts about market participants
- Paid industry databases for detailed market insights
Market Research Store conducted in-depth consultations with various key opinion leaders in the industry, including senior executives from top companies and regional leaders from end-user organizations. This effort aimed to gather critical insights on factors such as the market share of dominant brands in specific countries and regions, along with pricing strategies for products and services.
To determine total sales data, the research team conducted primary interviews across multiple countries with influential stakeholders, including:
- Distributors
- Marketing, Brand, and Product Managers
- Procurement and Production Managers
- Sales and Regional Sales Managers, Country Managers
- Technical Specialists
- C-Level Executives
These subject matter experts, with their extensive industry experience, helped validate and refine the findings. For secondary research, data was sourced from a wide range of materials, including online resources, company annual reports, industry publications, research papers, association reports, and government websites. These various sources provide a comprehensive and well-rounded perspective on the market.
Frequently Asked Questions
Table Of Content
List of Tables and Figures Figure Product Picture of Poly Aluminium Chloride (PAC) Table Product Specification of Poly Aluminium Chloride (PAC) Figure Market Concentration Ratio and Market Maturity Analysis of Poly Aluminium Chloride (PAC) Figure Global Poly Aluminium Chloride (PAC) Value ($) and Growth Rate from 2014-2024 Table Different Types of Poly Aluminium Chloride (PAC) Figure Global Poly Aluminium Chloride (PAC) Value ($) Segment by Type from 2014-2019 Figure Solid Picture Figure Liquid Picture Table Different Applications of Poly Aluminium Chloride (PAC) Figure Global Poly Aluminium Chloride (PAC) Value ($) Segment by Applications from 2014-2019 Figure Pulp & Paper Picture Figure Textiles Picture Figure Water Treatment Picture Figure Plastic & Rubber Picture Figure Othe Picture Table Research Regions of Poly Aluminium Chloride (PAC) Figure North America Poly Aluminium Chloride (PAC) Production Value ($) and Growth Rate (2014-2019) Figure Europe Poly Aluminium Chloride (PAC) Production Value ($) and Growth Rate (2014-2019) Table China Poly Aluminium Chloride (PAC) Production Value ($) and Growth Rate (2014-2019) Table Japan Poly Aluminium Chloride (PAC) Production Value ($) and Growth Rate (2014-2019) Table Middle East & Africa Poly Aluminium Chloride (PAC) Production Value ($) and Growth Rate (2014-2019) Table India Poly Aluminium Chloride (PAC) Production Value ($) and Growth Rate (2014-2019) Table South America Poly Aluminium Chloride (PAC) Production Value ($) and Growth Rate (2014-2019) Table Emerging Countries of Poly Aluminium Chloride (PAC) Table Growing Market of Poly Aluminium Chloride (PAC) Figure Industry Chain Analysis of Poly Aluminium Chloride (PAC) Table Upstream Raw Material Suppliers of Poly Aluminium Chloride (PAC) with Contact Information Table Major Players Manufacturing Base and Market Share ($) of Poly Aluminium Chloride (PAC) in 2018 Table Major Players Poly Aluminium Chloride (PAC) Product Types in 2018 Figure Production Process of Poly Aluminium Chloride (PAC) Figure Manufacturing Cost Structure of Poly Aluminium Chloride (PAC) Figure Channel Status of Poly Aluminium Chloride (PAC) Table Major Distributors of Poly Aluminium Chloride (PAC) with Contact Information Table Major Downstream Buyers of Poly Aluminium Chloride (PAC) with Contact Information Table Global Poly Aluminium Chloride (PAC) Value ($) by Type (2014-2019) Table Global Poly Aluminium Chloride (PAC) Value ($) Share by Type (2014-2019) Figure Global Poly Aluminium Chloride (PAC) Value ($) Share by Type (2014-2019) Table Global Poly Aluminium Chloride (PAC) Production by Type (2014-2019) Table Global Poly Aluminium Chloride (PAC) Production Share by Type (2014-2019) Figure Global Poly Aluminium Chloride (PAC) Production Share by Type (2014-2019) Figure Global Poly Aluminium Chloride (PAC) Value ($) and Growth Rate of Solid Figure Global Poly Aluminium Chloride (PAC) Value ($) and Growth Rate of Liquid Figure Global Poly Aluminium Chloride (PAC) Price by Type (2014-2019) Table Global Poly Aluminium Chloride (PAC) Consumption by Application (2014-2019) Table Global Poly Aluminium Chloride (PAC) Consumption Market Share by Application (2014-2019) Figure Global Poly Aluminium Chloride (PAC) Consumption Market Share by Application (2014-2019) Table Downstream Buyers Introduction by Application Figure Global Poly Aluminium Chloride (PAC) Consumption and Growth Rate of Pulp & Paper (2014-2019) Figure Global Poly Aluminium Chloride (PAC) Consumption and Growth Rate of Textiles (2014-2019) Figure Global Poly Aluminium Chloride (PAC) Consumption and Growth Rate of Water Treatment (2014-2019) Figure Global Poly Aluminium Chloride (PAC) Consumption and Growth Rate of Plastic & Rubber (2014-2019) Figure Global Poly Aluminium Chloride (PAC) Consumption and Growth Rate of Othe (2014-2019) Table Global Poly Aluminium Chloride (PAC) Value ($) by Region (2014-2019) Table Global Poly Aluminium Chloride (PAC) Value ($) Market Share by Region (2014-2019) Figure Global Poly Aluminium Chloride (PAC) Value ($) Market Share by Region (2014-2019) Table Global Poly Aluminium Chloride (PAC) Production by Region (2014-2019) Table Global Poly Aluminium Chloride (PAC) Production Market Share by Region (2014-2019) Figure Global Poly Aluminium Chloride (PAC) Production Market Share by Region (2014-2019) Table Global Poly Aluminium Chloride (PAC) Production, Value ($), Price and Gross Margin (2014-2019) Table North America Poly Aluminium Chloride (PAC) Production, Value ($), Price and Gross Margin (2014-2019) Table Europe Poly Aluminium Chloride (PAC) Production, Value ($), Price and Gross Margin (2014-2019) Table China Poly Aluminium Chloride (PAC) Production, Value ($), Price and Gross Margin (2014-2019) Table Japan Poly Aluminium Chloride (PAC) Production, Value ($), Price and Gross Margin (2014-2019) Table Middle East & Africa Poly Aluminium Chloride (PAC) Production, Value ($), Price and Gross Margin (2014-2019) Table India Poly Aluminium Chloride (PAC) Production, Value ($), Price and Gross Margin (2014-2019) Table South America Poly Aluminium Chloride (PAC) Production, Value ($), Price and Gross Margin (2014-2019) Table Global Poly Aluminium Chloride (PAC) Consumption by Regions (2014-2019) Figure Global Poly Aluminium Chloride (PAC) Consumption Share by Regions (2014-2019) Table North America Poly Aluminium Chloride (PAC) Production, Consumption, Export, Import (2014-2019) Table Europe Poly Aluminium Chloride (PAC) Production, Consumption, Export, Import (2014-2019) Table China Poly Aluminium Chloride (PAC) Production, Consumption, Export, Import (2014-2019) Table Japan Poly Aluminium Chloride (PAC) Production, Consumption, Export, Import (2014-2019) Table Middle East & Africa Poly Aluminium Chloride (PAC) Production, Consumption, Export, Import (2014-2019) Table India Poly Aluminium Chloride (PAC) Production, Consumption, Export, Import (2014-2019) Table South America Poly Aluminium Chloride (PAC) Production, Consumption, Export, Import (2014-2019) Figure North America Poly Aluminium Chloride (PAC) Production and Growth Rate Analysis Figure North America Poly Aluminium Chloride (PAC) Consumption and Growth Rate Analysis Figure North America Poly Aluminium Chloride (PAC) SWOT Analysis Figure Europe Poly Aluminium Chloride (PAC) Production and Growth Rate Analysis Figure Europe Poly Aluminium Chloride (PAC) Consumption and Growth Rate Analysis Figure Europe Poly Aluminium Chloride (PAC) SWOT Analysis Figure China Poly Aluminium Chloride (PAC) Production and Growth Rate Analysis Figure China Poly Aluminium Chloride (PAC) Consumption and Growth Rate Analysis Figure China Poly Aluminium Chloride (PAC) SWOT Analysis Figure Japan Poly Aluminium Chloride (PAC) Production and Growth Rate Analysis Figure Japan Poly Aluminium Chloride (PAC) Consumption and Growth Rate Analysis Figure Japan Poly Aluminium Chloride (PAC) SWOT Analysis Figure Middle East & Africa Poly Aluminium Chloride (PAC) Production and Growth Rate Analysis Figure Middle East & Africa Poly Aluminium Chloride (PAC) Consumption and Growth Rate Analysis Figure Middle East & Africa Poly Aluminium Chloride (PAC) SWOT Analysis Figure India Poly Aluminium Chloride (PAC) Production and Growth Rate Analysis Figure India Poly Aluminium Chloride (PAC) Consumption and Growth Rate Analysis Figure India Poly Aluminium Chloride (PAC) SWOT Analysis Figure South America Poly Aluminium Chloride (PAC) Production and Growth Rate Analysis Figure South America Poly Aluminium Chloride (PAC) Consumption and Growth Rate Analysis Figure South America Poly Aluminium Chloride (PAC) SWOT Analysis Figure Top 3 Market Share of Poly Aluminium Chloride (PAC) Companies Figure Top 6 Market Share of Poly Aluminium Chloride (PAC) Companies Table Mergers, Acquisitions and Expansion Analysis Table Company Profiles Table Product Introduction Table CCM Production, Value ($), Price, Gross Margin 2014-2019 Figure CCM Production and Growth Rate Figure CCM Value ($) Market Share 2014-2019 Figure CCM Market Share of Poly Aluminium Chloride (PAC) Segmented by Region in 2018 Table Company Profiles Table Product Introduction Table JL Chemtonic Production, Value ($), Price, Gross Margin 2014-2019 Figure JL Chemtonic Production and Growth Rate Figure JL Chemtonic Value ($) Market Share 2014-2019 Figure JL Chemtonic Market Share of Poly Aluminium Chloride (PAC) Segmented by Region in 2018 Table Company Profiles Table Product Introduction Table Filtron Envirotech Production, Value ($), Price, Gross Margin 2014-2019 Figure Filtron Envirotech Production and Growth Rate Figure Filtron Envirotech Value ($) Market Share 2014-2019 Figure Filtron Envirotech Market Share of Poly Aluminium Chloride (PAC) Segmented by Region in 2018 Table Company Profiles Table Product Introduction Table Whizz Water Sdn Bhd Production, Value ($), Price, Gross Margin 2014-2019 Figure Whizz Water Sdn Bhd Production and Growth Rate Figure Whizz Water Sdn Bhd Value ($) Market Share 2014-2019 Figure Whizz Water Sdn Bhd Market Share of Poly Aluminium Chloride (PAC) Segmented by Region in 2018 Table Company Profiles Table Product Introduction Table PT Lautan Luas Tbk Production, Value ($), Price, Gross Margin 2014-2019 Figure PT Lautan Luas Tbk Production and Growth Rate Figure PT Lautan Luas Tbk Value ($) Market Share 2014-2019 Figure PT Lautan Luas Tbk Market Share of Poly Aluminium Chloride (PAC) Segmented by Region in 2018 Table Company Profiles Table Product Introduction Table Xantara Sdn Bhd Production, Value ($), Price, Gross Margin 2014-2019 Figure Xantara Sdn Bhd Production and Growth Rate Figure Xantara Sdn Bhd Value ($) Market Share 2014-2019 Figure Xantara Sdn Bhd Market Share of Poly Aluminium Chloride (PAC) Segmented by Region in 2018 Table Company Profiles Table Product Introduction Table Kemwater Production, Value ($), Price, Gross Margin 2014-2019 Figure Kemwater Production and Growth Rate Figure Kemwater Value ($) Market Share 2014-2019 Figure Kemwater Market Share of Poly Aluminium Chloride (PAC) Segmented by Region in 2018 Table Company Profiles Table Product Introduction Table JSC Southern Basic Chemicals Production, Value ($), Price, Gross Margin 2014-2019 Figure JSC Southern Basic Chemicals Production and Growth Rate Figure JSC Southern Basic Chemicals Value ($) Market Share 2014-2019 Figure JSC Southern Basic Chemicals Market Share of Poly Aluminium Chloride (PAC) Segmented by Region in 2018 Table Company Profiles Table Product Introduction Table Saifu chemicals group Production, Value ($), Price, Gross Margin 2014-2019 Figure Saifu chemicals group Production and Growth Rate Figure Saifu chemicals group Value ($) Market Share 2014-2019 Figure Saifu chemicals group Market Share of Poly Aluminium Chloride (PAC) Segmented by Region in 2018 Table Company Profiles Table Product Introduction Table THAI PAC Industry Company Production, Value ($), Price, Gross Margin 2014-2019 Figure THAI PAC Industry Company Production and Growth Rate Figure THAI PAC Industry Company Value ($) Market Share 2014-2019 Figure THAI PAC Industry Company Market Share of Poly Aluminium Chloride (PAC) Segmented by Region in 2018 Table Company Profiles Table Product Introduction Table Aditya Birla Production, Value ($), Price, Gross Margin 2014-2019 Figure Aditya Birla Production and Growth Rate Figure Aditya Birla Value ($) Market Share 2014-2019 Figure Aditya Birla Market Share of Poly Aluminium Chloride (PAC) Segmented by Region in 2018 Table Company Profiles Table Product Introduction Table Innova Corporate Production, Value ($), Price, Gross Margin 2014-2019 Figure Innova Corporate Production and Growth Rate Figure Innova Corporate Value ($) Market Share 2014-2019 Figure Innova Corporate Market Share of Poly Aluminium Chloride (PAC) Segmented by Region in 2018 Table Company Profiles Table Product Introduction Table J.P enterprise Chemical Corp Production, Value ($), Price, Gross Margin 2014-2019 Figure J.P enterprise Chemical Corp Production and Growth Rate Figure J.P enterprise Chemical Corp Value ($) Market Share 2014-2019 Figure J.P enterprise Chemical Corp Market Share of Poly Aluminium Chloride (PAC) Segmented by Region in 2018 Table Company Profiles Table Product Introduction Table Gujarat Alkalies and Chemicals Production, Value ($), Price, Gross Margin 2014-2019 Figure Gujarat Alkalies and Chemicals Production and Growth Rate Figure Gujarat Alkalies and Chemicals Value ($) Market Share 2014-2019 Figure Gujarat Alkalies and Chemicals Market Share of Poly Aluminium Chloride (PAC) Segmented by Region in 2018 Table Global Poly Aluminium Chloride (PAC) Market Value ($) Forecast, by Type Table Global Poly Aluminium Chloride (PAC) Market Volume Forecast, by Type Figure Global Poly Aluminium Chloride (PAC) Market Value ($) and Growth Rate Forecast of Solid (2019-2024) Figure Global Poly Aluminium Chloride (PAC) Market Volume and Growth Rate Forecast of Solid (2019-2024) Figure Global Poly Aluminium Chloride (PAC) Market Value ($) and Growth Rate Forecast of Liquid (2019-2024) Figure Global Poly Aluminium Chloride (PAC) Market Volume and Growth Rate Forecast of Liquid (2019-2024) Table Global Market Value ($) Forecast by Application (2019-2024) Table Global Market Volume Forecast by Application (2019-2024) Figure Global Poly Aluminium Chloride (PAC) Consumption and Growth Rate of Pulp & Paper (2014-2019) Figure Global Poly Aluminium Chloride (PAC) Consumption and Growth Rate of Textiles (2014-2019) Figure Global Poly Aluminium Chloride (PAC) Consumption and Growth Rate of Water Treatment (2014-2019) Figure Global Poly Aluminium Chloride (PAC) Consumption and Growth Rate of Plastic & Rubber (2014-2019) Figure Global Poly Aluminium Chloride (PAC) Consumption and Growth Rate of Othe (2014-2019) Figure Market Value ($) and Growth Rate Forecast of Othe (2019-2024) Figure Market Volume and Growth Rate Forecast of Othe (2019-2024) Figure North America Market Value ($) and Growth Rate Forecast (2019-2024) Table North America Consumption and Growth Rate Forecast (2019-2024) Figure Europe Market Value ($) and Growth Rate Forecast (2019-2024) Table Europe Consumption and Growth Rate Forecast (2019-2024) Figure China Market Value ($) and Growth Rate Forecast (2019-2024) Table China Consumption and Growth Rate Forecast (2019-2024) Figure Japan Market Value ($) and Growth Rate Forecast (2019-2024) Table Japan Consumption and Growth Rate Forecast (2019-2024) Figure Middle East & Africa Market Value ($) and Growth Rate Forecast (2019-2024) Table Middle East & Africa Consumption and Growth Rate Forecast (2019-2024) Figure India Market Value ($) and Growth Rate Forecast (2019-2024) Table India Consumption and Growth Rate Forecast (2019-2024) Figure South America Market Value ($) and Growth Rate Forecast (2019-2024) Table South America Consumption and Growth Rate Forecast (2019-2024) Figure Industry Resource/Technology/Labor Importance Analysis Table New Entrants SWOT Analysis Table New Project Analysis of Investment Recovery
Inquiry For Buying
Poly Aluminium Chloride (PAC)
Request Sample
Poly Aluminium Chloride (PAC)