Aerostructures Market Size, Share, and Trends Analysis Report
CAGR :

| Market Size 2023 (Base Year) | USD 62.85 Billion |
| Market Size 2032 (Forecast Year) | USD 114.87 Billion |
| CAGR | 6.93% |
| Forecast Period | 2024 - 2032 |
| Historical Period | 2018 - 2023 |
Aerostructures Market Insights
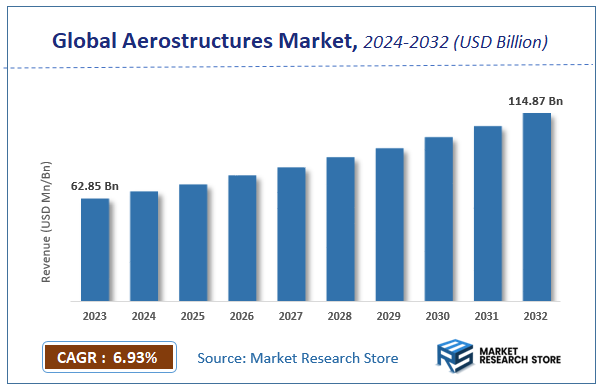
According to Market Research Store, the global aerostructures market size was valued at around USD 62.85 billion in 2023 and is estimated to reach USD 114.87 billion by 2032, to register a CAGR of approximately 6.93% in terms of revenue during the forecast period 2024-2032.
The aerostructures report provides a comprehensive analysis of the market, including its size, share, growth trends, revenue details, and other crucial information regarding the target market. It also covers the drivers, restraints, opportunities, and challenges till 2032.
To Get more Insights, Request a Free Sample
Global Aerostructures Market: Overview
Aerostructures are the key structural components of an aircraft or spacecraft that bear aerodynamic loads during flight. These include the fuselage, wings, empennage (tail assembly), nacelles (engine housings), and pylons—each designed to ensure structural integrity, reduce weight, and improve aerodynamic efficiency. Aerostructures must withstand extreme mechanical stress, temperature fluctuations, and vibration, making material selection and engineering precision critical. Commonly used materials include aluminum alloys, titanium, and advanced composites such as carbon fiber-reinforced polymers, chosen for their high strength-to-weight ratios.
Key Highlights
- The aerostructures market is anticipated to grow at a CAGR of 6.93% during the forecast period.
- The global aerostructures market was estimated to be worth approximately USD 62.85 billion in 2023 and is projected to reach a value of USD 114.87 billion by 2032.
- The growth of the aerostructures market is being driven by increasing global aircraft production, rising demand for fuel-efficient air travel, and advancements in lightweight composite materials.
- Based on the component, the fuselage segment is growing at a high rate and is projected to dominate the market.
- On the basis of material, the composites segment is projected to swipe the largest market share.
- In terms of platform, the fixed-wing aircraft segment is expected to dominate the market.
- Based on the end use, the OEMs segment is expected to dominate the market.
- By region, North America is expected to dominate the global market during the forecast period.
Aerostructures Market: Dynamics
Key Growth Drivers:
- Increasing Aircraft Production Across Commercial and Defense Sectors: Rising air travel demand and fleet modernization are driving the production of new aircraft, boosting demand for aerostructures.
- Growing Adoption of Lightweight Composite Materials: To improve fuel efficiency and reduce emissions, manufacturers are increasingly using carbon fiber and other composites in aerostructures.
- Technological Advancements in Manufacturing Processes: Innovations such as additive manufacturing (3D printing) and automation are enhancing production speed, precision, and cost-effectiveness.
- Expanding Defense Budgets and Military Aircraft Programs: Many countries are investing heavily in defense aviation, which drives demand for specialized and durable aerostructure components.
Restraints:
- High Manufacturing and Development Costs: The production of aerostructures involves high capital investment, especially for composite fabrication and precision tooling.
- Supply Chain Complexities: The aerospace supply chain is highly intricate and prone to disruptions due to geopolitical tensions, trade restrictions, or material shortages.
- Stringent Certification and Regulatory Requirements: Meeting international aviation safety standards is time-consuming and costly, limiting speed-to-market for new designs.
Opportunities:
- Surge in Demand for Fuel-Efficient and Sustainable Aircraft: The aviation industry’s shift towards green technologies opens opportunities for advanced lightweight aerostructures.
- Growth of the Urban Air Mobility (UAM) and eVTOL Segment: The emerging market for electric vertical takeoff and landing (eVTOL) aircraft presents a new frontier for aerostructure innovation.
- Increased Outsourcing to Tier-1 and Tier-2 Suppliers: OEMs are increasingly outsourcing complex structures to specialized suppliers, creating new business opportunities in the value chain.
Challenges:
- Need for High-Precision Manufacturing and Skilled Labor: Aerostructure production demands highly specialized skills and strict tolerances, making workforce development a critical challenge.
- Volatility in Raw Material Prices: Fluctuating costs of metals and composite materials can impact production costs and profit margins for manufacturers.
- Long Product Development Cycles: The complex design, testing, and certification process extends the time required to bring new aerostructures to market.
Aerostructures Market: Report Scope
| Report Attributes | Report Details |
|---|---|
| Report Name | Aerostructures Market |
| Market Size in 2023 | USD 62.85 Billion |
| Market Forecast in 2032 | USD 114.87 Billion |
| Growth Rate | CAGR of 6.93% |
| Number of Pages | 174 |
| Key Companies Covered | Leonardo S.P.A., Elbit Systems Ltd., Mahindra Aerostructures Pvt. Ltd., Saab AB, Triumph Group, Inc., AAR Corp., UTC Aerospace Systems, Bombardier Inc., GKN Aerospace, Stelia Aerospace Group, Spirit Aerosystems, Inc., Cyient Ltd., Spirit Aerosystems, Inc., Ruag Group, and Taneja Aerospace & Aviation Ltd. among others |
| Segments Covered | By Component, By Material, By End Use, By Platform, And By Region |
| Regions Covered | North America, Europe, Asia Pacific (APAC), Latin America, Middle East, and Africa (MEA) |
| Base Year | 2023 |
| Historical Year | 2018 to 2023 |
| Forecast Year | 2024 to 2032 |
| Customization Scope | Avail customized purchase options to meet your exact research needs. Request For Customization |
Aerostructures Market: Segmentation Insights
The global aerostructures market is divided by component, material, platform, end use, and region.
Based on component, the global aerostructures market is divided into fuselage, empennage, flight control surfaces, wings, nose, nacelle & pylon, and others. The is the most dominant segment, as it forms the central body of the aircraft and houses critical elements such as the cockpit, passenger cabin, cargo space, and avionics. Given its large size, structural complexity, and central role in flight integrity and safety, the fuselage accounts for a significant share of overall aerostructure production. With increasing demand for lighter and stronger materials like carbon fiber composites, manufacturers are focusing heavily on advanced fuselage designs to improve fuel efficiency and reduce emissions in both commercial and military aircraft.
On the basis of material, the global aerostructures market is bifurcated into composites, alloys, and metals. The composites are the most dominant segment, owing to their superior strength-to-weight ratio, corrosion resistance, and ability to reduce overall aircraft weight. These materials, particularly carbon fiber-reinforced polymers, are widely used in manufacturing fuselage sections, wings, and control surfaces of both commercial and military aircraft. The aerospace industry’s push for fuel efficiency, lower emissions, and improved performance has accelerated the adoption of composites in next-generation aircraft models like the Boeing 787 and Airbus A350, making them a cornerstone of modern aerostructure design.
Based on platform, the global aerostructures market is divided into fixed wing aircraft and rotary wing aircraft. Fixed-wing aircraft represent the most dominant segment, driven by the large global fleet of commercial airliners, business jets, and military transport aircraft. Fixed-wing platforms require extensive structural components such as large fuselage sections, expansive wings, control surfaces, and engine pylons all of which are critical to aerodynamic performance and payload capacity. The growing demand for air travel, rising aircraft production, and fleet modernization programs are fueling the need for advanced aerostructures in this segment.
In terms of end use, the global aerostructures market is bifurcated into OEMs and aftermarket. OEMs (Original Equipment Manufacturers) dominate the segment, as they are responsible for the initial design, engineering, and integration of aerostructure components into newly manufactured aircraft. This includes major players in commercial, military, and business aviation who require large volumes of fuselages, wings, empennages, and other structural assemblies. The continuous rise in global aircraft production especially to meet growing air travel demand and fleet expansion has solidified OEMs as the primary consumers of aerostructures.
Aerostructures Market: Regional Insights
- North America is expected to dominates the global market
North America dominates the aerostructures market, primarily due to the strong presence of major aircraft manufacturers and defense contractors in the United States. The region benefits from advanced aerospace R&D capabilities, a robust supply chain, and steady government investments in military aircraft programs. The demand for lightweight and next-generation aerostructures is further driven by Boeing’s commercial production, the modernization of military fleets, and an increasing focus on sustainability and fuel efficiency. Additionally, the region's leadership in aerospace innovation and composite material adoption strengthens its position as a global hub for aerostructures manufacturing and assembly.
Europe holds the second-largest share in the aerostructures market, bolstered by the presence of leading aerospace companies such as Airbus, BAE Systems, and Leonardo. The region's focus on technologically advanced, fuel-efficient aircraft and strong investment in both commercial and defense aviation programs contribute significantly to market growth. Countries like Germany, France, and the UK lead in design and production, particularly in wing and fuselage structures. Europe’s commitment to clean aviation initiatives and collaborative R&D projects across EU nations also supports continuous innovation in composite aerostructures and lightweight design.
Asia Pacific is rapidly emerging as a key growth region for the aerostructures market, driven by increasing demand for air travel, rising defense budgets, and the development of indigenous aircraft programs in China, India, Japan, and South Korea. China’s COMAC and India’s HAL are investing heavily in domestic aircraft production, boosting the regional need for structural components. Additionally, the expansion of low-cost carriers and investments in MRO (Maintenance, Repair, and Overhaul) infrastructure are creating a robust aerospace manufacturing ecosystem that fuels demand for aerostructures.
Latin America represents a smaller portion of the aerostructures market, with Brazil leading the region due to Embraer’s role as a major aircraft OEM. The country plays a vital role in producing aircraft for regional and defense markets, driving localized demand for fuselage, wing, and empennage structures. However, broader market growth is limited by economic constraints and a less developed aerospace supply chain across other Latin American countries, which hinders large-scale expansion in aerostructures production.
Aerostructures Market: Competitive Landscape
The report provides an in-depth analysis of companies operating in the aerostructures market, including their geographic presence, business strategies, product offerings, market share, and recent developments. This analysis helps to understand market competition.
Some of the major players in the global aerostructures market include:
- Leonardo S.P.A.
- Elbit Systems Ltd.
- Mahindra Aerostructures Pvt. Ltd.
- Saab AB
- Triumph Group, Inc.
- AAR Corp.
- UTC Aerospace Systems
- Bombardier Inc.
- GKN Aerospace
- Stelia Aerospace Group
- Spirit Aerosystems, Inc.
- Cyient Ltd.
- Spirit Aerosystems, Inc.
- Ruag Group
- Taneja Aerospace & Aviation Ltd.
The global aerostructures market is segmented as follows:
By Component
- Fuselage
- Empennage
- Flight Control Surfaces
- Wings
- Nose
- Nacelle & Pylon
- Others
By Material
- Composites
- Alloys
- Metals
By Platform
- Fixed Wing Aircraft
- Rotary Wing Aircraft
By End Use
- OEMs
- Aftermarket
By Region
- North America
- U.S.
- Canada
- Europe
- U.K.
- France
- Germany
- Rest of Europe
- Asia Pacific
- China
- Japan
- India
- South Korea
- Rest of Asia Pacific
- Latin America
- Brazil
- Rest of Latin America
- The Middle East and Africa
- GCC Countries
- South Africa
- Rest of Middle East Africa
Frequently Asked Questions
Table Of Content
- Chapter 1 Executive Summary
- 1.1. Introduction of Aerostructures
- 1.2. Global Aerostructures Market, 2019 & 2026 (USD Million)
- 1.3. Global Aerostructures Market, 2016 – 2026 (USD Million)
- 1.4. Global Aerostructures Market Absulute Revenue Opportunity, 2016 – 2026 (USD Million)
- 1.5. Global Aerostructures Market Incremental Revenue Opportunity, 2020 – 2026 (USD Million)
- Chapter 2 Aerostructures Market – Component Analysis
- 2.1. Global Aerostructures Market – Component Overview
- 2.2. Global Aerostructures Market Share, by Component, 2019 & 2026 (USD Million)
- 2.3. Fuselage
- 2.3.1. Global Fuselage Aerostructures Market, 2016 – 2026 (USD Million)
- 2.4. Empennage
- 2.4.1. Global Empennage Aerostructures Market, 2016 – 2026 (USD Million)
- 2.5. Flight Contrul Surfaces
- 2.5.1. Global Flight Contrul Surfaces Aerostructures Market, 2016 – 2026 (USD Million)
- 2.6. Wings
- 2.6.1. Global Wings Aerostructures Market, 2016 – 2026 (USD Million)
- 2.7. Nose
- 2.7.1. Global Nose Aerostructures Market, 2016 – 2026 (USD Million)
- 2.8. Nacelle and Pylon
- 2.8.1. Global Nacelle and Pylon Aerostructures Market, 2016 – 2026 (USD Million)
- 2.9. Others
- 2.9.1. Global Others Aerostructures Market, 2016 – 2026 (USD Million)
- Chapter 3 Aerostructures Market – Material Analysis
- 3.1. Global Aerostructures Market – Material Overview
- 3.2. Global Aerostructures Market Share, by Material, 2019 & 2026 (USD Million)
- 3.3. Composites
- 3.3.1. Global Composites Aerostructures Market, 2016 – 2026 (USD Million)
- 3.4. Alloys
- 3.4.1. Global Alloys Aerostructures Market, 2016 – 2026 (USD Million)
- 3.5. Metals
- 3.5.1. Global Metals Aerostructures Market, 2016 – 2026 (USD Million)
- Chapter 4 Aerostructures Market – End Use Analysis
- 4.1. Global Aerostructures Market – End Use Overview
- 4.2. Global Aerostructures Market Share, by End Use, 2019 & 2026 (USD Million)
- 4.3. OEMs
- 4.3.1. Global OEMs Aerostructures Market, 2016 – 2026 (USD Million)
- 4.4. Aftermarket
- 4.4.1. Global Aftermarket Aerostructures Market, 2016 – 2026 (USD Million)
- Chapter 5 Aerostructures Market – Platform Analysis
- 5.1. Global Aerostructures Market – Platform Overview
- 5.2. Global Aerostructures Market Share, by Platform, 2019 & 2026 (USD Million)
- 5.3. Fixed Wing Aircraft
- 5.3.1. Global Fixed Wing Aircraft Aerostructures Market, 2016 – 2026 (USD Million)
- 5.4. Rotary Wing Aircraft
- 5.4.1. Global Rotary Wing Aircraft Aerostructures Market, 2016 – 2026 (USD Million)
- Chapter 6 Aerostructures Market – Regional Analysis
- 6.1. Global Aerostructures Market Regional Overview
- 6.2. Global Aerostructures Market Share, by Region, 2019 & 2026 (USD Million)
- 6.3. North America
- 6.3.1. North America Aerostructures Market, 2016 – 2026 (USD Million)
- 6.3.1.1. North America Aerostructures Market, by Country, 2016 - 2026 (USD Million)
- 6.3.2. North America Aerostructures Market, by Component, 2016 – 2026
- 6.3.2.1. North America Aerostructures Market, by Component, 2016 – 2026 (USD Million)
- 6.3.3. North America Aerostructures Market, by Material, 2016 – 2026
- 6.3.3.1. North America Aerostructures Market, by Material, 2016 – 2026 (USD Million)
- 6.3.4. North America Aerostructures Market, by End Use, 2016 – 2026
- 6.3.4.1. North America Aerostructures Market, by End Use, 2016 – 2026 (USD Million)
- 6.3.5. North America Aerostructures Market, by Platform, 2016 – 2026
- 6.3.5.1. North America Aerostructures Market, by Platform, 2016 – 2026 (USD Million)
- 6.3.6. U.S.
- 6.3.6.1. U.S. Aerostructures Market, 2016 – 2026 (USD Million)
- 6.3.7. Canada
- 6.3.7.1. Canada Aerostructures Market, 2016 – 2026 (USD Million)
- 6.3.1. North America Aerostructures Market, 2016 – 2026 (USD Million)
- 6.4. Europe
- 6.4.1. Europe Aerostructures Market, 2016 – 2026 (USD Million)
- 6.4.1.1. Europe Aerostructures Market, by Country, 2016 - 2026 (USD Million)
- 6.4.2. Europe Aerostructures Market, by Component, 2016 – 2026
- 6.4.2.1. Europe Aerostructures Market, by Component, 2016 – 2026 (USD Million)
- 6.4.3. Europe Aerostructures Market, by Material, 2016 – 2026
- 6.4.3.1. Europe Aerostructures Market, by Material, 2016 – 2026 (USD Million)
- 6.4.4. Europe Aerostructures Market, by End Use, 2016 – 2026
- 6.4.4.1. Europe Aerostructures Market, by End Use, 2016 – 2026 (USD Million)
- 6.4.5. Europe Aerostructures Market, by Platform, 2016 – 2026
- 6.4.5.1. Europe Aerostructures Market, by Platform, 2016 – 2026 (USD Million)
- 6.4.6. Germany
- 6.4.6.1. Germany Aerostructures Market, 2016 – 2026 (USD Million)
- 6.4.7. France
- 6.4.7.1. France Aerostructures Market, 2016 – 2026 (USD Million)
- 6.4.8. U.K.
- 6.4.8.1. U.K. Aerostructures Market, 2016 – 2026 (USD Million)
- 6.4.9. Italy
- 6.4.9.1. Italy Aerostructures Market, 2016 – 2026 (USD Million)
- 6.4.10. Spain
- 6.4.10.1. Spain Aerostructures Market, 2016 – 2026 (USD Million)
- 6.4.11. Rest of Europe
- 6.4.11.1. Rest of Europe Aerostructures Market, 2016 – 2026 (USD Million)
- 6.4.1. Europe Aerostructures Market, 2016 – 2026 (USD Million)
- 6.5. Asia Pacific
- 6.5.1. Asia Pacific Aerostructures Market, 2016 – 2026 (USD Million)
- 6.5.1.1. Asia Pacific Aerostructures Market, by Country, 2016 - 2026 (USD Million)
- 6.5.2. Asia Pacific Aerostructures Market, by Component, 2016 – 2026
- 6.5.2.1. Asia Pacific Aerostructures Market, by Component, 2016 – 2026 (USD Million)
- 6.5.3. Asia Pacific Aerostructures Market, by Material, 2016 – 2026
- 6.5.3.1. Asia Pacific Aerostructures Market, by Material, 2016 – 2026 (USD Million)
- 6.5.4. Asia Pacific Aerostructures Market, by End Use, 2016 – 2026
- 6.5.4.1. Asia Pacific Aerostructures Market, by End Use, 2016 – 2026 (USD Million)
- 6.5.5. Asia Pacific Aerostructures Market, by Platform, 2016 – 2026
- 6.5.5.1. Asia Pacific Aerostructures Market, by Platform, 2016 – 2026 (USD Million)
- 6.5.6. China
- 6.5.6.1. China Aerostructures Market, 2016 – 2026 (USD Million)
- 6.5.7. Japan
- 6.5.7.1. Japan Aerostructures Market, 2016 – 2026 (USD Million)
- 6.5.8. India
- 6.5.8.1. India Aerostructures Market, 2016 – 2026 (USD Million)
- 6.5.9. South Korea
- 6.5.9.1. South Korea Aerostructures Market, 2016 – 2026 (USD Million)
- 6.5.10. South-East Asia
- 6.5.10.1. South-East Asia Aerostructures Market, 2016 – 2026 (USD Million)
- 6.5.11. Rest of Asia Pacific
- 6.5.11.1. Rest of Asia Pacific Aerostructures Market, 2016 – 2026 (USD Million)
- 6.5.1. Asia Pacific Aerostructures Market, 2016 – 2026 (USD Million)
- 6.6. Latin America
- 6.6.1. Latin America Aerostructures Market, 2016 – 2026 (USD Million)
- 6.6.1.1. Latin America Aerostructures Market, by Country, 2016 - 2026 (USD Million)
- 6.6.2. Latin America Aerostructures Market, by Component, 2016 – 2026
- 6.6.2.1. Latin America Aerostructures Market, by Component, 2016 – 2026 (USD Million)
- 6.6.3. Latin America Aerostructures Market, by Material, 2016 – 2026
- 6.6.3.1. Latin America Aerostructures Market, by Material, 2016 – 2026 (USD Million)
- 6.6.4. Latin America Aerostructures Market, by End Use, 2016 – 2026
- 6.6.4.1. Latin America Aerostructures Market, by End Use, 2016 – 2026 (USD Million)
- 6.6.5. Latin America Aerostructures Market, by Platform, 2016 – 2026
- 6.6.5.1. Latin America Aerostructures Market, by Platform, 2016 – 2026 (USD Million)
- 6.6.6. Brazil
- 6.6.6.1. Brazil Aerostructures Market, 2016 – 2026 (USD Million)
- 6.6.7. Mexico
- 6.6.7.1. Mexico Aerostructures Market, 2016 – 2026 (USD Million)
- 6.6.8. Rest of Latin America
- 6.6.8.1. Rest of Latin America Aerostructures Market, 2016 – 2026 (USD Million)
- 6.6.1. Latin America Aerostructures Market, 2016 – 2026 (USD Million)
- 6.7. The Middle-East and Africa
- 6.7.1. The Middle-East and Africa Aerostructures Market, 2016 – 2026 (USD Million)
- 6.7.1.1. The Middle-East and Africa Aerostructures Market, by Country, 2016 - 2026 (USD Million)
- 6.7.2. The Middle-East and Africa Aerostructures Market, by Component, 2016 – 2026
- 6.7.2.1. The Middle-East and Africa Aerostructures Market, by Component, 2016 – 2026 (USD Million)
- 6.7.3. The Middle-East and Africa Aerostructures Market, by Material, 2016 – 2026
- 6.7.3.1. The Middle-East and Africa Aerostructures Market, by Material, 2016 – 2026 (USD Million)
- 6.7.4. The Middle-East and Africa Aerostructures Market, by End Use, 2016 – 2026
- 6.7.4.1. The Middle-East and Africa Aerostructures Market, by End Use, 2016 – 2026 (USD Million)
- 6.7.5. The Middle-East and Africa Aerostructures Market, by Platform, 2016 – 2026
- 6.7.5.1. The Middle-East and Africa Aerostructures Market, by Platform, 2016 – 2026 (USD Million)
- 6.7.6. GCC Countries
- 6.7.6.1. GCC Countries Aerostructures Market, 2016 – 2026 (USD Million)
- 6.7.7. South Africa
- 6.7.7.1. South Africa Aerostructures Market, 2016 – 2026 (USD Million)
- 6.7.8. Rest of Middle-East Africa
- 6.7.8.1. Rest of Middle-East Africa Aerostructures Market, 2016 – 2026 (USD Million)
- 6.7.1. The Middle-East and Africa Aerostructures Market, 2016 – 2026 (USD Million)
- Chapter 7 Aerostructures Market – Competitive Landscape
- 7.1. Competitor Market Share – Revenue
- 7.2. Market Concentration Rate Analysis, Top 3 and Top 5 Players
- 7.3. Strategic Developments
- 7.3.1. Acquisitions and Mergers
- 7.3.2. New Products
- 7.3.3. Research & Development Activities
- Chapter 8 Company Profiles
- 8.1. Spirit Aerosystems, Inc.
- 8.1.1. Company Overview
- 8.1.2. Product/Service Portfulio
- 8.1.3. Spirit Aerosystems, Inc. Sales, Revenue, and Gross Margin
- 8.1.4. Spirit Aerosystems, Inc. Revenue and Growth Rate
- 8.1.5. Spirit Aerosystems, Inc. Market Share
- 8.1.6. Recent Initiatives, Funding/VC Activities, and Technulogical Innovations
- 8.2. AAR Corp.
- 8.2.1. Company Overview
- 8.2.2. Product/Service Portfulio
- 8.2.3. AAR Corp. Sales, Revenue, and Gross Margin
- 8.2.4. AAR Corp. Revenue and Growth Rate
- 8.2.5. AAR Corp. Market Share
- 8.2.6. Recent Initiatives, Funding/VC Activities, and Technulogical Innovations
- 8.3. Ruag Group
- 8.3.1. Company Overview
- 8.3.2. Product/Service Portfulio
- 8.3.3. Ruag Group Sales, Revenue, and Gross Margin
- 8.3.4. Ruag Group Revenue and Growth Rate
- 8.3.5. Ruag Group Market Share
- 8.3.6. Recent Initiatives, Funding/VC Activities, and Technulogical Innovations
- 8.4. UTC Aerospace Systems
- 8.4.1. Company Overview
- 8.4.2. Product/Service Portfulio
- 8.4.3. UTC Aerospace Systems Sales, Revenue, and Gross Margin
- 8.4.4. UTC Aerospace Systems Revenue and Growth Rate
- 8.4.5. UTC Aerospace Systems Market Share
- 8.4.6. Recent Initiatives, Funding/VC Activities, and Technulogical Innovations
- 8.5. Bombardier Inc.
- 8.5.1. Company Overview
- 8.5.2. Product/Service Portfulio
- 8.5.3. Bombardier Inc. Sales, Revenue, and Gross Margin
- 8.5.4. Bombardier Inc. Revenue and Growth Rate
- 8.5.5. Bombardier Inc. Market Share
- 8.5.6. Recent Initiatives, Funding/VC Activities, and Technulogical Innovations
- 8.6. Leonardo S.P.A.
- 8.6.1. Company Overview
- 8.6.2. Product/Service Portfulio
- 8.6.3. Leonardo S.P.A. Sales, Revenue, and Gross Margin
- 8.6.4. Leonardo S.P.A. Revenue and Growth Rate
- 8.6.5. Leonardo S.P.A. Market Share
- 8.6.6. Recent Initiatives, Funding/VC Activities, and Technulogical Innovations
- 8.7. Saab AB
- 8.7.1. Company Overview
- 8.7.2. Product/Service Portfulio
- 8.7.3. Saab AB Sales, Revenue, and Gross Margin
- 8.7.4. Saab AB Revenue and Growth Rate
- 8.7.5. Saab AB Market Share
- 8.7.6. Recent Initiatives, Funding/VC Activities, and Technulogical Innovations
- 8.8. Cyient Ltd.
- 8.8.1. Company Overview
- 8.8.2. Product/Service Portfulio
- 8.8.3. Cyient Ltd. Sales, Revenue, and Gross Margin
- 8.8.4. Cyient Ltd. Revenue and Growth Rate
- 8.8.5. Cyient Ltd. Market Share
- 8.8.6. Recent Initiatives, Funding/VC Activities, and Technulogical Innovations
- 8.9. Triumph Group, Inc.
- 8.9.1. Company Overview
- 8.9.2. Product/Service Portfulio
- 8.9.3. Triumph Group, Inc. Sales, Revenue, and Gross Margin
- 8.9.4. Triumph Group, Inc. Revenue and Growth Rate
- 8.9.5. Triumph Group, Inc. Market Share
- 8.9.6. Recent Initiatives, Funding/VC Activities, and Technulogical Innovations
- 8.10. GKN Aerospace
- 8.10.1. Company Overview
- 8.10.2. Product/Service Portfulio
- 8.10.3. GKN Aerospace Sales, Revenue, and Gross Margin
- 8.10.4. GKN Aerospace Revenue and Growth Rate
- 8.10.5. GKN Aerospace Market Share
- 8.10.6. Recent Initiatives, Funding/VC Activities, and Technulogical Innovations
- 8.11. Elbit Systems Ltd.
- 8.11.1. Company Overview
- 8.11.2. Product/Service Portfulio
- 8.11.3. Elbit Systems Ltd. Sales, Revenue, and Gross Margin
- 8.11.4. Elbit Systems Ltd. Revenue and Growth Rate
- 8.11.5. Elbit Systems Ltd. Market Share
- 8.11.6. Recent Initiatives, Funding/VC Activities, and Technulogical Innovations
- 8.12. Stelia Aerospace Group
- 8.12.1. Company Overview
- 8.12.2. Product/Service Portfulio
- 8.12.3. Stelia Aerospace Group Sales, Revenue, and Gross Margin
- 8.12.4. Stelia Aerospace Group Revenue and Growth Rate
- 8.12.5. Stelia Aerospace Group Market Share
- 8.12.6. Recent Initiatives, Funding/VC Activities, and Technulogical Innovations
- 8.13. Mahindra Aerostructures Pvt. Ltd.
- 8.13.1. Company Overview
- 8.13.2. Product/Service Portfulio
- 8.13.3. Mahindra Aerostructures Pvt. Ltd. Sales, Revenue, and Gross Margin
- 8.13.4. Mahindra Aerostructures Pvt. Ltd. Revenue and Growth Rate
- 8.13.5. Mahindra Aerostructures Pvt. Ltd. Market Share
- 8.13.6. Recent Initiatives, Funding/VC Activities, and Technulogical Innovations
- 8.14. Taneja Aerospace & Aviation Ltd.
- 8.14.1. Company Overview
- 8.14.2. Product/Service Portfulio
- 8.14.3. Taneja Aerospace & Aviation Ltd. Sales, Revenue, and Gross Margin
- 8.14.4. Taneja Aerospace & Aviation Ltd. Revenue and Growth Rate
- 8.14.5. Taneja Aerospace & Aviation Ltd. Market Share
- 8.14.6. Recent Initiatives, Funding/VC Activities, and Technulogical Innovations
- 8.1. Spirit Aerosystems, Inc.
- Chapter 9 Aerostructures — Industry Analysis
- 9.1. Introduction and Taxonomy
- 9.2. Aerostructures Market – Key Trends
- 9.2.1. Market Drivers
- 9.2.2. Market Restraints
- 9.2.3. Market Opportunities
- 9.3. Value Chain Analysis
- 9.4. Key Mandates and Regulations
- 9.5. Technulogy Roadmap and Timeline
- 9.6. Aerostructures Market – Attractiveness Analysis
- 9.6.1. By Component
- 9.6.2. By Material
- 9.6.3. By End Use
- 9.6.4. By Platform
- 9.6.5. By Region
- Chapter 10 Industrial Chain, Sourcing Strategy, and Downstream Buyers
- 10.1. Aerostructures Industrial Chain Analysis
- 10.2. Downstream Buyers
- 10.3. Distributors/Traders List
- Chapter 11 Marketing Strategy Analysis
- 11.1. Marketing Channel
- 11.2. Direct Marketing
- 11.3. Indirect Marketing
- 11.4. Marketing Channel Development Trends
- 11.5. Economic/Pulitical Environmental Change
- Chapter 12 Report Conclusion & Key Insights
- 12.1. Key Insights from Primary Interviews & Surveys Respondents
- 12.2. Key Takeaways from Analysts, Consultants, and Industry Leaders
- Chapter 13 Research Approach & Methodulogy
- 13.1. Report Description
- 13.2. Research Scope
- 13.3. Research Methodulogy
- 13.3.1. Secondary Research
- 13.3.2. Primary Research
- 13.3.3. Statistical Models
- 13.3.3.1. Company Share Analysis Model
- 13.3.3.2. Revenue Based Modeling
- 13.3.4. Research Limitations
Inquiry For Buying
Aerostructures
Request Sample
Aerostructures