Agent Performance Optimization (APO) Market Size, Share, and Trends Analysis Report
CAGR :

| Market Size 2023 (Base Year) | USD 3.74 Billion |
| Market Size 2032 (Forecast Year) | USD 10.86 Billion |
| CAGR | 12.58% |
| Forecast Period | 2024 - 2032 |
| Historical Period | 2018 - 2023 |
Agent Performance Optimization (APO) Market Insights
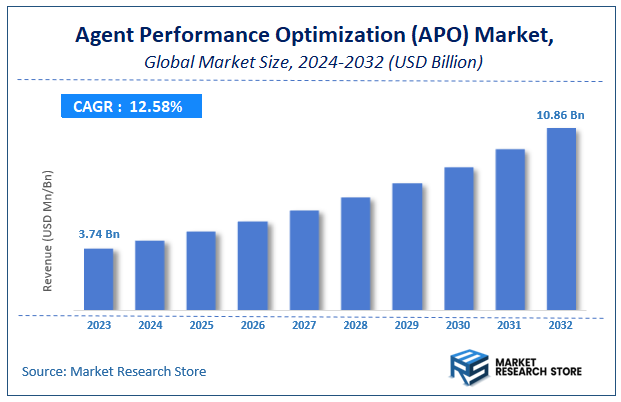
According to Market Research Store, the global agent performance optimization (APO) market size was valued at around USD 3.74 billion in 2023 and is estimated to reach USD 10.86 billion by 2032, to register a CAGR of approximately 12.58% in terms of revenue during the forecast period 2024-2032.
The agent performance optimization (APO) report provides a comprehensive analysis of the market, including its size, share, growth trends, revenue details, and other crucial information regarding the target market. It also covers the drivers, restraints, opportunities, and challenges till 2032.
To Get more Insights, Request a Free Sample
Global Agent Performance Optimization (APO) Market: Overview
Agent Performance Optimization (APO) refers to a suite of strategies, technologies, and tools designed to enhance the productivity, efficiency, and effectiveness of customer service agents, particularly within contact centers and customer support environments. APO solutions encompass performance analytics, quality monitoring, training and coaching modules, gamification, and workforce engagement tools. These systems help organizations identify skill gaps, monitor agent interactions, deliver personalized feedback, and motivate agents to meet key performance indicators (KPIs).
Key Highlights
- The agent performance optimization (APO) market is anticipated to grow at a CAGR of 12.58% during the forecast period.
- The global agent performance optimization (APO) market was estimated to be worth approximately USD 3.74 billion in 2023 and is projected to reach a value of USD 10.86 billion by 2032.
- The growth of the agent performance optimization (APO) market is being driven by rising demand for enhanced customer experience, digital transformation of contact centers, and the integration of artificial intelligence (AI) and machine learning (ML) into performance management solutions.
- Based on the deployment mode, the cloud-based segment is growing at a high rate and is projected to dominate the market.
- On the basis of component, the software segment is projected to swipe the largest market share.
- In terms of application, the contact center optimization segment is expected to dominate the market.
- Based on the end user, the BFSI segment is expected to dominate the market.
- By region, North America is expected to dominate the global market during the forecast period.
Agent Performance Optimization (APO) Market: Dynamics
Key Growth Drivers:
- Rising Demand for Enhanced Customer Experience: Companies are increasingly prioritizing customer satisfaction, pushing demand for APO solutions that help monitor and improve agent interactions, response times, and overall service quality.
- Adoption of AI and Analytics in Contact Centers: The integration of artificial intelligence and advanced analytics allows real-time performance tracking, predictive insights, and automated feedback, significantly enhancing the efficiency of APO systems.
- Shift Toward Cloud-Based Solutions: Cloud platforms offer scalability, real-time data access, and easy integration with CRM and workforce management tools, making them an attractive choice for companies investing in APO technologies.
Restraints:
- High Initial Implementation Costs: Small and medium-sized enterprises may struggle to invest in APO systems due to the high setup costs, customization requirements, and training expenses.
- Data Privacy and Security Concerns: As APO tools collect and analyze large volumes of agent-customer interaction data, ensuring data protection and compliance with privacy regulations remains a critical concern for many organizations.
Opportunities:
- Growing Outsourcing and Remote Work Models: The rise of remote customer service teams and BPOs presents opportunities for APO vendors to offer scalable, location-independent solutions tailored for virtual environments.
- Emerging Markets Adoption: Developing regions are beginning to embrace digital transformation in customer service, opening new growth avenues for APO providers through localized and cost-effective offerings.
Challenges:
- Integration with Legacy Systems: Many organizations still rely on outdated customer support infrastructure, making it challenging to integrate modern APO platforms without operational disruptions or added costs.
- Lack of Skilled Personnel: The effective use of APO tools requires trained analysts and supervisors capable of interpreting insights and executing performance strategies—skills that are often lacking in understaffed or resource-constrained environments.
Agent Performance Optimization (APO) Market: Report Scope
This report thoroughly analyzes the Agent Performance Optimization (APO) Market, exploring its historical trends, current state, and future projections. The market estimates presented result from a robust research methodology, incorporating primary research, secondary sources, and expert opinions. These estimates are influenced by the prevailing market dynamics as well as key economic, social, and political factors. Furthermore, the report considers the impact of regulations, government expenditures, and advancements in research and development on the market. Both positive and negative shifts are evaluated to ensure a comprehensive and accurate market outlook.
| Report Attributes | Report Details |
|---|---|
| Report Name | Agent Performance Optimization (APO) Market |
| Market Size in 2023 | USD 3.74 Billion |
| Market Forecast in 2032 | USD 10.86 Billion |
| Growth Rate | CAGR of 12.58% |
| Number of Pages | 145 |
| Key Companies Covered | ZOOM International, NICE Ltd, HigherGround, Inc., Genesys, CallFinder, Verint Systems Inc, CallMiner, Aspect, Envision Telephony, Calabrio, Upstream Works Software, Five9, InVision AG, and Teleopti AB |
| Segments Covered | By Deployment Mode, By Component, By Application, By End User, And By Region |
| Regions Covered | North America, Europe, Asia Pacific (APAC), Latin America, Middle East, and Africa (MEA) |
| Base Year | 2023 |
| Historical Year | 2018 to 2023 |
| Forecast Year | 2024 to 2032 |
| Customization Scope | Avail customized purchase options to meet your exact research needs. Request For Customization |
Agent Performance Optimization (APO) Market: Segmentation Insights
The global agent performance optimization (APO) market is divided by deployment mode, component, application, end user, and region.
Based on deployment mode, the global agent performance optimization (APO) market is divided into cloud-based and on-premises. The cloud-based deployment segment has emerged as the most dominant and widely adopted model. Organizations across various industries are increasingly opting for cloud-based APO solutions due to their scalability, flexibility, and cost-effectiveness. These platforms allow real-time monitoring, remote accessibility, and seamless integration with other customer engagement tools such as CRM and workforce management systems. The rise in remote and hybrid work environments has further accelerated the demand for cloud-based solutions, as they enable distributed teams to be managed and supported effectively from anywhere. Moreover, regular updates, lower upfront infrastructure costs, and AI-powered features are enhancing their appeal among businesses of all sizes, especially small and medium enterprises.
On the basis of component, the global agent performance optimization (APO) market is bifurcated into software, services, and consulting. The software segment holds the dominant position among all components. Organizations heavily rely on APO software to monitor, analyze, and enhance agent productivity through features such as performance dashboards, speech and text analytics, quality monitoring, and real-time reporting. The increasing integration of artificial intelligence, machine learning, and automation tools into APO software solutions has significantly improved their ability to provide actionable insights, streamline workflows, and optimize customer interactions. The demand for comprehensive, scalable, and user-friendly software platforms is growing across industries, making this segment the core driver of the overall market.
Based on application, the global agent performance optimization (APO) market is divided into contact center optimization, sales performance improvement, and customer engagement enhancement. Contact center optimization stands out as the most dominant application segment. Organizations across various sectors rely heavily on contact centers as a primary channel for customer support, making performance efficiency within these centers critical. APO tools are extensively used to monitor call quality, reduce average handling time, ensure compliance, and improve first-call resolution rates. With increasing call volumes, omnichannel interactions, and the shift to remote or hybrid work models, companies are prioritizing solutions that can optimize workforce performance and ensure consistent service delivery, further strengthening the dominance of this application area.
In terms of end user, the global agent performance optimization (APO) market is bifurcated into BFSI, healthcare, retail, and telecommunication. The BFSI (Banking, Financial Services, and Insurance) sector is the leading end user, driven by its high customer interaction volumes, regulatory requirements, and the need for exceptional service quality. Financial institutions heavily depend on APO solutions to monitor agent compliance, ensure data security, and deliver consistent customer experiences across multiple channels such as phone, chat, and email. With increasing competition and digital transformation initiatives, BFSI organizations prioritize performance analytics and quality monitoring to boost customer trust and operational efficiency.
Agent Performance Optimization (APO) Market: Regional Insights
- North America is expected to dominates the global market
North America leads the Agent Performance Optimization (APO) market, primarily driven by the rapid digital transformation of customer service operations and widespread adoption of AI-enabled solutions across contact centers. The region, particularly the United States, has a strong presence of major APO vendors and a mature infrastructure supporting advanced analytics, cloud computing, and automation technologies. Companies in sectors like BFSI, telecom, and healthcare are heavily investing in APO tools to gain deeper insights into agent productivity and improve customer engagement. This early adoption and willingness to spend on tech-driven customer support solutions continue to fuel the region's dominance in the global market.
Europe holds the second-largest share in the APO market, supported by strict regulatory standards regarding customer data protection and rising demand for improved agent accountability. Countries such as the United Kingdom, Germany, and France are embracing APO technologies to ensure high service quality in banking, insurance, and e-commerce. The region is also seeing growth in omnichannel communication trends, driving demand for performance optimization tools that can integrate with multiple platforms and provide unified analytics. European organizations are placing greater emphasis on employee well-being and coaching, further encouraging adoption of integrated APO solutions.
Asia Pacific is witnessing the fastest growth in the APO market due to the rapid expansion of contact centers and increasing demand for scalable, cloud-based solutions. Countries like India, China, and the Philippines, which serve as major outsourcing hubs, are investing in agent training, quality monitoring, and AI-driven analytics to maintain service standards and client satisfaction. The growing use of digital platforms and mobile-based customer service, particularly in the retail and telecommunications sectors, is contributing to the rising demand for APO tools. As businesses in the region prioritize customer retention and operational efficiency, the market is expected to continue its upward momentum.
Latin America is experiencing gradual growth in the APO market, mainly due to increasing investment in customer support infrastructure and rising awareness of workforce optimization benefits. Brazil and Mexico are leading adopters in the region, with enterprises focusing on reducing operational costs while enhancing agent performance. However, the market is still in the early stages of development compared to other regions, as organizations face challenges related to budget constraints, lack of technical expertise, and limited access to advanced solutions. Nevertheless, cloud adoption and the entry of global APO vendors are expected to gradually improve market maturity.
Middle East and Africa represent the smallest share of the global APO market, largely due to the relatively lower penetration of digital customer engagement tools and limited investment in workforce optimization technologies. However, select countries like the UAE, Saudi Arabia, and South Africa are beginning to explore APO solutions as part of broader digital transformation initiatives. Growth is being driven by increasing adoption of cloud platforms, rising customer expectations, and the need to improve agent performance in sectors like banking and telecommunications. While the market remains nascent, government-led technology initiatives and growing interest in AI and analytics tools could support future development.
Agent Performance Optimization (APO) Market: Competitive Landscape
The report provides an in-depth analysis of companies operating in the agent performance optimization (APO) market, including their geographic presence, business strategies, product offerings, market share, and recent developments. This analysis helps to understand market competition.
Some of the major players in the global agent performance optimization (APO) market include:
- ZOOM International
- NICE Ltd
- HigherGround, Inc.
- Genesys
- CallFinder
- Verint Systems Inc
- CallMiner
- Aspect
- Envision Telephony
- Calabrio
- Upstream Works Software
- Five9
- InVision AG
- Teleopti AB. Granulate
The global agent performance optimization (APO) market is segmented as follows:
By Deployment Mode
- Cloud-Based
- On-Premises
By Component
- Software
- Services
- Consulting
By Application
- Contact Center Optimization
- Sales Performance Improvement
- Customer Engagement Enhancement
By End User
- BFSI
- Healthcare
- Retail
- Telecommunication
By Region
- North America
- U.S.
- Canada
- Europe
- U.K.
- France
- Germany
- Rest of Europe
- Asia Pacific
- China
- Japan
- India
- South Korea
- Rest of Asia Pacific
- Latin America
- Brazil
- Rest of Latin America
- The Middle East and Africa
- GCC Countries
- South Africa
- Rest of Middle East Africa
Frequently Asked Questions
Table Of Content
- Chapter 1 Executive Summary
- 1.1. Introduction of Agent Performance Optimization (APO)
- 1.2. Global Agent Performance Optimization (APO) Market, 2020 & 2026 (USD Million)
- 1.3. Global Agent Performance Optimization (APO) Market, 2016 – 2026 (USD Million)
- 1.4. Global Agent Performance Optimization (APO) Market Absulute Revenue Opportunity, 2016 – 2026 (USD Million)
- 1.5. Global Agent Performance Optimization (APO) Market Incremental Revenue Opportunity, 2020 – 2026 (USD Million)
- Chapter 2 Agent Performance Optimization (APO) Market – Type Analysis
- 2.1. Global Agent Performance Optimization (APO) Market – Type Overview
- 2.2. Global Agent Performance Optimization (APO) Market Share, by Type, 2020 & 2026 (USD Million)
- 2.3. On-Premise
- 2.3.1. Global On-Premise Agent Performance Optimization (APO) Market, 2016 – 2026 (USD Million)
- 2.4. Cloud-Based
- 2.4.1. Global Cloud-Based Agent Performance Optimization (APO) Market, 2016 – 2026 (USD Million)
- Chapter 3 Agent Performance Optimization (APO) Market – Application Analysis
- 3.1. Global Agent Performance Optimization (APO) Market – Application Overview
- 3.2. Global Agent Performance Optimization (APO) Market Share, by Application, 2020 & 2026 (USD Million)
- 3.3. Large Enterprises
- 3.3.1. Global Large Enterprises Agent Performance Optimization (APO) Market, 2016 – 2026 (USD Million)
- 3.4. Small & Mid-sized Businesses
- 3.4.1. Global Small & Mid-sized Businesses Agent Performance Optimization (APO) Market, 2016 – 2026 (USD Million)
- Chapter 4 Agent Performance Optimization (APO) Market – Regional Analysis
- 4.1. Global Agent Performance Optimization (APO) Market Regional Overview
- 4.2. Global Agent Performance Optimization (APO) Market Share, by Region, 2020 & 2026 (USD Million)
- 4.3. North America
- 4.3.1. North America Agent Performance Optimization (APO) Market, 2016 – 2026 (USD Million)
- 4.3.1.1. North America Agent Performance Optimization (APO) Market, by Country, 2016 - 2026 (USD Million)
- 4.3.2. North America Agent Performance Optimization (APO) Market, by Type, 2016 – 2026
- 4.3.2.1. North America Agent Performance Optimization (APO) Market, by Type, 2016 – 2026 (USD Million)
- 4.3.3. North America Agent Performance Optimization (APO) Market, by Application, 2016 – 2026
- 4.3.3.1. North America Agent Performance Optimization (APO) Market, by Application, 2016 – 2026 (USD Million)
- 4.3.4. U.S.
- 4.3.4.1. U.S. Agent Performance Optimization (APO) Market, 2016 – 2026 (USD Million)
- 4.3.5. Canada
- 4.3.5.1. Canada Agent Performance Optimization (APO) Market, 2016 – 2026 (USD Million)
- 4.3.1. North America Agent Performance Optimization (APO) Market, 2016 – 2026 (USD Million)
- 4.4. Europe
- 4.4.1. Europe Agent Performance Optimization (APO) Market, 2016 – 2026 (USD Million)
- 4.4.1.1. Europe Agent Performance Optimization (APO) Market, by Country, 2016 - 2026 (USD Million)
- 4.4.2. Europe Agent Performance Optimization (APO) Market, by Type, 2016 – 2026
- 4.4.2.1. Europe Agent Performance Optimization (APO) Market, by Type, 2016 – 2026 (USD Million)
- 4.4.3. Europe Agent Performance Optimization (APO) Market, by Application, 2016 – 2026
- 4.4.3.1. Europe Agent Performance Optimization (APO) Market, by Application, 2016 – 2026 (USD Million)
- 4.4.4. Germany
- 4.4.4.1. Germany Agent Performance Optimization (APO) Market, 2016 – 2026 (USD Million)
- 4.4.5. France
- 4.4.5.1. France Agent Performance Optimization (APO) Market, 2016 – 2026 (USD Million)
- 4.4.6. U.K.
- 4.4.6.1. U.K. Agent Performance Optimization (APO) Market, 2016 – 2026 (USD Million)
- 4.4.7. Italy
- 4.4.7.1. Italy Agent Performance Optimization (APO) Market, 2016 – 2026 (USD Million)
- 4.4.8. Spain
- 4.4.8.1. Spain Agent Performance Optimization (APO) Market, 2016 – 2026 (USD Million)
- 4.4.9. Rest of Europe
- 4.4.9.1. Rest of Europe Agent Performance Optimization (APO) Market, 2016 – 2026 (USD Million)
- 4.4.1. Europe Agent Performance Optimization (APO) Market, 2016 – 2026 (USD Million)
- 4.5. Asia Pacific
- 4.5.1. Asia Pacific Agent Performance Optimization (APO) Market, 2016 – 2026 (USD Million)
- 4.5.1.1. Asia Pacific Agent Performance Optimization (APO) Market, by Country, 2016 - 2026 (USD Million)
- 4.5.2. Asia Pacific Agent Performance Optimization (APO) Market, by Type, 2016 – 2026
- 4.5.2.1. Asia Pacific Agent Performance Optimization (APO) Market, by Type, 2016 – 2026 (USD Million)
- 4.5.3. Asia Pacific Agent Performance Optimization (APO) Market, by Application, 2016 – 2026
- 4.5.3.1. Asia Pacific Agent Performance Optimization (APO) Market, by Application, 2016 – 2026 (USD Million)
- 4.5.4. China
- 4.5.4.1. China Agent Performance Optimization (APO) Market, 2016 – 2026 (USD Million)
- 4.5.5. Japan
- 4.5.5.1. Japan Agent Performance Optimization (APO) Market, 2016 – 2026 (USD Million)
- 4.5.6. India
- 4.5.6.1. India Agent Performance Optimization (APO) Market, 2016 – 2026 (USD Million)
- 4.5.7. South Korea
- 4.5.7.1. South Korea Agent Performance Optimization (APO) Market, 2016 – 2026 (USD Million)
- 4.5.8. South-East Asia
- 4.5.8.1. South-East Asia Agent Performance Optimization (APO) Market, 2016 – 2026 (USD Million)
- 4.5.9. Rest of Asia Pacific
- 4.5.9.1. Rest of Asia Pacific Agent Performance Optimization (APO) Market, 2016 – 2026 (USD Million)
- 4.5.1. Asia Pacific Agent Performance Optimization (APO) Market, 2016 – 2026 (USD Million)
- 4.6. Latin America
- 4.6.1. Latin America Agent Performance Optimization (APO) Market, 2016 – 2026 (USD Million)
- 4.6.1.1. Latin America Agent Performance Optimization (APO) Market, by Country, 2016 - 2026 (USD Million)
- 4.6.2. Latin America Agent Performance Optimization (APO) Market, by Type, 2016 – 2026
- 4.6.2.1. Latin America Agent Performance Optimization (APO) Market, by Type, 2016 – 2026 (USD Million)
- 4.6.3. Latin America Agent Performance Optimization (APO) Market, by Application, 2016 – 2026
- 4.6.3.1. Latin America Agent Performance Optimization (APO) Market, by Application, 2016 – 2026 (USD Million)
- 4.6.4. Brazil
- 4.6.4.1. Brazil Agent Performance Optimization (APO) Market, 2016 – 2026 (USD Million)
- 4.6.5. Mexico
- 4.6.5.1. Mexico Agent Performance Optimization (APO) Market, 2016 – 2026 (USD Million)
- 4.6.6. Rest of Latin America
- 4.6.6.1. Rest of Latin America Agent Performance Optimization (APO) Market, 2016 – 2026 (USD Million)
- 4.6.1. Latin America Agent Performance Optimization (APO) Market, 2016 – 2026 (USD Million)
- 4.7. The Middle-East and Africa
- 4.7.1. The Middle-East and Africa Agent Performance Optimization (APO) Market, 2016 – 2026 (USD Million)
- 4.7.1.1. The Middle-East and Africa Agent Performance Optimization (APO) Market, by Country, 2016 - 2026 (USD Million)
- 4.7.2. The Middle-East and Africa Agent Performance Optimization (APO) Market, by Type, 2016 – 2026
- 4.7.2.1. The Middle-East and Africa Agent Performance Optimization (APO) Market, by Type, 2016 – 2026 (USD Million)
- 4.7.3. The Middle-East and Africa Agent Performance Optimization (APO) Market, by Application, 2016 – 2026
- 4.7.3.1. The Middle-East and Africa Agent Performance Optimization (APO) Market, by Application, 2016 – 2026 (USD Million)
- 4.7.4. GCC Countries
- 4.7.4.1. GCC Countries Agent Performance Optimization (APO) Market, 2016 – 2026 (USD Million)
- 4.7.5. South Africa
- 4.7.5.1. South Africa Agent Performance Optimization (APO) Market, 2016 – 2026 (USD Million)
- 4.7.6. Rest of Middle-East Africa
- 4.7.6.1. Rest of Middle-East Africa Agent Performance Optimization (APO) Market, 2016 – 2026 (USD Million)
- 4.7.1. The Middle-East and Africa Agent Performance Optimization (APO) Market, 2016 – 2026 (USD Million)
- Chapter 5 Agent Performance Optimization (APO) Market – Competitive Landscape
- 5.1. Competitor Market Share – Revenue
- 5.2. Market Concentration Rate Analysis, Top 3 and Top 5 Players
- 5.3. Strategic Developments
- 5.3.1. Acquisitions and Mergers
- 5.3.2. New Products
- 5.3.3. Research & Development Activities
- Chapter 6 Company Profiles
- 6.1. ZOOM International
- 6.1.1. Company Overview
- 6.1.2. Product/Service Portfulio
- 6.1.3. ZOOM International Sales, Revenue, and Gross Margin
- 6.1.4. ZOOM International Revenue and Growth Rate
- 6.1.5. ZOOM International Market Share
- 6.1.6. Recent Initiatives, Funding/VC Activities, and Technulogical Innovations
- 6.2. NICE Ltd
- 6.2.1. Company Overview
- 6.2.2. Product/Service Portfulio
- 6.2.3. NICE Ltd Sales, Revenue, and Gross Margin
- 6.2.4. NICE Ltd Revenue and Growth Rate
- 6.2.5. NICE Ltd Market Share
- 6.2.6. Recent Initiatives, Funding/VC Activities, and Technulogical Innovations
- 6.3. HigherGround, Inc.
- 6.3.1. Company Overview
- 6.3.2. Product/Service Portfulio
- 6.3.3. HigherGround, Inc. Sales, Revenue, and Gross Margin
- 6.3.4. HigherGround, Inc. Revenue and Growth Rate
- 6.3.5. HigherGround, Inc. Market Share
- 6.3.6. Recent Initiatives, Funding/VC Activities, and Technulogical Innovations
- 6.4. Genesys
- 6.4.1. Company Overview
- 6.4.2. Product/Service Portfulio
- 6.4.3. Genesys Sales, Revenue, and Gross Margin
- 6.4.4. Genesys Revenue and Growth Rate
- 6.4.5. Genesys Market Share
- 6.4.6. Recent Initiatives, Funding/VC Activities, and Technulogical Innovations
- 6.5. CallFinder
- 6.5.1. Company Overview
- 6.5.2. Product/Service Portfulio
- 6.5.3. CallFinder Sales, Revenue, and Gross Margin
- 6.5.4. CallFinder Revenue and Growth Rate
- 6.5.5. CallFinder Market Share
- 6.5.6. Recent Initiatives, Funding/VC Activities, and Technulogical Innovations
- 6.6. Verint Systems Inc
- 6.6.1. Company Overview
- 6.6.2. Product/Service Portfulio
- 6.6.3. Verint Systems Inc Sales, Revenue, and Gross Margin
- 6.6.4. Verint Systems Inc Revenue and Growth Rate
- 6.6.5. Verint Systems Inc Market Share
- 6.6.6. Recent Initiatives, Funding/VC Activities, and Technulogical Innovations
- 6.7. CallMiner
- 6.7.1. Company Overview
- 6.7.2. Product/Service Portfulio
- 6.7.3. CallMiner Sales, Revenue, and Gross Margin
- 6.7.4. CallMiner Revenue and Growth Rate
- 6.7.5. CallMiner Market Share
- 6.7.6. Recent Initiatives, Funding/VC Activities, and Technulogical Innovations
- 6.8. Aspect
- 6.8.1. Company Overview
- 6.8.2. Product/Service Portfulio
- 6.8.3. Aspect Sales, Revenue, and Gross Margin
- 6.8.4. Aspect Revenue and Growth Rate
- 6.8.5. Aspect Market Share
- 6.8.6. Recent Initiatives, Funding/VC Activities, and Technulogical Innovations
- 6.9. Envision Telephony
- 6.9.1. Company Overview
- 6.9.2. Product/Service Portfulio
- 6.9.3. Envision Telephony Sales, Revenue, and Gross Margin
- 6.9.4. Envision Telephony Revenue and Growth Rate
- 6.9.5. Envision Telephony Market Share
- 6.9.6. Recent Initiatives, Funding/VC Activities, and Technulogical Innovations
- 6.10. Calabrio
- 6.10.1. Company Overview
- 6.10.2. Product/Service Portfulio
- 6.10.3. Calabrio Sales, Revenue, and Gross Margin
- 6.10.4. Calabrio Revenue and Growth Rate
- 6.10.5. Calabrio Market Share
- 6.10.6. Recent Initiatives, Funding/VC Activities, and Technulogical Innovations
- 6.11. Upstream Works Software
- 6.11.1. Company Overview
- 6.11.2. Product/Service Portfulio
- 6.11.3. Upstream Works Software Sales, Revenue, and Gross Margin
- 6.11.4. Upstream Works Software Revenue and Growth Rate
- 6.11.5. Upstream Works Software Market Share
- 6.11.6. Recent Initiatives, Funding/VC Activities, and Technulogical Innovations
- 6.12. Five9
- 6.12.1. Company Overview
- 6.12.2. Product/Service Portfulio
- 6.12.3. Five9 Sales, Revenue, and Gross Margin
- 6.12.4. Five9 Revenue and Growth Rate
- 6.12.5. Five9 Market Share
- 6.12.6. Recent Initiatives, Funding/VC Activities, and Technulogical Innovations
- 6.13. InVision AG
- 6.13.1. Company Overview
- 6.13.2. Product/Service Portfulio
- 6.13.3. InVision AG Sales, Revenue, and Gross Margin
- 6.13.4. InVision AG Revenue and Growth Rate
- 6.13.5. InVision AG Market Share
- 6.13.6. Recent Initiatives, Funding/VC Activities, and Technulogical Innovations
- 6.14. Teleopti AB
- 6.14.1. Company Overview
- 6.14.2. Product/Service Portfulio
- 6.14.3. Teleopti AB Sales, Revenue, and Gross Margin
- 6.14.4. Teleopti AB Revenue and Growth Rate
- 6.14.5. Teleopti AB Market Share
- 6.14.6. Recent Initiatives, Funding/VC Activities, and Technulogical Innovations
- 6.15. Others
- 6.15.1. Company Overview
- 6.15.2. Product/Service Portfulio
- 6.15.3. Others Sales, Revenue, and Gross Margin
- 6.15.4. Others Revenue and Growth Rate
- 6.15.5. Others Market Share
- 6.15.6. Recent Initiatives, Funding/VC Activities, and Technulogical Innovations
- 6.1. ZOOM International
- Chapter 7 Agent Performance Optimization (APO) — Industry Analysis
- 7.1. Introduction and Taxonomy
- 7.2. Agent Performance Optimization (APO) Market – Key Trends
- 7.2.1. Market Drivers
- 7.2.2. Market Restraints
- 7.2.3. Market Opportunities
- 7.3. Value Chain Analysis
- 7.4. Key Mandates and Regulations
- 7.5. Technulogy Roadmap and Timeline
- 7.6. Agent Performance Optimization (APO) Market – Attractiveness Analysis
- 7.6.1. By Type
- 7.6.2. By Application
- 7.6.3. By Region
- Chapter 8 Industrial Chain, Sourcing Strategy, and Downstream Buyers
- 8.1. Agent Performance Optimization (APO) Industrial Chain Analysis
- 8.2. Downstream Buyers
- 8.3. Distributors/Traders List
- Chapter 9 Marketing Strategy Analysis
- 9.1. Marketing Channel
- 9.2. Direct Marketing
- 9.3. Indirect Marketing
- 9.4. Marketing Channel Development Trends
- 9.5. Economic/Pulitical Environmental Change
- Chapter 10 Report Conclusion & Key Insights
- 10.1. Key Insights from Primary Interviews & Surveys Respondents
- 10.2. Key Takeaways from Analysts, Consultants, and Industry Leaders
- Chapter 11 Research Approach & Methodulogy
- 11.1. Report Description
- 11.2. Research Scope
- 11.3. Research Methodulogy
- 11.3.1. Secondary Research
- 11.3.2. Primary Research
- 11.3.3. Statistical Models
- 11.3.3.1. Company Share Analysis Model
- 11.3.3.2. Revenue Based Modeling
- 11.3.4. Research Limitations
Inquiry For Buying
Agent Performance Optimization (APO)
Request Sample
Agent Performance Optimization (APO)