Animal Feed Micronutrients Market Size, Share, and Trends Analysis Report
CAGR :

| Market Size 2023 (Base Year) | USD 2.31 Billion |
| Market Size 2032 (Forecast Year) | USD 4.46 Billion |
| CAGR | 7.6% |
| Forecast Period | 2024 - 2032 |
| Historical Period | 2018 - 2023 |
Animal Feed Micronutrients Market Insights
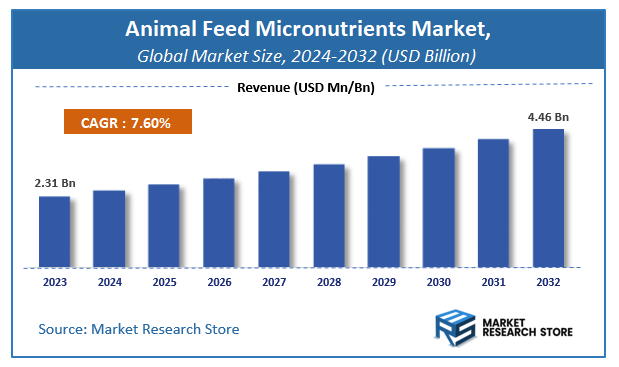
A latest report by Market Research Store estimates that the Global Animal Feed Micronutrients Market was valued at USD 2.31 Billion in 2023 and is expected to reach USD 4.46 Billion by 2032, with a CAGR of 7.6% during the forecast period 2024-2032. The report Animal Feed Micronutrients Market overview, growth factors, restraints, opportunities, segmentation, key developments, competitive landscape, consumer insights, and market growth forecast in terms of value or volume. These structured details offer an all-inclusive market overview, providing valuable insights for investment decisions, business decisions, strategic planning, and competitive analysis.
To Get more Insights, Request a Free Sample
Animal Feed Micronutrients Market: Overview
The growth of the animal feed micronutrients market is fueled by rising global demand across various industries and applications. The report highlights lucrative opportunities, analyzing cost structures, key segments, emerging trends, regional dynamics, and advancements by leading players to provide comprehensive market insights. The animal feed micronutrients market report offers a detailed industry analysis from 2024 to 2032, combining quantitative and qualitative insights. It examines key factors such as pricing, market penetration, GDP impact, industry dynamics, major players, consumer behavior, and socio-economic conditions. Structured into multiple sections, the report provides a comprehensive perspective on the market from all angles.
Key sections of the animal feed micronutrients market report include market segments, outlook, competitive landscape, and company profiles. Market Segments offer in-depth details based on Product, Application, and other relevant classifications to support strategic marketing initiatives. Market Outlook thoroughly analyzes market trends, growth drivers, restraints, opportunities, challenges, Porter’s Five Forces framework, macroeconomic factors, value chain analysis, and pricing trends shaping the market now and in the future. The Competitive Landscape and Company Profiles section highlights major players, their strategies, and market positioning to guide investment and business decisions. The report also identifies innovation trends, new business opportunities, and investment prospects for the forecast period.
Key Highlights:
- As per the analysis shared by our research analyst, the global animal feed micronutrients market is estimated to grow annually at a CAGR of around 7.6% over the forecast period (2024-2032).
- In terms of revenue, the global animal feed micronutrients market size was valued at around USD 2.31 Billion in 2023 and is projected to reach USD 4.46 Billion by 2032.
- The market is projected to grow at a significant rate due to growing livestock industry, increasing focus on animal nutrition, and demand for high-yield agricultural practices.
- Based on the Product, the Iron segment is growing at a high rate and will continue to dominate the global market as per industry projections.
- On the basis of Application, the Ruminant segment is anticipated to command the largest market share.
- Based on region, Asia-Pacific is projected to dominate the global market during the forecast period.
Animal Feed Micronutrients Market: Report Scope
This report thoroughly analyzes the animal feed micronutrients market, exploring its historical trends, current state, and future projections. The market estimates presented result from a robust research methodology, incorporating primary research, secondary sources, and expert opinions. These estimates are influenced by the prevailing market dynamics as well as key economic, social, and political factors. Furthermore, the report considers the impact of regulations, government expenditures, and advancements in research and development on the market. Both positive and negative shifts are evaluated to ensure a comprehensive and accurate market outlook.
| Report Attributes | Report Details |
|---|---|
| Report Name | Animal Feed Micronutrients Market |
| Market Size in 2023 | USD 2.31 Billion |
| Market Forecast in 2032 | USD 4.46 Billion |
| Growth Rate | CAGR of 7.6% |
| Number of Pages | 171 |
| Key Companies Covered | Nutreco, Cargill, Zinpro, Balchem, ADM, Lallemend Health, Kemin, Alltech, Novus, QualiTech |
| Segments Covered | By Product, By Application, and By Region |
| Regions Covered | North America, Europe, Asia Pacific (APAC), Latin America, Middle East, and Africa (MEA) |
| Base Year | 2023 |
| Historical Year | 2018 to 2023 |
| Forecast Year | 2024 to 2032 |
| Customization Scope | Avail customized purchase options to meet your exact research needs. Request For Customization |
Animal Feed Micronutrients Market: Dynamics
Key Growth Drivers:
The animal feed micronutrients market is experiencing robust growth driven by the increasing demand for high-quality animal protein. The rising global population and changing dietary habits are fueling this demand, necessitating efficient livestock production. The growing awareness of animal health and welfare, coupled with the need to enhance feed conversion ratios and improve livestock productivity, is driving the adoption of micronutrient-enriched feed. Furthermore, the rising incidence of micronutrient deficiencies in livestock due to intensive farming practices and the depletion of essential nutrients in soil are compelling farmers to supplement feed with micronutrients. The increasing adoption of precision livestock farming and the use of advanced feed formulations are also contributing to market expansion.
Restraints:
The animal feed micronutrients market faces restraints due to fluctuating raw material prices, which can impact production costs and market stability. Stringent regulatory frameworks related to feed safety and quality, particularly concerning heavy metal contamination and residue limits, pose challenges for manufacturers. The high cost of specialized micronutrient formulations and the need for accurate dosage can limit adoption, particularly among small-scale farmers. Additionally, the lack of awareness and technical expertise among some farmers regarding the benefits and proper usage of micronutrients can hinder market penetration. The complexity of integrating micronutrients into existing feed formulations and ensuring homogenous distribution also presents technical challenges.
Opportunities:
The animal feed micronutrients market presents numerous opportunities for innovation and growth. The development of customized micronutrient formulations tailored to specific animal species, growth stages, and dietary requirements is a significant area of opportunity. The increasing focus on sustainable livestock production and the reduction of environmental impact is driving demand for organic and environmentally friendly micronutrient sources. The integration of nanotechnology and encapsulation technologies can enhance micronutrient bioavailability and stability, improving feed efficiency. The growing adoption of precision livestock farming and data-driven feed management allows for targeted micronutrient supplementation, optimizing animal performance and reducing waste. Furthermore, the expansion of aquaculture and the increasing demand for micronutrient-enriched aquafeed are creating new market segments.
Challenges:
The animal feed micronutrients market faces challenges related to ensuring consistent product quality and safety, particularly in the face of varying raw material sources and manufacturing processes. Meeting stringent regulatory requirements and ensuring traceability throughout the supply chain is crucial for maintaining consumer trust. Balancing cost-effectiveness with high-quality micronutrient formulations is a significant challenge for manufacturers. The need to provide comprehensive technical support and educational resources to farmers is essential for promoting proper usage and maximizing the benefits of micronutrients. Furthermore, adapting to the evolving dietary requirements of livestock and the changing market dynamics requires continuous research and development. The need to produce micronutrients in a environmentally sustainable way is also a growing challenge.
Animal Feed Micronutrients Market: Segmentation Insights
The global animal feed micronutrients market is segmented based on Product, Application, and Region. All the segments of the animal feed micronutrients market have been analyzed based on present & future trends and the market is estimated from 2024 to 2032.
Based on Product, the global animal feed micronutrients market is divided into Iron, Manganese, Zinc, Boron, Copper, and Others.
On the basis of Application, the global animal feed micronutrients market is bifurcated into Ruminant, Poultry, Swine, Aqua, Equine, and Others.
Animal Feed Micronutrients Market: Regional Insights
The Asia-Pacific (APAC) region dominates the global animal feed micronutrients market, holding the largest market share due to rapid industrialization of livestock production, increasing meat consumption, and strong demand for high-quality animal nutrition. According to recent market data (2023-2024), APAC accounted for over 40% of the global market revenue, driven by key countries like China, India, and Vietnam, where expanding poultry, swine, and aquaculture industries fuel micronutrient demand.
Strict regulations on feed safety and a growing focus on livestock health further boost market growth. North America and Europe follow as significant markets, with advanced animal nutrition practices and high meat production standards, while Latin America and Africa are emerging as high-growth regions due to increasing meat exports and feed optimization trends.
Animal Feed Micronutrients Market: Competitive Landscape
The animal feed micronutrients market report offers a thorough analysis of both established and emerging players within the market. It includes a detailed list of key companies, categorized based on the types of products they offer and other relevant factors. The report also highlights the market entry year for each player, providing further context for the research analysis.
The "Global Animal Feed Micronutrients Market" study offers valuable insights, focusing on the global market landscape, with an emphasis on major industry players such as;
- Nutreco
- Cargill
- Zinpro
- Balchem
- ADM
- Lallemend Health
- Kemin
- Alltech
- Novus
- QualiTech
The Global Animal Feed Micronutrients Market is Segmented as Follows:
By Product
- Iron
- Manganese
- Zinc
- Boron
- Copper
- and Others
By Application
- Ruminant
- Poultry
- Swine
- Aqua
- Equine
- and Others
By Region
- North America
- The U.S.
- Canada
- Mexico
- Europe
- France
- The UK
- Spain
- Germany
- Italy
- Rest of Europe
- Asia Pacific
- China
- Japan
- India
- Australia
- South Korea
- Rest of Asia Pacific
- The Middle East & Africa
- Saudi Arabia
- UAE
- Egypt
- Kuwait
- South Africa
- Rest of the Middle East & Africa
- Latin America
- Brazil
- Argentina
- Rest of Latin America
Market Evolution
This section evaluates the market position of the product or service by examining its development pathway and competitive dynamics. It provides a detailed overview of the product's growth stages, including the early (historical) phase, the mid-stage, and anticipated future advancements influenced by innovation and emerging technologies.
Porter’s Analysis
Porter’s Five Forces framework offers a strategic lens for assessing competitor behavior and the positioning of key players in the animal feed micronutrients industry. This section explores the external factors shaping competitive dynamics and influencing market strategies in the years ahead. The analysis focuses on five critical forces:
- Competitive Rivalry
- Threat of New Entrants
- Threat of Substitutes
- Supplier Bargaining Power
- Buyer Bargaining Power
Value Chain & Market Attractiveness Analysis
The value chain analysis helps businesses optimize operations by mapping the product flow from suppliers to end consumers, identifying opportunities to streamline processes and gain a competitive edge. Segment-wise market attractiveness analysis evaluates key dimensions like product categories, demographics, and regions, assessing growth potential, market size, and profitability. This enables businesses to focus resources on high-potential segments for better ROI and long-term value.
PESTEL Analysis
PESTEL analysis is a powerful tool in market research reports that enhances market understanding by systematically examining the external macro-environmental factors influencing a business or industry. The acronym stands for Political, Economic, Social, Technological, Environmental, and Legal factors. By evaluating these dimensions, PESTEL analysis provides a comprehensive overview of the broader context within which a market operates, helping businesses identify potential opportunities and threats.
- Political factors assess government policies, stability, trade regulations, and political risks that could impact market operations.
- Economic factors examine variables like inflation, exchange rates, economic growth, and consumer spending power to determine market viability.
- Social factors explore cultural trends, demographics, and lifestyle changes that shape consumer behavior and preferences.
- Technological factors evaluate innovation, R&D, and technological advancements affecting product development and operational efficiencies.
- Environmental factors focus on sustainability, climate change impacts, and eco-friendly practices shaping market trends.
- Legal factors address compliance requirements, industry regulations, and intellectual property laws impacting market entry and operations.
Import-Export Analysis & Pricing Analysis
An import-export analysis is vital for market research, revealing global trade dynamics, trends, and opportunities. It examines trade volumes, product categories, and regional competitiveness, offering insights into supply chains and market demand. This section also analyzes past and future pricing trends, helping businesses optimize strategies and enabling consumers to assess product value effectively.
Animal Feed Micronutrients Market: Company Profiles
The report identifies key players in the animal feed micronutrients market through competitive landscape and company profiles, evaluating their offerings, financial performance, strategies, and market positioning. It includes a SWOT analysis of the top 3-5 companies, assessing strengths, weaknesses, opportunities, and threats. The competitive landscape highlights rankings, recent activities (mergers, acquisitions, partnerships, product launches), and regional footprints using the Ace matrix. Customization is available to meet client-specific needs.
Regional & Industry Footprint
This section details the geographic reach, sales networks, and market penetration of companies profiled in the animal feed micronutrients report, showcasing their operations and distribution across regions. It analyzes the alignment of companies with specific industry verticals, highlighting the industries they serve and the scope of their products and services within those sectors.
Ace Matrix
This section categorizes companies into four distinct groups—Active, Cutting Edge, Innovator, and Emerging—based on their product and business strategies. The evaluation of product strategy focuses on aspects such as the range and depth of offerings, commitment to innovation, product functionalities, and scalability. Key elements like global reach, sector coverage, strategic acquisitions, and long-term growth plans are considered for business strategy. This analysis provides a detailed view of companies' position within the market and highlights their potential for future growth and development.
Research Methodology
The qualitative and quantitative insights for the animal feed micronutrients market are derived through a multi-faceted research approach, combining input from subject matter experts, primary research, and secondary data sources. Primary research includes gathering critical information via face-to-face or telephonic interviews, surveys, questionnaires, and feedback from industry professionals, key opinion leaders (KOLs), and customers. Regular interviews with industry experts are conducted to deepen the analysis and reinforce the existing data, ensuring a robust and well-rounded market understanding.
Secondary research for this report was carried out by the Market Research Store team, drawing on a variety of authoritative sources, such as:
- Official company websites, annual reports, financial statements, investor presentations, and SEC filings
- Internal and external proprietary databases, as well as relevant patent and regulatory databases
- Government publications, national statistical databases, and industry-specific market reports
- Media coverage, including news articles, press releases, and webcasts about market participants
- Paid industry databases for detailed market insights
Market Research Store conducted in-depth consultations with various key opinion leaders in the industry, including senior executives from top companies and regional leaders from end-user organizations. This effort aimed to gather critical insights on factors such as the market share of dominant brands in specific countries and regions, along with pricing strategies for products and services.
To determine total sales data, the research team conducted primary interviews across multiple countries with influential stakeholders, including:
- Distributors
- Marketing, Brand, and Product Managers
- Procurement and Production Managers
- Sales and Regional Sales Managers, Country Managers
- Technical Specialists
- C-Level Executives
These subject matter experts, with their extensive industry experience, helped validate and refine the findings. For secondary research, data was sourced from a wide range of materials, including online resources, company annual reports, industry publications, research papers, association reports, and government websites. These various sources provide a comprehensive and well-rounded perspective on the market.
Frequently Asked Questions
Table Of Content
List of Tables and Figures Figure Product Picture of Animal Feed Micronutrients Table Product Specification of Animal Feed Micronutrients Figure Market Concentration Ratio and Market Maturity Analysis of Animal Feed Micronutrients Figure Global Animal Feed Micronutrients Value ($) and Growth Rate from 2014-2024 Table Different Types of Animal Feed Micronutrients Figure Global Animal Feed Micronutrients Value ($) Segment by Type from 2014-2019 Figure Iron Picture Figure Manganese Picture Figure Zinc Picture Figure Boron Picture Figure Copper Picture Figure Others Picture Table Different Applications of Animal Feed Micronutrients Figure Global Animal Feed Micronutrients Value ($) Segment by Applications from 2014-2019 Figure Ruminant Picture Figure Poultry Picture Figure Swine Picture Figure Aqua Picture Figure Others Picture Table Research Regions of Animal Feed Micronutrients Figure North America Animal Feed Micronutrients Production Value ($) and Growth Rate (2014-2019) Figure Europe Animal Feed Micronutrients Production Value ($) and Growth Rate (2014-2019) Table China Animal Feed Micronutrients Production Value ($) and Growth Rate (2014-2019) Table Japan Animal Feed Micronutrients Production Value ($) and Growth Rate (2014-2019) Table Middle East & Africa Animal Feed Micronutrients Production Value ($) and Growth Rate (2014-2019) Table India Animal Feed Micronutrients Production Value ($) and Growth Rate (2014-2019) Table South America Animal Feed Micronutrients Production Value ($) and Growth Rate (2014-2019) Table Emerging Countries of Animal Feed Micronutrients Table Growing Market of Animal Feed Micronutrients Figure Industry Chain Analysis of Animal Feed Micronutrients Table Upstream Raw Material Suppliers of Animal Feed Micronutrients with Contact Information Table Major Players Manufacturing Base and Market Share ($) of Animal Feed Micronutrients in 2018 Table Major Players Animal Feed Micronutrients Product Types in 2018 Figure Production Process of Animal Feed Micronutrients Figure Manufacturing Cost Structure of Animal Feed Micronutrients Figure Channel Status of Animal Feed Micronutrients Table Major Distributors of Animal Feed Micronutrients with Contact Information Table Major Downstream Buyers of Animal Feed Micronutrients with Contact Information Table Global Animal Feed Micronutrients Value ($) by Type (2014-2019) Table Global Animal Feed Micronutrients Value ($) Share by Type (2014-2019) Figure Global Animal Feed Micronutrients Value ($) Share by Type (2014-2019) Table Global Animal Feed Micronutrients Production by Type (2014-2019) Table Global Animal Feed Micronutrients Production Share by Type (2014-2019) Figure Global Animal Feed Micronutrients Production Share by Type (2014-2019) Figure Global Animal Feed Micronutrients Value ($) and Growth Rate of Iron Figure Global Animal Feed Micronutrients Value ($) and Growth Rate of Manganese Figure Global Animal Feed Micronutrients Value ($) and Growth Rate of Zinc Figure Global Animal Feed Micronutrients Value ($) and Growth Rate of Boron Figure Global Animal Feed Micronutrients Value ($) and Growth Rate of Copper Figure Global Animal Feed Micronutrients Value ($) and Growth Rate of Others Figure Global Animal Feed Micronutrients Price by Type (2014-2019) Table Global Animal Feed Micronutrients Consumption by Application (2014-2019) Table Global Animal Feed Micronutrients Consumption Market Share by Application (2014-2019) Figure Global Animal Feed Micronutrients Consumption Market Share by Application (2014-2019) Table Downstream Buyers Introduction by Application Figure Global Animal Feed Micronutrients Consumption and Growth Rate of Ruminant (2014-2019) Figure Global Animal Feed Micronutrients Consumption and Growth Rate of Poultry (2014-2019) Figure Global Animal Feed Micronutrients Consumption and Growth Rate of Swine (2014-2019) Figure Global Animal Feed Micronutrients Consumption and Growth Rate of Aqua (2014-2019) Figure Global Animal Feed Micronutrients Consumption and Growth Rate of Others (2014-2019) Table Global Animal Feed Micronutrients Value ($) by Region (2014-2019) Table Global Animal Feed Micronutrients Value ($) Market Share by Region (2014-2019) Figure Global Animal Feed Micronutrients Value ($) Market Share by Region (2014-2019) Table Global Animal Feed Micronutrients Production by Region (2014-2019) Table Global Animal Feed Micronutrients Production Market Share by Region (2014-2019) Figure Global Animal Feed Micronutrients Production Market Share by Region (2014-2019) Table Global Animal Feed Micronutrients Production, Value ($), Price and Gross Margin (2014-2019) Table North America Animal Feed Micronutrients Production, Value ($), Price and Gross Margin (2014-2019) Table Europe Animal Feed Micronutrients Production, Value ($), Price and Gross Margin (2014-2019) Table China Animal Feed Micronutrients Production, Value ($), Price and Gross Margin (2014-2019) Table Japan Animal Feed Micronutrients Production, Value ($), Price and Gross Margin (2014-2019) Table Middle East & Africa Animal Feed Micronutrients Production, Value ($), Price and Gross Margin (2014-2019) Table India Animal Feed Micronutrients Production, Value ($), Price and Gross Margin (2014-2019) Table South America Animal Feed Micronutrients Production, Value ($), Price and Gross Margin (2014-2019) Table Global Animal Feed Micronutrients Consumption by Regions (2014-2019) Figure Global Animal Feed Micronutrients Consumption Share by Regions (2014-2019) Table North America Animal Feed Micronutrients Production, Consumption, Export, Import (2014-2019) Table Europe Animal Feed Micronutrients Production, Consumption, Export, Import (2014-2019) Table China Animal Feed Micronutrients Production, Consumption, Export, Import (2014-2019) Table Japan Animal Feed Micronutrients Production, Consumption, Export, Import (2014-2019) Table Middle East & Africa Animal Feed Micronutrients Production, Consumption, Export, Import (2014-2019) Table India Animal Feed Micronutrients Production, Consumption, Export, Import (2014-2019) Table South America Animal Feed Micronutrients Production, Consumption, Export, Import (2014-2019) Figure North America Animal Feed Micronutrients Production and Growth Rate Analysis Figure North America Animal Feed Micronutrients Consumption and Growth Rate Analysis Figure North America Animal Feed Micronutrients SWOT Analysis Figure Europe Animal Feed Micronutrients Production and Growth Rate Analysis Figure Europe Animal Feed Micronutrients Consumption and Growth Rate Analysis Figure Europe Animal Feed Micronutrients SWOT Analysis Figure China Animal Feed Micronutrients Production and Growth Rate Analysis Figure China Animal Feed Micronutrients Consumption and Growth Rate Analysis Figure China Animal Feed Micronutrients SWOT Analysis Figure Japan Animal Feed Micronutrients Production and Growth Rate Analysis Figure Japan Animal Feed Micronutrients Consumption and Growth Rate Analysis Figure Japan Animal Feed Micronutrients SWOT Analysis Figure Middle East & Africa Animal Feed Micronutrients Production and Growth Rate Analysis Figure Middle East & Africa Animal Feed Micronutrients Consumption and Growth Rate Analysis Figure Middle East & Africa Animal Feed Micronutrients SWOT Analysis Figure India Animal Feed Micronutrients Production and Growth Rate Analysis Figure India Animal Feed Micronutrients Consumption and Growth Rate Analysis Figure India Animal Feed Micronutrients SWOT Analysis Figure South America Animal Feed Micronutrients Production and Growth Rate Analysis Figure South America Animal Feed Micronutrients Consumption and Growth Rate Analysis Figure South America Animal Feed Micronutrients SWOT Analysis Figure Top 3 Market Share of Animal Feed Micronutrients Companies Figure Top 6 Market Share of Animal Feed Micronutrients Companies Table Mergers, Acquisitions and Expansion Analysis Table Company Profiles Table Product Introduction Table Nutreco Production, Value ($), Price, Gross Margin 2014-2019 Figure Nutreco Production and Growth Rate Figure Nutreco Value ($) Market Share 2014-2019 Figure Nutreco Market Share of Animal Feed Micronutrients Segmented by Region in 2018 Table Company Profiles Table Product Introduction Table Cargill Production, Value ($), Price, Gross Margin 2014-2019 Figure Cargill Production and Growth Rate Figure Cargill Value ($) Market Share 2014-2019 Figure Cargill Market Share of Animal Feed Micronutrients Segmented by Region in 2018 Table Company Profiles Table Product Introduction Table Zinpro Production, Value ($), Price, Gross Margin 2014-2019 Figure Zinpro Production and Growth Rate Figure Zinpro Value ($) Market Share 2014-2019 Figure Zinpro Market Share of Animal Feed Micronutrients Segmented by Region in 2018 Table Company Profiles Table Product Introduction Table Balchem Production, Value ($), Price, Gross Margin 2014-2019 Figure Balchem Production and Growth Rate Figure Balchem Value ($) Market Share 2014-2019 Figure Balchem Market Share of Animal Feed Micronutrients Segmented by Region in 2018 Table Company Profiles Table Product Introduction Table ADM Production, Value ($), Price, Gross Margin 2014-2019 Figure ADM Production and Growth Rate Figure ADM Value ($) Market Share 2014-2019 Figure ADM Market Share of Animal Feed Micronutrients Segmented by Region in 2018 Table Company Profiles Table Product Introduction Table Lallemend Health Production, Value ($), Price, Gross Margin 2014-2019 Figure Lallemend Health Production and Growth Rate Figure Lallemend Health Value ($) Market Share 2014-2019 Figure Lallemend Health Market Share of Animal Feed Micronutrients Segmented by Region in 2018 Table Company Profiles Table Product Introduction Table Kemin Production, Value ($), Price, Gross Margin 2014-2019 Figure Kemin Production and Growth Rate Figure Kemin Value ($) Market Share 2014-2019 Figure Kemin Market Share of Animal Feed Micronutrients Segmented by Region in 2018 Table Company Profiles Table Product Introduction Table Alltech Production, Value ($), Price, Gross Margin 2014-2019 Figure Alltech Production and Growth Rate Figure Alltech Value ($) Market Share 2014-2019 Figure Alltech Market Share of Animal Feed Micronutrients Segmented by Region in 2018 Table Company Profiles Table Product Introduction Table Novus Production, Value ($), Price, Gross Margin 2014-2019 Figure Novus Production and Growth Rate Figure Novus Value ($) Market Share 2014-2019 Figure Novus Market Share of Animal Feed Micronutrients Segmented by Region in 2018 Table Company Profiles Table Product Introduction Table QualiTech Production, Value ($), Price, Gross Margin 2014-2019 Figure QualiTech Production and Growth Rate Figure QualiTech Value ($) Market Share 2014-2019 Figure QualiTech Market Share of Animal Feed Micronutrients Segmented by Region in 2018 Table Global Animal Feed Micronutrients Market Value ($) Forecast, by Type Table Global Animal Feed Micronutrients Market Volume Forecast, by Type Figure Global Animal Feed Micronutrients Market Value ($) and Growth Rate Forecast of Iron (2019-2024) Figure Global Animal Feed Micronutrients Market Volume and Growth Rate Forecast of Iron (2019-2024) Figure Global Animal Feed Micronutrients Market Value ($) and Growth Rate Forecast of Manganese (2019-2024) Figure Global Animal Feed Micronutrients Market Volume and Growth Rate Forecast of Manganese (2019-2024) Figure Global Animal Feed Micronutrients Market Value ($) and Growth Rate Forecast of Zinc (2019-2024) Figure Global Animal Feed Micronutrients Market Volume and Growth Rate Forecast of Zinc (2019-2024) Figure Global Animal Feed Micronutrients Market Value ($) and Growth Rate Forecast of Boron (2019-2024) Figure Global Animal Feed Micronutrients Market Volume and Growth Rate Forecast of Boron (2019-2024) Figure Global Animal Feed Micronutrients Market Value ($) and Growth Rate Forecast of Copper (2019-2024) Figure Global Animal Feed Micronutrients Market Volume and Growth Rate Forecast of Copper (2019-2024) Figure Global Animal Feed Micronutrients Market Value ($) and Growth Rate Forecast of Others (2019-2024) Figure Global Animal Feed Micronutrients Market Volume and Growth Rate Forecast of Others (2019-2024) Table Global Market Value ($) Forecast by Application (2019-2024) Table Global Market Volume Forecast by Application (2019-2024) Figure Global Animal Feed Micronutrients Consumption and Growth Rate of Ruminant (2014-2019) Figure Global Animal Feed Micronutrients Consumption and Growth Rate of Poultry (2014-2019) Figure Global Animal Feed Micronutrients Consumption and Growth Rate of Swine (2014-2019) Figure Global Animal Feed Micronutrients Consumption and Growth Rate of Aqua (2014-2019) Figure Global Animal Feed Micronutrients Consumption and Growth Rate of Others (2014-2019) Figure Market Value ($) and Growth Rate Forecast of Others (2019-2024) Figure Market Volume and Growth Rate Forecast of Others (2019-2024) Figure North America Market Value ($) and Growth Rate Forecast (2019-2024) Table North America Consumption and Growth Rate Forecast (2019-2024) Figure Europe Market Value ($) and Growth Rate Forecast (2019-2024) Table Europe Consumption and Growth Rate Forecast (2019-2024) Figure China Market Value ($) and Growth Rate Forecast (2019-2024) Table China Consumption and Growth Rate Forecast (2019-2024) Figure Japan Market Value ($) and Growth Rate Forecast (2019-2024) Table Japan Consumption and Growth Rate Forecast (2019-2024) Figure Middle East & Africa Market Value ($) and Growth Rate Forecast (2019-2024) Table Middle East & Africa Consumption and Growth Rate Forecast (2019-2024) Figure India Market Value ($) and Growth Rate Forecast (2019-2024) Table India Consumption and Growth Rate Forecast (2019-2024) Figure South America Market Value ($) and Growth Rate Forecast (2019-2024) Table South America Consumption and Growth Rate Forecast (2019-2024) Figure Industry Resource/Technology/Labor Importance Analysis Table New Entrants SWOT Analysis Table New Project Analysis of Investment Recovery
Inquiry For Buying
Animal Feed Micronutrients
Request Sample
Animal Feed Micronutrients