Automatic Transmission Fluid (Atf) Market Size, Share, and Trends Analysis Report
CAGR :

| Market Size 2023 (Base Year) | USD 8.93 Billion |
| Market Size 2032 (Forecast Year) | USD 13.98 Billion |
| CAGR | 5.1% |
| Forecast Period | 2024 - 2032 |
| Historical Period | 2018 - 2023 |
Automatic Transmission Fluid (Atf) Market Insights
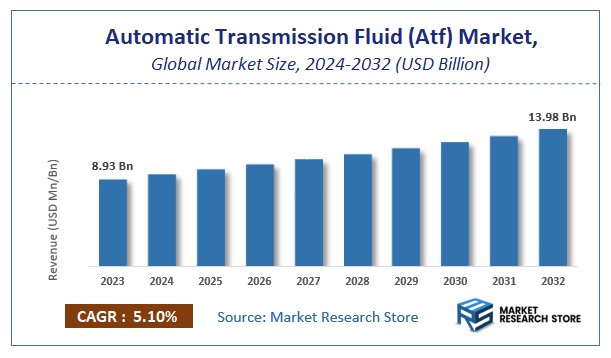
A latest report by Market Research Store estimates that the Global Automatic Transmission Fluid (Atf) Market was valued at USD 8.93 Billion in 2023 and is expected to reach USD 13.98 Billion by 2032, with a CAGR of 5.1% during the forecast period 2024-2032. The report Automatic Transmission Fluid (Atf) Market overview, growth factors, restraints, opportunities, segmentation, key developments, competitive landscape, consumer insights, and market growth forecast in terms of value or volume. These structured details offer an all-inclusive market overview, providing valuable insights for investment decisions, business decisions, strategic planning, and competitive analysis.
To Get more Insights, Request a Free Sample
Automatic Transmission Fluid (Atf) Market: Overview
The growth of the automatic transmission fluid (ATF) market is fueled by rising global demand across various industries and applications. The report highlights lucrative opportunities, analyzing cost structures, key segments, emerging trends, regional dynamics, and advancements by leading players to provide comprehensive market insights. The automatic transmission fluid (ATF) market report offers a detailed industry analysis from 2024 to 2032, combining quantitative and qualitative insights. It examines key factors such as pricing, market penetration, GDP impact, industry dynamics, major players, consumer behavior, and socio-economic conditions. Structured into multiple sections, the report provides a comprehensive perspective on the market from all angles.
Key sections of the automatic transmission fluid (ATF) market report include market segments, outlook, competitive landscape, and company profiles. Market Segments offer in-depth details based on Type, Application, Distribution Channel, Viscosity Grade, and other relevant classifications to support strategic marketing initiatives. Market Outlook thoroughly analyzes market trends, growth drivers, restraints, opportunities, challenges, Porter’s Five Forces framework, macroeconomic factors, value chain analysis, and pricing trends shaping the market now and in the future. The Competitive Landscape and Company Profiles section highlights major players, their strategies, and market positioning to guide investment and business decisions. The report also identifies innovation trends, new business opportunities, and investment prospects for the forecast period.
Key Highlights:
- As per the analysis shared by our research analyst, the global automatic transmission fluid (ATF) market is estimated to grow annually at a CAGR of around 5.1% over the forecast period (2024-2032).
- In terms of revenue, the global automatic transmission fluid (ATF) market size was valued at around USD 8.93 Billion in 2023 and is projected to reach USD 13.98 Billion by 2032.
- The market is projected to grow at a significant rate due to rising production of automatic and hybrid vehicles, increasing demand for high-performance lubricants, and advancements in transmission technology.
- Based on the Type, the Synthetic segment is growing at a high rate and will continue to dominate the global market as per industry projections.
- On the basis of Application, the Passenger Vehicles segment is anticipated to command the largest market share.
- In terms of Distribution Channel, the OEM segment is projected to lead the global market.
- By Viscosity Grade, the Low Viscosity segment is predicted to dominate the global market.
- Based on region, Asia-Pacific is projected to dominate the global market during the forecast period.
Automatic Transmission Fluid (Atf) Market: Report Scope
This report thoroughly analyzes the automatic transmission fluid (ATF) market, exploring its historical trends, current state, and future projections. The market estimates presented result from a robust research methodology, incorporating primary research, secondary sources, and expert opinions. These estimates are influenced by the prevailing market dynamics as well as key economic, social, and political factors. Furthermore, the report considers the impact of regulations, government expenditures, and advancements in research and development on the market. Both positive and negative shifts are evaluated to ensure a comprehensive and accurate market outlook.
| Report Attributes | Report Details |
|---|---|
| Report Name | Automatic Transmission Fluid (Atf) Market |
| Market Size in 2023 | USD 8.93 Billion |
| Market Forecast in 2032 | USD 13.98 Billion |
| Growth Rate | CAGR of 5.1% |
| Number of Pages | 186 |
| Key Companies Covered | Valvoline, AISIN, Pentosin, Prestone, Petro-Canada, Royal Purple, ExxonMobil, Sinopec Lubricant, American Hitech Petroleum & Chemicals (AMTECOL), Red Line, Afton Chemical, Ford, Sinclair, Castrol, AMSOIL, B&M, Amalie, Super Tech, Shell, Gulf, Honda |
| Segments Covered | By Type, By Application, By Distribution Channel, By Viscosity Grade, and By Region |
| Regions Covered | North America, Europe, Asia Pacific (APAC), Latin America, Middle East, and Africa (MEA) |
| Base Year | 2023 |
| Historical Year | 2018 to 2023 |
| Forecast Year | 2024 to 2032 |
| Customization Scope | Avail customized purchase options to meet your exact research needs. Request For Customization |
Automatic Transmission Fluid (Atf) Market: Dynamics
Key Growth Drivers
The Automatic Transmission Fluid (ATF) market in Vasai-Virar, Maharashtra, and India is experiencing steady growth primarily driven by the increasing penetration of automatic transmission vehicles in passenger cars, SUVs, and even some commercial vehicles due to growing urbanization, traffic congestion, and consumer preference for driving convenience. The rising disposable incomes in the region are enabling more consumers to opt for automatic variants, thereby increasing the demand for ATF for initial fill and regular maintenance. Furthermore, the growing awareness about the importance of using the correct and high-quality ATF for optimal transmission performance, longevity, and fuel efficiency is also a significant driver. The expanding automotive aftermarket in Vasai-Virar, with more vehicles requiring periodic fluid changes, further contributes to the demand for ATF.
Restraints
Despite the positive growth outlook, the Automatic Transmission Fluid (ATF) market in Vasai-Virar faces certain restraints. The higher price of automatic transmission vehicles compared to manual counterparts can still limit their widespread adoption, particularly in the price-sensitive segments of the market. The longer drain intervals recommended for modern ATFs can moderate the frequency of replacement compared to other automotive fluids. Furthermore, a lack of awareness or the use of incorrect or lower-quality fluids by some vehicle owners or local mechanics, potentially due to cost considerations, can negatively impact the demand for premium and specialized ATFs. The increasing adoption of electric vehicles (EVs), which do not require ATF, poses a long-term threat to the traditional ATF market, although their current market share in Vasai-Virar is still relatively small.
Opportunities
The Automatic Transmission Fluid (ATF) market in Vasai-Virar presents several opportunities for growth and differentiation. The increasing complexity of modern automatic transmissions, including dual-clutch transmissions (DCTs) and continuously variable transmissions (CVTs), necessitates specialized ATFs with specific performance characteristics, creating a demand for a wider range of premium products. The growing focus on vehicle maintenance and longevity can drive the adoption of higher-quality, synthetic ATFs that offer better protection and extended drain intervals. Furthermore, educating consumers and mechanics about the importance of using the correct ATF through workshops and awareness campaigns can boost the demand for recommended fluids. The potential for local blending and manufacturing of ATFs can reduce costs and improve supply chain efficiency for regional players.
Challenges
The Automatic Transmission Fluid (ATF) market in Vasai-Virar faces challenges related to educating consumers and independent mechanics about the specific ATF requirements for different types of automatic transmissions to avoid misapplication and potential damage. Combating the sale of counterfeit or substandard ATFs that could harm vehicle transmissions is crucial for maintaining product quality and consumer trust. Furthermore, keeping pace with the rapid advancements in transmission technology and developing new ATF formulations that meet the evolving performance demands is essential. Managing the increasing variety of ATF specifications required by different vehicle manufacturers can complicate inventory management and distribution. Finally, preparing for the long-term shift towards electric vehicles and exploring diversification opportunities within the automotive fluids and lubricants sector will be a significant challenge for ATF manufacturers and suppliers in the future.
Automatic Transmission Fluid (Atf) Market: Segmentation Insights
The global automatic transmission fluid (ATF) market is segmented based on Type, Application, Distribution Channel, Viscosity Grade, and Region. All the segments of the automatic transmission fluid (ATF) market have been analyzed based on present & future trends and the market is estimated from 2024 to 2032.
Based on Type, the global automatic transmission fluid (ATF) market is divided into Synthetic, Conventional.
On the basis of Application, the global automatic transmission fluid (ATF) market is bifurcated into Passenger Vehicles, Commercial Vehicles.
In terms of Distribution Channel, the global automatic transmission fluid (ATF) market is categorized into OEM, Aftermarket.
Based on Viscosity Grade, the global automatic transmission fluid (ATF) market is split into Low Viscosity, High Viscosity.
Automatic Transmission Fluid (Atf) Market: Regional Insights
The Asia-Pacific (APAC) region dominates the global Automatic Transmission Fluid (ATF) market, holding the largest revenue share of 56% in 2024 and projected to maintain its lead through 2034, growing at a CAGR of 3.93%. This dominance is driven by rapid industrialization, urbanization, and booming automotive production in key economies like China, India, and Japan, which collectively account for the majority of global vehicle manufacturing. China, the world's largest vehicle producer, alone contributes significantly to ATF demand, supported by government initiatives like "Made in China 2025" and India’s "Automotive Mission Plan 2026", which prioritize advanced transmission technologies.
The region’s growth is further fueled by the rising adoption of automatic transmissions in passenger vehicles, particularly in urban areas with heavy traffic, and the expansion of off-road vehicle fleets in construction, mining, and agriculture sectors. Additionally, APAC’s aftermarket segment is robust due to the region’s large vehicle parc and increasing awareness of transmission maintenance 4. While North America and Europe are significant markets—driven by synthetic ATF adoption and stringent emission norms—APAC’s combination of high production volumes, cost-effective manufacturing, and infrastructural investments solidifies its leadership.
Key players like ExxonMobil, Shell, and BP are intensifying R&D and distribution networks in APAC to cater to this demand, with innovations such as low-viscosity and EV-compatible ATFs gaining traction. The region’s dominance is expected to persist, supported by sustained automotive growth and the shift toward electric and hybrid vehicles, which require specialized ATF formulations
Automatic Transmission Fluid (Atf) Market: Competitive Landscape
The automatic transmission fluid (ATF) market report offers a thorough analysis of both established and emerging players within the market. It includes a detailed list of key companies, categorized based on the types of products they offer and other relevant factors. The report also highlights the market entry year for each player, providing further context for the research analysis.
The "Global Automatic Transmission Fluid (Atf) Market" study offers valuable insights, focusing on the global market landscape, with an emphasis on major industry players such as;
- Valvoline
- AISIN
- Pentosin
- Prestone
- Petro-Canada
- Royal Purple
- ExxonMobil
- Sinopec Lubricant
- American Hitech Petroleum & Chemicals (AMTECOL)
- Red Line
- Afton Chemical
- Ford
- Sinclair
- Castrol
- AMSOIL
- B&M
- Amalie
- Super Tech
- Shell
- Gulf
- Honda
The Global Automatic Transmission Fluid (Atf) Market is Segmented as Follows:
By Type
- Synthetic
- Conventional
By Application
- Passenger Vehicles
- Commercial Vehicles
By Distribution Channel
- OEM
- Aftermarket
By Viscosity Grade
- Low Viscosity
- High Viscosity
By Region
- North America
- The U.S.
- Canada
- Mexico
- Europe
- France
- The UK
- Spain
- Germany
- Italy
- Rest of Europe
- Asia Pacific
- China
- Japan
- India
- Australia
- South Korea
- Rest of Asia Pacific
- The Middle East & Africa
- Saudi Arabia
- UAE
- Egypt
- Kuwait
- South Africa
- Rest of the Middle East & Africa
- Latin America
- Brazil
- Argentina
- Rest of Latin America
Market Evolution
This section evaluates the market position of the product or service by examining its development pathway and competitive dynamics. It provides a detailed overview of the product's growth stages, including the early (historical) phase, the mid-stage, and anticipated future advancements influenced by innovation and emerging technologies.
Porter’s Analysis
Porter’s Five Forces framework offers a strategic lens for assessing competitor behavior and the positioning of key players in the automatic transmission fluid (ATF) industry. This section explores the external factors shaping competitive dynamics and influencing market strategies in the years ahead. The analysis focuses on five critical forces:
- Competitive Rivalry
- Threat of New Entrants
- Threat of Substitutes
- Supplier Bargaining Power
- Buyer Bargaining Power
Value Chain & Market Attractiveness Analysis
The value chain analysis helps businesses optimize operations by mapping the product flow from suppliers to end consumers, identifying opportunities to streamline processes and gain a competitive edge. Segment-wise market attractiveness analysis evaluates key dimensions like product categories, demographics, and regions, assessing growth potential, market size, and profitability. This enables businesses to focus resources on high-potential segments for better ROI and long-term value.
PESTEL Analysis
PESTEL analysis is a powerful tool in market research reports that enhances market understanding by systematically examining the external macro-environmental factors influencing a business or industry. The acronym stands for Political, Economic, Social, Technological, Environmental, and Legal factors. By evaluating these dimensions, PESTEL analysis provides a comprehensive overview of the broader context within which a market operates, helping businesses identify potential opportunities and threats.
- Political factors assess government policies, stability, trade regulations, and political risks that could impact market operations.
- Economic factors examine variables like inflation, exchange rates, economic growth, and consumer spending power to determine market viability.
- Social factors explore cultural trends, demographics, and lifestyle changes that shape consumer behavior and preferences.
- Technological factors evaluate innovation, R&D, and technological advancements affecting product development and operational efficiencies.
- Environmental factors focus on sustainability, climate change impacts, and eco-friendly practices shaping market trends.
- Legal factors address compliance requirements, industry regulations, and intellectual property laws impacting market entry and operations.
Import-Export Analysis & Pricing Analysis
An import-export analysis is vital for market research, revealing global trade dynamics, trends, and opportunities. It examines trade volumes, product categories, and regional competitiveness, offering insights into supply chains and market demand. This section also analyzes past and future pricing trends, helping businesses optimize strategies and enabling consumers to assess product value effectively.
Automatic Transmission Fluid (Atf) Market: Company Profiles
The report identifies key players in the automatic transmission fluid (ATF) market through a competitive landscape and company profiles, evaluating their offerings, financial performance, strategies, and market positioning. It includes a SWOT analysis of the top 3-5 companies, assessing strengths, weaknesses, opportunities, and threats. The competitive landscape highlights rankings, recent activities (mergers, acquisitions, partnerships, product launches), and regional footprints using the Ace matrix. Customization is available to meet client-specific needs.
Regional & Industry Footprint
This section details the geographic reach, sales networks, and market penetration of companies profiled in the automatic transmission fluid (ATF) report, showcasing their operations and distribution across regions. It analyzes the alignment of companies with specific industry verticals, highlighting the industries they serve and the scope of their products and services within those sectors.
Ace Matrix
This section categorizes companies into four distinct groups—Active, Cutting Edge, Innovator, and Emerging—based on their product and business strategies. The evaluation of product strategy focuses on aspects such as the range and depth of offerings, commitment to innovation, product functionalities, and scalability. Key elements like global reach, sector coverage, strategic acquisitions, and long-term growth plans are considered for business strategy. This analysis provides a detailed view of companies' position within the market and highlights their potential for future growth and development.
Research Methodology
The qualitative and quantitative insights for the automatic transmission fluid (ATF) market are derived through a multi-faceted research approach, combining input from subject matter experts, primary research, and secondary data sources. Primary research includes gathering critical information via face-to-face or telephonic interviews, surveys, questionnaires, and feedback from industry professionals, key opinion leaders (KOLs), and customers. Regular interviews with industry experts are conducted to deepen the analysis and reinforce the existing data, ensuring a robust and well-rounded market understanding.
Secondary research for this report was carried out by the Market Research Store team, drawing on a variety of authoritative sources, such as:
- Official company websites, annual reports, financial statements, investor presentations, and SEC filings
- Internal and external proprietary databases, as well as relevant patent and regulatory databases
- Government publications, national statistical databases, and industry-specific market reports
- Media coverage, including news articles, press releases, and webcasts about market participants
- Paid industry databases for detailed market insights
Market Research Store conducted in-depth consultations with various key opinion leaders in the industry, including senior executives from top companies and regional leaders from end-user organizations. This effort aimed to gather critical insights on factors such as the market share of dominant brands in specific countries and regions, along with pricing strategies for products and services.
To determine total sales data, the research team conducted primary interviews across multiple countries with influential stakeholders, including:
- Distributors
- Marketing, Brand, and Product Managers
- Procurement and Production Managers
- Sales and Regional Sales Managers, Country Managers
- Technical Specialists
- C-Level Executives
These subject matter experts, with their extensive industry experience, helped validate and refine the findings. For secondary research, data were sourced from a wide range of materials, including online resources, company annual reports, industry publications, research papers, association reports, and government websites. These various sources provide a comprehensive and well-rounded perspective on the market.
Frequently Asked Questions
Table Of Content
List of Tables and Figures Figure Product Picture of Automatic Transmission Fluid (Atf) Table Product Specification of Automatic Transmission Fluid (Atf) Figure Market Concentration Ratio and Market Maturity Analysis of Automatic Transmission Fluid (Atf) Figure Global Automatic Transmission Fluid (Atf) Value ($) and Growth Rate from 2014-2024 Table Different Types of Automatic Transmission Fluid (Atf) Figure Global Automatic Transmission Fluid (Atf) Value ($) Segment by Type from 2014-2019 Figure Semi-Synthetic Automatic Transmission Fluid Picture Figure Full-Synthetic Automatic Transmission Fluid Picture Table Different Applications of Automatic Transmission Fluid (Atf) Figure Global Automatic Transmission Fluid (Atf) Value ($) Segment by Applications from 2014-2019 Figure Passenger Car Picture Figure Light Commercial Vehicle Picture Figure Heavy Commercial Vehicle Picture Table Research Regions of Automatic Transmission Fluid (Atf) Figure North America Automatic Transmission Fluid (Atf) Production Value ($) and Growth Rate (2014-2019) Figure Europe Automatic Transmission Fluid (Atf) Production Value ($) and Growth Rate (2014-2019) Table China Automatic Transmission Fluid (Atf) Production Value ($) and Growth Rate (2014-2019) Table Japan Automatic Transmission Fluid (Atf) Production Value ($) and Growth Rate (2014-2019) Table Middle East & Africa Automatic Transmission Fluid (Atf) Production Value ($) and Growth Rate (2014-2019) Table India Automatic Transmission Fluid (Atf) Production Value ($) and Growth Rate (2014-2019) Table South America Automatic Transmission Fluid (Atf) Production Value ($) and Growth Rate (2014-2019) Table Emerging Countries of Automatic Transmission Fluid (Atf) Table Growing Market of Automatic Transmission Fluid (Atf) Figure Industry Chain Analysis of Automatic Transmission Fluid (Atf) Table Upstream Raw Material Suppliers of Automatic Transmission Fluid (Atf) with Contact Information Table Major Players Manufacturing Base and Market Share ($) of Automatic Transmission Fluid (Atf) in 2018 Table Major Players Automatic Transmission Fluid (Atf) Product Types in 2018 Figure Production Process of Automatic Transmission Fluid (Atf) Figure Manufacturing Cost Structure of Automatic Transmission Fluid (Atf) Figure Channel Status of Automatic Transmission Fluid (Atf) Table Major Distributors of Automatic Transmission Fluid (Atf) with Contact Information Table Major Downstream Buyers of Automatic Transmission Fluid (Atf) with Contact Information Table Global Automatic Transmission Fluid (Atf) Value ($) by Type (2014-2019) Table Global Automatic Transmission Fluid (Atf) Value ($) Share by Type (2014-2019) Figure Global Automatic Transmission Fluid (Atf) Value ($) Share by Type (2014-2019) Table Global Automatic Transmission Fluid (Atf) Production by Type (2014-2019) Table Global Automatic Transmission Fluid (Atf) Production Share by Type (2014-2019) Figure Global Automatic Transmission Fluid (Atf) Production Share by Type (2014-2019) Figure Global Automatic Transmission Fluid (Atf) Value ($) and Growth Rate of Semi-Synthetic Automatic Transmission Fluid Figure Global Automatic Transmission Fluid (Atf) Value ($) and Growth Rate of Full-Synthetic Automatic Transmission Fluid Figure Global Automatic Transmission Fluid (Atf) Price by Type (2014-2019) Table Global Automatic Transmission Fluid (Atf) Consumption by Application (2014-2019) Table Global Automatic Transmission Fluid (Atf) Consumption Market Share by Application (2014-2019) Figure Global Automatic Transmission Fluid (Atf) Consumption Market Share by Application (2014-2019) Table Downstream Buyers Introduction by Application Figure Global Automatic Transmission Fluid (Atf) Consumption and Growth Rate of Passenger Car (2014-2019) Figure Global Automatic Transmission Fluid (Atf) Consumption and Growth Rate of Light Commercial Vehicle (2014-2019) Figure Global Automatic Transmission Fluid (Atf) Consumption and Growth Rate of Heavy Commercial Vehicle (2014-2019) Table Global Automatic Transmission Fluid (Atf) Value ($) by Region (2014-2019) Table Global Automatic Transmission Fluid (Atf) Value ($) Market Share by Region (2014-2019) Figure Global Automatic Transmission Fluid (Atf) Value ($) Market Share by Region (2014-2019) Table Global Automatic Transmission Fluid (Atf) Production by Region (2014-2019) Table Global Automatic Transmission Fluid (Atf) Production Market Share by Region (2014-2019) Figure Global Automatic Transmission Fluid (Atf) Production Market Share by Region (2014-2019) Table Global Automatic Transmission Fluid (Atf) Production, Value ($), Price and Gross Margin (2014-2019) Table North America Automatic Transmission Fluid (Atf) Production, Value ($), Price and Gross Margin (2014-2019) Table Europe Automatic Transmission Fluid (Atf) Production, Value ($), Price and Gross Margin (2014-2019) Table China Automatic Transmission Fluid (Atf) Production, Value ($), Price and Gross Margin (2014-2019) Table Japan Automatic Transmission Fluid (Atf) Production, Value ($), Price and Gross Margin (2014-2019) Table Middle East & Africa Automatic Transmission Fluid (Atf) Production, Value ($), Price and Gross Margin (2014-2019) Table India Automatic Transmission Fluid (Atf) Production, Value ($), Price and Gross Margin (2014-2019) Table South America Automatic Transmission Fluid (Atf) Production, Value ($), Price and Gross Margin (2014-2019) Table Global Automatic Transmission Fluid (Atf) Consumption by Regions (2014-2019) Figure Global Automatic Transmission Fluid (Atf) Consumption Share by Regions (2014-2019) Table North America Automatic Transmission Fluid (Atf) Production, Consumption, Export, Import (2014-2019) Table Europe Automatic Transmission Fluid (Atf) Production, Consumption, Export, Import (2014-2019) Table China Automatic Transmission Fluid (Atf) Production, Consumption, Export, Import (2014-2019) Table Japan Automatic Transmission Fluid (Atf) Production, Consumption, Export, Import (2014-2019) Table Middle East & Africa Automatic Transmission Fluid (Atf) Production, Consumption, Export, Import (2014-2019) Table India Automatic Transmission Fluid (Atf) Production, Consumption, Export, Import (2014-2019) Table South America Automatic Transmission Fluid (Atf) Production, Consumption, Export, Import (2014-2019) Figure North America Automatic Transmission Fluid (Atf) Production and Growth Rate Analysis Figure North America Automatic Transmission Fluid (Atf) Consumption and Growth Rate Analysis Figure North America Automatic Transmission Fluid (Atf) SWOT Analysis Figure Europe Automatic Transmission Fluid (Atf) Production and Growth Rate Analysis Figure Europe Automatic Transmission Fluid (Atf) Consumption and Growth Rate Analysis Figure Europe Automatic Transmission Fluid (Atf) SWOT Analysis Figure China Automatic Transmission Fluid (Atf) Production and Growth Rate Analysis Figure China Automatic Transmission Fluid (Atf) Consumption and Growth Rate Analysis Figure China Automatic Transmission Fluid (Atf) SWOT Analysis Figure Japan Automatic Transmission Fluid (Atf) Production and Growth Rate Analysis Figure Japan Automatic Transmission Fluid (Atf) Consumption and Growth Rate Analysis Figure Japan Automatic Transmission Fluid (Atf) SWOT Analysis Figure Middle East & Africa Automatic Transmission Fluid (Atf) Production and Growth Rate Analysis Figure Middle East & Africa Automatic Transmission Fluid (Atf) Consumption and Growth Rate Analysis Figure Middle East & Africa Automatic Transmission Fluid (Atf) SWOT Analysis Figure India Automatic Transmission Fluid (Atf) Production and Growth Rate Analysis Figure India Automatic Transmission Fluid (Atf) Consumption and Growth Rate Analysis Figure India Automatic Transmission Fluid (Atf) SWOT Analysis Figure South America Automatic Transmission Fluid (Atf) Production and Growth Rate Analysis Figure South America Automatic Transmission Fluid (Atf) Consumption and Growth Rate Analysis Figure South America Automatic Transmission Fluid (Atf) SWOT Analysis Figure Top 3 Market Share of Automatic Transmission Fluid (Atf) Companies Figure Top 6 Market Share of Automatic Transmission Fluid (Atf) Companies Table Mergers, Acquisitions and Expansion Analysis Table Company Profiles Table Product Introduction Table Valvoline Production, Value ($), Price, Gross Margin 2014-2019 Figure Valvoline Production and Growth Rate Figure Valvoline Value ($) Market Share 2014-2019 Figure Valvoline Market Share of Automatic Transmission Fluid (Atf) Segmented by Region in 2018 Table Company Profiles Table Product Introduction Table AISIN Production, Value ($), Price, Gross Margin 2014-2019 Figure AISIN Production and Growth Rate Figure AISIN Value ($) Market Share 2014-2019 Figure AISIN Market Share of Automatic Transmission Fluid (Atf) Segmented by Region in 2018 Table Company Profiles Table Product Introduction Table Pentosin Production, Value ($), Price, Gross Margin 2014-2019 Figure Pentosin Production and Growth Rate Figure Pentosin Value ($) Market Share 2014-2019 Figure Pentosin Market Share of Automatic Transmission Fluid (Atf) Segmented by Region in 2018 Table Company Profiles Table Product Introduction Table Prestone Production, Value ($), Price, Gross Margin 2014-2019 Figure Prestone Production and Growth Rate Figure Prestone Value ($) Market Share 2014-2019 Figure Prestone Market Share of Automatic Transmission Fluid (Atf) Segmented by Region in 2018 Table Company Profiles Table Product Introduction Table Petro-Canada Production, Value ($), Price, Gross Margin 2014-2019 Figure Petro-Canada Production and Growth Rate Figure Petro-Canada Value ($) Market Share 2014-2019 Figure Petro-Canada Market Share of Automatic Transmission Fluid (Atf) Segmented by Region in 2018 Table Company Profiles Table Product Introduction Table Royal Purple Production, Value ($), Price, Gross Margin 2014-2019 Figure Royal Purple Production and Growth Rate Figure Royal Purple Value ($) Market Share 2014-2019 Figure Royal Purple Market Share of Automatic Transmission Fluid (Atf) Segmented by Region in 2018 Table Company Profiles Table Product Introduction Table ExxonMobil Production, Value ($), Price, Gross Margin 2014-2019 Figure ExxonMobil Production and Growth Rate Figure ExxonMobil Value ($) Market Share 2014-2019 Figure ExxonMobil Market Share of Automatic Transmission Fluid (Atf) Segmented by Region in 2018 Table Company Profiles Table Product Introduction Table Sinopec Lubricant Production, Value ($), Price, Gross Margin 2014-2019 Figure Sinopec Lubricant Production and Growth Rate Figure Sinopec Lubricant Value ($) Market Share 2014-2019 Figure Sinopec Lubricant Market Share of Automatic Transmission Fluid (Atf) Segmented by Region in 2018 Table Company Profiles Table Product Introduction Table American Hitech Petroleum & Chemicals (AMTECOL) Production, Value ($), Price, Gross Margin 2014-2019 Figure American Hitech Petroleum & Chemicals (AMTECOL) Production and Growth Rate Figure American Hitech Petroleum & Chemicals (AMTECOL) Value ($) Market Share 2014-2019 Figure American Hitech Petroleum & Chemicals (AMTECOL) Market Share of Automatic Transmission Fluid (Atf) Segmented by Region in 2018 Table Company Profiles Table Product Introduction Table Red Line Production, Value ($), Price, Gross Margin 2014-2019 Figure Red Line Production and Growth Rate Figure Red Line Value ($) Market Share 2014-2019 Figure Red Line Market Share of Automatic Transmission Fluid (Atf) Segmented by Region in 2018 Table Company Profiles Table Product Introduction Table Afton Chemical Production, Value ($), Price, Gross Margin 2014-2019 Figure Afton Chemical Production and Growth Rate Figure Afton Chemical Value ($) Market Share 2014-2019 Figure Afton Chemical Market Share of Automatic Transmission Fluid (Atf) Segmented by Region in 2018 Table Company Profiles Table Product Introduction Table Ford Production, Value ($), Price, Gross Margin 2014-2019 Figure Ford Production and Growth Rate Figure Ford Value ($) Market Share 2014-2019 Figure Ford Market Share of Automatic Transmission Fluid (Atf) Segmented by Region in 2018 Table Company Profiles Table Product Introduction Table Sinclair Production, Value ($), Price, Gross Margin 2014-2019 Figure Sinclair Production and Growth Rate Figure Sinclair Value ($) Market Share 2014-2019 Figure Sinclair Market Share of Automatic Transmission Fluid (Atf) Segmented by Region in 2018 Table Company Profiles Table Product Introduction Table Castrol Production, Value ($), Price, Gross Margin 2014-2019 Figure Castrol Production and Growth Rate Figure Castrol Value ($) Market Share 2014-2019 Figure Castrol Market Share of Automatic Transmission Fluid (Atf) Segmented by Region in 2018 Table Company Profiles Table Product Introduction Table AMSOIL Production, Value ($), Price, Gross Margin 2014-2019 Figure AMSOIL Production and Growth Rate Figure AMSOIL Value ($) Market Share 2014-2019 Figure AMSOIL Market Share of Automatic Transmission Fluid (Atf) Segmented by Region in 2018 Table Company Profiles Table Product Introduction Table B&M Production, Value ($), Price, Gross Margin 2014-2019 Figure B&M Production and Growth Rate Figure B&M Value ($) Market Share 2014-2019 Figure B&M Market Share of Automatic Transmission Fluid (Atf) Segmented by Region in 2018 Table Company Profiles Table Product Introduction Table Amalie Production, Value ($), Price, Gross Margin 2014-2019 Figure Amalie Production and Growth Rate Figure Amalie Value ($) Market Share 2014-2019 Figure Amalie Market Share of Automatic Transmission Fluid (Atf) Segmented by Region in 2018 Table Company Profiles Table Product Introduction Table Super Tech Production, Value ($), Price, Gross Margin 2014-2019 Figure Super Tech Production and Growth Rate Figure Super Tech Value ($) Market Share 2014-2019 Figure Super Tech Market Share of Automatic Transmission Fluid (Atf) Segmented by Region in 2018 Table Company Profiles Table Product Introduction Table Shell Production, Value ($), Price, Gross Margin 2014-2019 Figure Shell Production and Growth Rate Figure Shell Value ($) Market Share 2014-2019 Figure Shell Market Share of Automatic Transmission Fluid (Atf) Segmented by Region in 2018 Table Company Profiles Table Product Introduction Table Gulf Production, Value ($), Price, Gross Margin 2014-2019 Figure Gulf Production and Growth Rate Figure Gulf Value ($) Market Share 2014-2019 Figure Gulf Market Share of Automatic Transmission Fluid (Atf) Segmented by Region in 2018 Table Company Profiles Table Product Introduction Table Honda Production, Value ($), Price, Gross Margin 2014-2019 Figure Honda Production and Growth Rate Figure Honda Value ($) Market Share 2014-2019 Figure Honda Market Share of Automatic Transmission Fluid (Atf) Segmented by Region in 2018 Table Global Automatic Transmission Fluid (Atf) Market Value ($) Forecast, by Type Table Global Automatic Transmission Fluid (Atf) Market Volume Forecast, by Type Figure Global Automatic Transmission Fluid (Atf) Market Value ($) and Growth Rate Forecast of Semi-Synthetic Automatic Transmission Fluid (2019-2024) Figure Global Automatic Transmission Fluid (Atf) Market Volume and Growth Rate Forecast of Semi-Synthetic Automatic Transmission Fluid (2019-2024) Figure Global Automatic Transmission Fluid (Atf) Market Value ($) and Growth Rate Forecast of Full-Synthetic Automatic Transmission Fluid (2019-2024) Figure Global Automatic Transmission Fluid (Atf) Market Volume and Growth Rate Forecast of Full-Synthetic Automatic Transmission Fluid (2019-2024) Table Global Market Value ($) Forecast by Application (2019-2024) Table Global Market Volume Forecast by Application (2019-2024) Figure Global Automatic Transmission Fluid (Atf) Consumption and Growth Rate of Passenger Car (2014-2019) Figure Global Automatic Transmission Fluid (Atf) Consumption and Growth Rate of Light Commercial Vehicle (2014-2019) Figure Global Automatic Transmission Fluid (Atf) Consumption and Growth Rate of Heavy Commercial Vehicle (2014-2019) Figure Market Value ($) and Growth Rate Forecast of Heavy Commercial Vehicle (2019-2024) Figure Market Volume and Growth Rate Forecast of Heavy Commercial Vehicle (2019-2024) Figure North America Market Value ($) and Growth Rate Forecast (2019-2024) Table North America Consumption and Growth Rate Forecast (2019-2024) Figure Europe Market Value ($) and Growth Rate Forecast (2019-2024) Table Europe Consumption and Growth Rate Forecast (2019-2024) Figure China Market Value ($) and Growth Rate Forecast (2019-2024) Table China Consumption and Growth Rate Forecast (2019-2024) Figure Japan Market Value ($) and Growth Rate Forecast (2019-2024) Table Japan Consumption and Growth Rate Forecast (2019-2024) Figure Middle East & Africa Market Value ($) and Growth Rate Forecast (2019-2024) Table Middle East & Africa Consumption and Growth Rate Forecast (2019-2024) Figure India Market Value ($) and Growth Rate Forecast (2019-2024) Table India Consumption and Growth Rate Forecast (2019-2024) Figure South America Market Value ($) and Growth Rate Forecast (2019-2024) Table South America Consumption and Growth Rate Forecast (2019-2024) Figure Industry Resource/Technology/Labor Importance Analysis Table New Entrants SWOT Analysis Table New Project Analysis of Investment Recovery
Inquiry For Buying
Automatic Transmission Fluid (Atf)
Request Sample
Automatic Transmission Fluid (Atf)