Butylated Hydroxyanisole (BHA) and Butylated Market Size, Share, and Trends Analysis Report
CAGR :

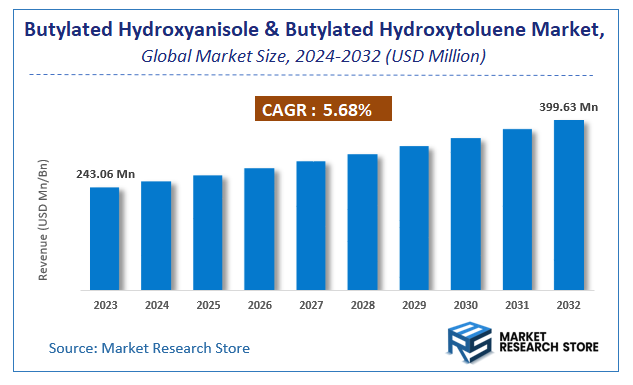
| Market Size 2023 (Base Year) | USD 243.06 Million |
| Market Size 2032 (Forecast Year) | USD 399.63 Million |
| CAGR | 5.68% |
| Forecast Period | 2024 - 2032 |
| Historical Period | 2018 - 2023 |
Butylated Hydroxyanisole (BHA) and Butylated Hydroxytoluene (BHT) Market Insights
As per the published report by Market Research Store, the Global Butylated Hydroxyanisole (BHA) and Butylated Hydroxytoluene (BHT) Market size was estimated at USD 243.06 Million in 2023 and is anticipated to reach reach USD 399.63 Million by 2032, growing at a projected CAGR of 5.68% during the forecast period 2024-2032. The report provides a detailed analysis of the global Butylated Hydroxyanisole (BHA) and Butylated Hydroxytoluene (BHT) Market, including market trends, market dynamics, and market opportunities during the forecast period (2024-2032). It delves deeper into several market facets, such as market definition, size, growth, forecast, segmentation, competitive analysis, growth drivers, restraints, financial analysis, SWOT analysis, PORTER’s five force analysis, PESTEL analysis, market share analysis, cost-benefit analysis, challenges, restraints, strategic recommendations, and market players.
To Get more Insights, Request a Free Sample
Butylated Hydroxyanisole (BHA) and Butylated Hydroxytoluene (BHT) Market: Overview
The growth of the butylated hydroxyanisole (BHA) and butylated hydroxytoluene (BHT) market is fueled by rising global demand across various industries and applications. The report highlights lucrative opportunities, analyzing cost structures, key segments, emerging trends, regional dynamics, and advancements by leading players to provide comprehensive market insights. The butylated hydroxyanisole (BHA) and butylated hydroxytoluene (BHT) market report offers a detailed industry analysis from 2024 to 2032, combining quantitative and qualitative insights. It examines key factors such as pricing, market penetration, GDP impact, industry dynamics, major players, consumer behavior, and socio-economic conditions. Structured into multiple sections, the report provides a comprehensive perspective on the market from all angles.
Key sections of the butylated hydroxyanisole (BHA) and butylated hydroxytoluene (BHT) market report include market segments, outlook, competitive landscape, and company profiles. Market Segments offer in-depth details based on Type, Application, Grade, and other relevant classifications to support strategic marketing initiatives. Market Outlook thoroughly analyzes market trends, growth drivers, restraints, opportunities, challenges, Porter’s Five Forces framework, macroeconomic factors, value chain analysis, and pricing trends shaping the market now and in the future. The Competitive Landscape and Company Profiles section highlights major players, their strategies, and market positioning to guide investment and business decisions. The report also identifies innovation trends, new business opportunities, and investment prospects for the forecast period.
Key Highlights:
- As per the analysis shared by our research analyst, the global butylated hydroxyanisole (BHA) and butylated hydroxytoluene (BHT) market is estimated to grow annually at a CAGR of around 5.68% over the forecast period (2024-2032).
- In terms of revenue, the global butylated hydroxyanisole (BHA) and butylated hydroxytoluene (BHT) market size was valued at around USD 243.06 Million in 2023 and is projected to reach USD 399.63 Million by 2032.
- The market is projected to grow at a significant rate due to rising demand for processed and packaged foods, where these antioxidants play a crucial role in maintaining freshness.
- Based on the Type, the BHT and BHA segment is growing at a high rate and will continue to dominate the global market as per industry projections.
- On the basis of Application, the Rubber/Plastic segment is anticipated to command the largest market share.
- In terms of Grade, the Technical and Food segment is projected to lead the global market.
- Based on region, Asia-Pacific is projected to dominate the global market during the forecast period.
Butylated Hydroxyanisole (BHA) and Butylated Hydroxytoluene (BHT) Market: Report Scope
This report thoroughly analyzes the butylated hydroxyanisole (BHA) and butylated hydroxytoluene (BHT) market, exploring its historical trends, current state, and future projections. The market estimates presented result from a robust research methodology, incorporating primary research, secondary sources, and expert opinions. These estimates are influenced by the prevailing market dynamics as well as key economic, social, and political factors. Furthermore, the report considers the impact of regulations, government expenditures, and advancements in research and development on the market. Both positive and negative shifts are evaluated to ensure a comprehensive and accurate market outlook.
| Report Attributes | Report Details |
|---|---|
| Report Name | Butylated Hydroxyanisole (BHA) and Butylated Hydroxytoluene (BHT) Market |
| Market Size in 2023 | USD 243.06 Million |
| Market Forecast in 2032 | USD 399.63 Million |
| Growth Rate | CAGR of 5.68% |
| Number of Pages | 177 |
| Key Companies Covered | Tyson Foods Inc., Tetra Pak, MOLEKULA, Honeywell International Inc, Holdings Inc, Eastman Chemical Co., DuPont, Celanese Corp., Cargill Inc, Bemis Company Inc., BASF, Ball CorpCrown, and Archer Daniels Midland. |
| Segments Covered | By Type, By Application, By Grade, and By Region |
| Regions Covered | North America, Europe, Asia Pacific (APAC), Latin America, Middle East, and Africa (MEA) |
| Base Year | 2023 |
| Historical Year | 2018 to 2023 |
| Forecast Year | 2024 to 2032 |
| Customization Scope | Avail customized purchase options to meet your exact research needs. Request For Customization |
Butylated Hydroxyanisole (BHA) and Butylated Hydroxytoluene (BHT) Market: Dynamics
Key Growth Drivers
The Indian market for Butylated Hydroxyanisole (BHA) and Butylated Hydroxytoluene (BHT) is experiencing growth primarily due to the expanding food processing industry and the increasing demand for packaged and processed foods with extended shelf lives. The rising awareness of food preservation techniques among manufacturers and the need to prevent oxidation and maintain the quality of food products are significant drivers. Furthermore, the growing applications of BHA and BHT in other industries such as animal feed (to preserve nutritional quality), cosmetics and personal care products (as stabilizers and antioxidants), and industrial lubricants and oils (to prevent oxidative damage) contribute to the market's expansion. The cost-effectiveness and proven efficacy of BHA and BHT as antioxidants continue to make them preferred choices in many applications.
Restraints
Despite their widespread use, the BHA and BHT market in India faces restraints due to increasing health concerns and regulatory scrutiny over synthetic antioxidants. Research linking high consumption levels to potential health risks has led to consumer aversion and stricter regulations in some regions globally, which can influence the Indian market's perception and regulatory landscape over time. The growing consumer awareness and demand for clean-label products with natural ingredients are pushing manufacturers to explore and adopt natural antioxidant alternatives, thereby potentially limiting the use of synthetic options like BHA and BHT in the long run. Negative publicity and potential future regulatory changes could further impede market growth.
Opportunities
The Indian BHA and BHT market has opportunities in developing grades and formulations that meet evolving safety standards and cater to specific application needs. Continuous research into optimizing the use of these antioxidants within regulatory frameworks and ensuring consumer safety can help maintain their market presence. Furthermore, exploring synergistic combinations with natural antioxidants or developing innovative delivery systems could enhance their efficacy and address some health concerns. The increasing demand for product longevity and stability in various industries, coupled with the cost-effectiveness of BHA and BHT, still presents opportunities for their continued use, especially in industrial applications where natural alternatives may not be as suitable or economical.
Challenges
The primary challenges for the BHA and BHT market in India revolve around managing the negative perception and potential health concerns associated with synthetic antioxidants. Adapting to the increasing preference for natural and clean-label ingredients in food and cosmetics will require manufacturers to either innovate with BHA/BHT formulations or explore alternative preservatives. Navigating the evolving regulatory landscape both in India and globally and ensuring compliance with stringent safety evaluations will be crucial. Educating consumers and addressing misinformation regarding the safe use of BHA and BHT within approved limits will also be important for maintaining market acceptance. The competition from increasingly effective and cost-competitive natural antioxidants poses a continuous challenge to the market share of BHA and BHT.
Butylated Hydroxyanisole (BHA) and Butylated Hydroxytoluene (BHT) Market: Segmentation Insights
The global butylated hydroxyanisole (BHA) and butylated hydroxytoluene (BHT) market is segmented based on Type, Application, Grade, and Region. All the segments of the butylated hydroxyanisole (BHA) and butylated hydroxytoluene (BHT) market have been analyzed based on present & future trends and the market is estimated from 2024 to 2032.
Based on Type, the global butylated hydroxyanisole (BHA) and butylated hydroxytoluene (BHT) market is divided into BHT and BHA.
On the basis of Application, the global butylated hydroxyanisole (BHA) and butylated hydroxytoluene (BHT) market is bifurcated into Rubber/Plastic, Food, Fuel, Cosmetic, Pharmaceutical, and Animal Feed.
In terms of Grade, the global butylated hydroxyanisole (BHA) and butylated hydroxytoluene (BHT) market is categorized into Technical and Food.
Butylated Hydroxyanisole (BHA) and Butylated Hydroxytoluene (BHT) Market: Regional Insights
The Asia-Pacific (APAC) region, led by China, India, and Japan, dominates the Butylated Hydroxyanisole (BHA) and Butylated Hydroxytoluene (BHT) Market, accounting for the largest revenue share due to booming food processing, cosmetics, and pharmaceutical industries. In 2023, APAC held over 48% of the global market share, driven by China’s massive chemical production capacity and India’s rapidly growing packaged food sector. Japan contributes with high demand for preservatives in cosmetics and pharmaceuticals.
North America, particularly the U.S., follows as the second-largest market, supported by stringent FDA regulations and high consumption of processed foods and personal care products, while Europe, led by Germany and France, emphasizes natural alternatives but maintains steady demand for BHA/BHT in industrial applications. APAC’s dominance is reinforced by low production costs, expanding middle-class consumption, and rising exports of preservative-laden products. The region is projected to grow at the highest CAGR, despite increasing health concerns, fueled by surging demand for shelf-stable foods and affordable cosmetics.
Butylated Hydroxyanisole (BHA) and Butylated Hydroxytoluene (BHT) Market: Competitive Landscape
The butylated hydroxyanisole (BHA) and butylated hydroxytoluene (BHT) market report offers a thorough analysis of both established and emerging players within the market. It includes a detailed list of key companies, categorized based on the types of products they offer and other relevant factors. The report also highlights the market entry year for each player, providing further context for the research analysis.
The "Global Butylated Hydroxyanisole (BHA) and Butylated Hydroxytoluene (BHT) Market" study offers valuable insights, focusing on the global market landscape, with an emphasis on major industry players such as;
- Tyson Foods Inc.
- Tetra Pak
- MOLEKULA
- Honeywell International Inc
- Holdings Inc
- Eastman Chemical Co.
- DuPont
- Celanese Corp.
- Cargill Inc
- Bemis Company Inc.
- BASF
- Ball CorpCrown
- and Archer Daniels Midland.
The Global Butylated Hydroxyanisole (BHA) and Butylated Hydroxytoluene (BHT) Market is Segmented as Follows:
By Type
- BHT and BHA
By Application
- Rubber/Plastic
- Food
- Fuel
- Cosmetic
- Pharmaceutical
- and Animal Feed
By Grade
- Technical and Food
By Region
- North America
- The U.S.
- Canada
- Mexico
- Europe
- France
- The UK
- Spain
- Germany
- Italy
- Rest of Europe
- Asia Pacific
- China
- Japan
- India
- Australia
- South Korea
- Rest of Asia Pacific
- The Middle East & Africa
- Saudi Arabia
- UAE
- Egypt
- Kuwait
- South Africa
- Rest of the Middle East & Africa
- Latin America
- Brazil
- Argentina
- Rest of Latin America
Market Evolution
This section evaluates the market position of the product or service by examining its development pathway and competitive dynamics. It provides a detailed overview of the product's growth stages, including the early (historical) phase, the mid-stage, and anticipated future advancements influenced by innovation and emerging technologies.
Porter’s Analysis
Porter’s Five Forces framework offers a strategic lens for assessing competitor behavior and the positioning of key players in the butylated hydroxyanisole (BHA) and butylated hydroxytoluene (BHT) industry. This section explores the external factors shaping competitive dynamics and influencing market strategies in the years ahead. The analysis focuses on five critical forces:
- Competitive Rivalry
- Threat of New Entrants
- Threat of Substitutes
- Supplier Bargaining Power
- Buyer Bargaining Power
Value Chain & Market Attractiveness Analysis
The value chain analysis helps businesses optimize operations by mapping the product flow from suppliers to end consumers, identifying opportunities to streamline processes and gain a competitive edge. Segment-wise market attractiveness analysis evaluates key dimensions like product categories, demographics, and regions, assessing growth potential, market size, and profitability. This enables businesses to focus resources on high-potential segments for better ROI and long-term value.
PESTEL Analysis
PESTEL analysis is a powerful tool in market research reports that enhances market understanding by systematically examining the external macro-environmental factors influencing a business or industry. The acronym stands for Political, Economic, Social, Technological, Environmental, and Legal factors. By evaluating these dimensions, PESTEL analysis provides a comprehensive overview of the broader context within which a market operates, helping businesses identify potential opportunities and threats.
- Political factors assess government policies, stability, trade regulations, and political risks that could impact market operations.
- Economic factors examine variables like inflation, exchange rates, economic growth, and consumer spending power to determine market viability.
- Social factors explore cultural trends, demographics, and lifestyle changes that shape consumer behavior and preferences.
- Technological factors evaluate innovation, R&D, and technological advancements affecting product development and operational efficiencies.
- Environmental factors focus on sustainability, climate change impacts, and eco-friendly practices shaping market trends.
- Legal factors address compliance requirements, industry regulations, and intellectual property laws impacting market entry and operations.
Import-export Analysis & Pricing Analysis
An import-export analysis is vital for market research, revealing global trade dynamics, trends, and opportunities. It examines trade volumes, product categories, and regional competitiveness, offering insights into supply chains and market demand. This section also analyzes past and future pricing trends, helping businesses optimize strategies and enabling consumers to assess product value effectively.
Butylated Hydroxyanisole (BHA) and Butylated Hydroxytoluene (BHT) Market: Company Profiles
The report identifies key players in the butylated hydroxyanisole (BHA) and butylated hydroxytoluene (BHT) market through a competitive landscape and company profiles, evaluating their offerings, financial performance, strategies, and market positioning. It includes a SWOT analysis of the top 3-5 companies, assessing strengths, weaknesses, opportunities, and threats. The competitive landscape highlights rankings, recent activities (mergers, acquisitions, partnerships, product launches), and regional footprints using the Ace matrix. Customization is available to meet client-specific needs.
Regional & Industry Footprint
This section details the geographic reach, sales networks, and market penetration of companies profiled in the butylated hydroxyanisole (BHA) and butylated hydroxytoluene (BHT) report, showcasing their operations and distribution across regions. It analyzes the alignment of companies with specific industry verticals, highlighting the industries they serve and the scope of their products and services within those sectors.
Ace Matrix
This section categorizes companies into four distinct groups—Active, Cutting Edge, Innovator, and Emerging—based on their product and business strategies. The evaluation of product strategy focuses on aspects such as the range and depth of offerings, commitment to innovation, product functionalities, and scalability. Key elements like global reach, sector coverage, strategic acquisitions, and long-term growth plans are considered for business strategy. This analysis provides a detailed view of companies' position within the market and highlights their potential for future growth and development.
Research Methodology
The qualitative and quantitative insights for the butylated hydroxyanisole (BHA) and butylated hydroxytoluene (BHT) market are derived through a multi-faceted research approach, combining input from subject matter experts, primary research, and secondary data sources. Primary research includes gathering critical information via face-to-face or telephonic interviews, surveys, questionnaires, and feedback from industry professionals, key opinion leaders (KOLs), and customers. Regular interviews with industry experts are conducted to deepen the analysis and reinforce the existing data, ensuring a robust and well-rounded market understanding.
Secondary research for this report was carried out by the Market Research Store team, drawing on a variety of authoritative sources, such as:
- Official company websites, annual reports, financial statements, investor presentations, and SEC filings
- Internal and external proprietary databases, as well as relevant patent and regulatory databases
- Government publications, national statistical databases, and industry-specific market reports
- Media coverage, including news articles, press releases, and webcasts about market participants
- Paid industry databases for detailed market insights
Market Research Store conducted in-depth consultations with various key opinion leaders in the industry, including senior executives from top companies and regional leaders from end-user organizations. This effort aimed to gather critical insights on factors such as the market share of dominant brands in specific countries and regions, along with pricing strategies for products and services.
To determine total sales data, the research team conducted primary interviews across multiple countries with influential stakeholders, including:
- Distributors
- Marketing, Brand, and Product Managers
- Procurement and Production Managers
- Sales and Regional Sales Managers, Country Managers
- Technical Specialists
- C-Level Executives
These subject matter experts, with their extensive industry experience, helped validate and refine the findings. For secondary research, data was sourced from a wide range of materials, including online resources, company annual reports, industry publications, research papers, association reports, and government websites. These various sources provide a comprehensive and well-rounded perspective on the market.
Frequently Asked Questions
Table Of Content
List of Tables and Figures Figure Product Picture of Butylated Hydroxyanisole (BHA) and Butylated Hydroxytoluene (BHT) Table Product Specification of Butylated Hydroxyanisole (BHA) and Butylated Hydroxytoluene (BHT) Figure Market Concentration Ratio and Market Maturity Analysis of Butylated Hydroxyanisole (BHA) and Butylated Hydroxytoluene (BHT) Figure Global Butylated Hydroxyanisole (BHA) and Butylated Hydroxytoluene (BHT) Value ($) and Growth Rate from 2014-2024 Table Different Types of Butylated Hydroxyanisole (BHA) and Butylated Hydroxytoluene (BHT) Figure Global Butylated Hydroxyanisole (BHA) and Butylated Hydroxytoluene (BHT) Value ($) Segment by Type from 2014-2019 Figure Butylated Hydroxytoluen Picture Figure Butylated Hydroxyanisole Picture Table Different Applications of Butylated Hydroxyanisole (BHA) and Butylated Hydroxytoluene (BHT) Figure Global Butylated Hydroxyanisole (BHA) and Butylated Hydroxytoluene (BHT) Value ($) Segment by Applications from 2014-2019 Figure Pharmaceutical Picture Figure Oil & Gas Picture Figure Rubber/Plastic Industry Picture Figure Food Industry Picture Figure Cosmetic Picture Figure Others Picture Table Research Regions of Butylated Hydroxyanisole (BHA) and Butylated Hydroxytoluene (BHT) Figure North America Butylated Hydroxyanisole (BHA) and Butylated Hydroxytoluene (BHT) Production Value ($) and Growth Rate (2014-2019) Figure Europe Butylated Hydroxyanisole (BHA) and Butylated Hydroxytoluene (BHT) Production Value ($) and Growth Rate (2014-2019) Table China Butylated Hydroxyanisole (BHA) and Butylated Hydroxytoluene (BHT) Production Value ($) and Growth Rate (2014-2019) Table Japan Butylated Hydroxyanisole (BHA) and Butylated Hydroxytoluene (BHT) Production Value ($) and Growth Rate (2014-2019) Table Middle East & Africa Butylated Hydroxyanisole (BHA) and Butylated Hydroxytoluene (BHT) Production Value ($) and Growth Rate (2014-2019) Table India Butylated Hydroxyanisole (BHA) and Butylated Hydroxytoluene (BHT) Production Value ($) and Growth Rate (2014-2019) Table South America Butylated Hydroxyanisole (BHA) and Butylated Hydroxytoluene (BHT) Production Value ($) and Growth Rate (2014-2019) Table Emerging Countries of Butylated Hydroxyanisole (BHA) and Butylated Hydroxytoluene (BHT) Table Growing Market of Butylated Hydroxyanisole (BHA) and Butylated Hydroxytoluene (BHT) Figure Industry Chain Analysis of Butylated Hydroxyanisole (BHA) and Butylated Hydroxytoluene (BHT) Table Upstream Raw Material Suppliers of Butylated Hydroxyanisole (BHA) and Butylated Hydroxytoluene (BHT) with Contact Information Table Major Players Manufacturing Base and Market Share ($) of Butylated Hydroxyanisole (BHA) and Butylated Hydroxytoluene (BHT) in 2018 Table Major Players Butylated Hydroxyanisole (BHA) and Butylated Hydroxytoluene (BHT) Product Types in 2018 Figure Production Process of Butylated Hydroxyanisole (BHA) and Butylated Hydroxytoluene (BHT) Figure Manufacturing Cost Structure of Butylated Hydroxyanisole (BHA) and Butylated Hydroxytoluene (BHT) Figure Channel Status of Butylated Hydroxyanisole (BHA) and Butylated Hydroxytoluene (BHT) Table Major Distributors of Butylated Hydroxyanisole (BHA) and Butylated Hydroxytoluene (BHT) with Contact Information Table Major Downstream Buyers of Butylated Hydroxyanisole (BHA) and Butylated Hydroxytoluene (BHT) with Contact Information Table Global Butylated Hydroxyanisole (BHA) and Butylated Hydroxytoluene (BHT) Value ($) by Type (2014-2019) Table Global Butylated Hydroxyanisole (BHA) and Butylated Hydroxytoluene (BHT) Value ($) Share by Type (2014-2019) Figure Global Butylated Hydroxyanisole (BHA) and Butylated Hydroxytoluene (BHT) Value ($) Share by Type (2014-2019) Table Global Butylated Hydroxyanisole (BHA) and Butylated Hydroxytoluene (BHT) Production by Type (2014-2019) Table Global Butylated Hydroxyanisole (BHA) and Butylated Hydroxytoluene (BHT) Production Share by Type (2014-2019) Figure Global Butylated Hydroxyanisole (BHA) and Butylated Hydroxytoluene (BHT) Production Share by Type (2014-2019) Figure Global Butylated Hydroxyanisole (BHA) and Butylated Hydroxytoluene (BHT) Value ($) and Growth Rate of Butylated Hydroxytoluen Figure Global Butylated Hydroxyanisole (BHA) and Butylated Hydroxytoluene (BHT) Value ($) and Growth Rate of Butylated Hydroxyanisole Figure Global Butylated Hydroxyanisole (BHA) and Butylated Hydroxytoluene (BHT) Price by Type (2014-2019) Table Global Butylated Hydroxyanisole (BHA) and Butylated Hydroxytoluene (BHT) Consumption by Application (2014-2019) Table Global Butylated Hydroxyanisole (BHA) and Butylated Hydroxytoluene (BHT) Consumption Market Share by Application (2014-2019) Figure Global Butylated Hydroxyanisole (BHA) and Butylated Hydroxytoluene (BHT) Consumption Market Share by Application (2014-2019) Table Downstream Buyers Introduction by Application Figure Global Butylated Hydroxyanisole (BHA) and Butylated Hydroxytoluene (BHT) Consumption and Growth Rate of Pharmaceutical (2014-2019) Figure Global Butylated Hydroxyanisole (BHA) and Butylated Hydroxytoluene (BHT) Consumption and Growth Rate of Oil & Gas (2014-2019) Figure Global Butylated Hydroxyanisole (BHA) and Butylated Hydroxytoluene (BHT) Consumption and Growth Rate of Rubber/Plastic Industry (2014-2019) Figure Global Butylated Hydroxyanisole (BHA) and Butylated Hydroxytoluene (BHT) Consumption and Growth Rate of Food Industry (2014-2019) Figure Global Butylated Hydroxyanisole (BHA) and Butylated Hydroxytoluene (BHT) Consumption and Growth Rate of Cosmetic (2014-2019) Figure Global Butylated Hydroxyanisole (BHA) and Butylated Hydroxytoluene (BHT) Consumption and Growth Rate of Others (2014-2019) Table Global Butylated Hydroxyanisole (BHA) and Butylated Hydroxytoluene (BHT) Value ($) by Region (2014-2019) Table Global Butylated Hydroxyanisole (BHA) and Butylated Hydroxytoluene (BHT) Value ($) Market Share by Region (2014-2019) Figure Global Butylated Hydroxyanisole (BHA) and Butylated Hydroxytoluene (BHT) Value ($) Market Share by Region (2014-2019) Table Global Butylated Hydroxyanisole (BHA) and Butylated Hydroxytoluene (BHT) Production by Region (2014-2019) Table Global Butylated Hydroxyanisole (BHA) and Butylated Hydroxytoluene (BHT) Production Market Share by Region (2014-2019) Figure Global Butylated Hydroxyanisole (BHA) and Butylated Hydroxytoluene (BHT) Production Market Share by Region (2014-2019) Table Global Butylated Hydroxyanisole (BHA) and Butylated Hydroxytoluene (BHT) Production, Value ($), Price and Gross Margin (2014-2019) Table North America Butylated Hydroxyanisole (BHA) and Butylated Hydroxytoluene (BHT) Production, Value ($), Price and Gross Margin (2014-2019) Table Europe Butylated Hydroxyanisole (BHA) and Butylated Hydroxytoluene (BHT) Production, Value ($), Price and Gross Margin (2014-2019) Table China Butylated Hydroxyanisole (BHA) and Butylated Hydroxytoluene (BHT) Production, Value ($), Price and Gross Margin (2014-2019) Table Japan Butylated Hydroxyanisole (BHA) and Butylated Hydroxytoluene (BHT) Production, Value ($), Price and Gross Margin (2014-2019) Table Middle East & Africa Butylated Hydroxyanisole (BHA) and Butylated Hydroxytoluene (BHT) Production, Value ($), Price and Gross Margin (2014-2019) Table India Butylated Hydroxyanisole (BHA) and Butylated Hydroxytoluene (BHT) Production, Value ($), Price and Gross Margin (2014-2019) Table South America Butylated Hydroxyanisole (BHA) and Butylated Hydroxytoluene (BHT) Production, Value ($), Price and Gross Margin (2014-2019) Table Global Butylated Hydroxyanisole (BHA) and Butylated Hydroxytoluene (BHT) Consumption by Regions (2014-2019) Figure Global Butylated Hydroxyanisole (BHA) and Butylated Hydroxytoluene (BHT) Consumption Share by Regions (2014-2019) Table North America Butylated Hydroxyanisole (BHA) and Butylated Hydroxytoluene (BHT) Production, Consumption, Export, Import (2014-2019) Table Europe Butylated Hydroxyanisole (BHA) and Butylated Hydroxytoluene (BHT) Production, Consumption, Export, Import (2014-2019) Table China Butylated Hydroxyanisole (BHA) and Butylated Hydroxytoluene (BHT) Production, Consumption, Export, Import (2014-2019) Table Japan Butylated Hydroxyanisole (BHA) and Butylated Hydroxytoluene (BHT) Production, Consumption, Export, Import (2014-2019) Table Middle East & Africa Butylated Hydroxyanisole (BHA) and Butylated Hydroxytoluene (BHT) Production, Consumption, Export, Import (2014-2019) Table India Butylated Hydroxyanisole (BHA) and Butylated Hydroxytoluene (BHT) Production, Consumption, Export, Import (2014-2019) Table South America Butylated Hydroxyanisole (BHA) and Butylated Hydroxytoluene (BHT) Production, Consumption, Export, Import (2014-2019) Figure North America Butylated Hydroxyanisole (BHA) and Butylated Hydroxytoluene (BHT) Production and Growth Rate Analysis Figure North America Butylated Hydroxyanisole (BHA) and Butylated Hydroxytoluene (BHT) Consumption and Growth Rate Analysis Figure North America Butylated Hydroxyanisole (BHA) and Butylated Hydroxytoluene (BHT) SWOT Analysis Figure Europe Butylated Hydroxyanisole (BHA) and Butylated Hydroxytoluene (BHT) Production and Growth Rate Analysis Figure Europe Butylated Hydroxyanisole (BHA) and Butylated Hydroxytoluene (BHT) Consumption and Growth Rate Analysis Figure Europe Butylated Hydroxyanisole (BHA) and Butylated Hydroxytoluene (BHT) SWOT Analysis Figure China Butylated Hydroxyanisole (BHA) and Butylated Hydroxytoluene (BHT) Production and Growth Rate Analysis Figure China Butylated Hydroxyanisole (BHA) and Butylated Hydroxytoluene (BHT) Consumption and Growth Rate Analysis Figure China Butylated Hydroxyanisole (BHA) and Butylated Hydroxytoluene (BHT) SWOT Analysis Figure Japan Butylated Hydroxyanisole (BHA) and Butylated Hydroxytoluene (BHT) Production and Growth Rate Analysis Figure Japan Butylated Hydroxyanisole (BHA) and Butylated Hydroxytoluene (BHT) Consumption and Growth Rate Analysis Figure Japan Butylated Hydroxyanisole (BHA) and Butylated Hydroxytoluene (BHT) SWOT Analysis Figure Middle East & Africa Butylated Hydroxyanisole (BHA) and Butylated Hydroxytoluene (BHT) Production and Growth Rate Analysis Figure Middle East & Africa Butylated Hydroxyanisole (BHA) and Butylated Hydroxytoluene (BHT) Consumption and Growth Rate Analysis Figure Middle East & Africa Butylated Hydroxyanisole (BHA) and Butylated Hydroxytoluene (BHT) SWOT Analysis Figure India Butylated Hydroxyanisole (BHA) and Butylated Hydroxytoluene (BHT) Production and Growth Rate Analysis Figure India Butylated Hydroxyanisole (BHA) and Butylated Hydroxytoluene (BHT) Consumption and Growth Rate Analysis Figure India Butylated Hydroxyanisole (BHA) and Butylated Hydroxytoluene (BHT) SWOT Analysis Figure South America Butylated Hydroxyanisole (BHA) and Butylated Hydroxytoluene (BHT) Production and Growth Rate Analysis Figure South America Butylated Hydroxyanisole (BHA) and Butylated Hydroxytoluene (BHT) Consumption and Growth Rate Analysis Figure South America Butylated Hydroxyanisole (BHA) and Butylated Hydroxytoluene (BHT) SWOT Analysis Figure Top 3 Market Share of Butylated Hydroxyanisole (BHA) and Butylated Hydroxytoluene (BHT) Companies Figure Top 6 Market Share of Butylated Hydroxyanisole (BHA) and Butylated Hydroxytoluene (BHT) Companies Table Mergers, Acquisitions and Expansion Analysis Table Company Profiles Table Product Introduction Table Celanese Corp. Production, Value ($), Price, Gross Margin 2014-2019 Figure Celanese Corp. Production and Growth Rate Figure Celanese Corp. Value ($) Market Share 2014-2019 Figure Celanese Corp. Market Share of Butylated Hydroxyanisole (BHA) and Butylated Hydroxytoluene (BHT) Segmented by Region in 2018 Table Company Profiles Table Product Introduction Table Kraft-Heinz Co. Production, Value ($), Price, Gross Margin 2014-2019 Figure Kraft-Heinz Co. Production and Growth Rate Figure Kraft-Heinz Co. Value ($) Market Share 2014-2019 Figure Kraft-Heinz Co. Market Share of Butylated Hydroxyanisole (BHA) and Butylated Hydroxytoluene (BHT) Segmented by Region in 2018 Table Company Profiles Table Product Introduction Table Tyson Foods Inc. Production, Value ($), Price, Gross Margin 2014-2019 Figure Tyson Foods Inc. Production and Growth Rate Figure Tyson Foods Inc. Value ($) Market Share 2014-2019 Figure Tyson Foods Inc. Market Share of Butylated Hydroxyanisole (BHA) and Butylated Hydroxytoluene (BHT) Segmented by Region in 2018 Table Company Profiles Table Product Introduction Table Dupont Production, Value ($), Price, Gross Margin 2014-2019 Figure Dupont Production and Growth Rate Figure Dupont Value ($) Market Share 2014-2019 Figure Dupont Market Share of Butylated Hydroxyanisole (BHA) and Butylated Hydroxytoluene (BHT) Segmented by Region in 2018 Table Company Profiles Table Product Introduction Table Basf Production, Value ($), Price, Gross Margin 2014-2019 Figure Basf Production and Growth Rate Figure Basf Value ($) Market Share 2014-2019 Figure Basf Market Share of Butylated Hydroxyanisole (BHA) and Butylated Hydroxytoluene (BHT) Segmented by Region in 2018 Table Company Profiles Table Product Introduction Table Honeywell International Inc Production, Value ($), Price, Gross Margin 2014-2019 Figure Honeywell International Inc Production and Growth Rate Figure Honeywell International Inc Value ($) Market Share 2014-2019 Figure Honeywell International Inc Market Share of Butylated Hydroxyanisole (BHA) and Butylated Hydroxytoluene (BHT) Segmented by Region in 2018 Table Company Profiles Table Product Introduction Table Lanxess Production, Value ($), Price, Gross Margin 2014-2019 Figure Lanxess Production and Growth Rate Figure Lanxess Value ($) Market Share 2014-2019 Figure Lanxess Market Share of Butylated Hydroxyanisole (BHA) and Butylated Hydroxytoluene (BHT) Segmented by Region in 2018 Table Company Profiles Table Product Introduction Table Archer Daniels Midland Production, Value ($), Price, Gross Margin 2014-2019 Figure Archer Daniels Midland Production and Growth Rate Figure Archer Daniels Midland Value ($) Market Share 2014-2019 Figure Archer Daniels Midland Market Share of Butylated Hydroxyanisole (BHA) and Butylated Hydroxytoluene (BHT) Segmented by Region in 2018 Table Company Profiles Table Product Introduction Table Caldic Production, Value ($), Price, Gross Margin 2014-2019 Figure Caldic Production and Growth Rate Figure Caldic Value ($) Market Share 2014-2019 Figure Caldic Market Share of Butylated Hydroxyanisole (BHA) and Butylated Hydroxytoluene (BHT) Segmented by Region in 2018 Table Company Profiles Table Product Introduction Table Steris Applied Sterilization Technologies Production, Value ($), Price, Gross Margin 2014-2019 Figure Steris Applied Sterilization Technologies Production and Growth Rate Figure Steris Applied Sterilization Technologies Value ($) Market Share 2014-2019 Figure Steris Applied Sterilization Technologies Market Share of Butylated Hydroxyanisole (BHA) and Butylated Hydroxytoluene (BHT) Segmented by Region in 2018 Table Company Profiles Table Product Introduction Table Molekula Production, Value ($), Price, Gross Margin 2014-2019 Figure Molekula Production and Growth Rate Figure Molekula Value ($) Market Share 2014-2019 Figure Molekula Market Share of Butylated Hydroxyanisole (BHA) and Butylated Hydroxytoluene (BHT) Segmented by Region in 2018 Table Company Profiles Table Product Introduction Table Cargill Inc Production, Value ($), Price, Gross Margin 2014-2019 Figure Cargill Inc Production and Growth Rate Figure Cargill Inc Value ($) Market Share 2014-2019 Figure Cargill Inc Market Share of Butylated Hydroxyanisole (BHA) and Butylated Hydroxytoluene (BHT) Segmented by Region in 2018 Table Company Profiles Table Product Introduction Table Eastman Chemical Co. Production, Value ($), Price, Gross Margin 2014-2019 Figure Eastman Chemical Co. Production and Growth Rate Figure Eastman Chemical Co. Value ($) Market Share 2014-2019 Figure Eastman Chemical Co. Market Share of Butylated Hydroxyanisole (BHA) and Butylated Hydroxytoluene (BHT) Segmented by Region in 2018 Table Company Profiles Table Product Introduction Table Ball Corp Production, Value ($), Price, Gross Margin 2014-2019 Figure Ball Corp Production and Growth Rate Figure Ball Corp Value ($) Market Share 2014-2019 Figure Ball Corp Market Share of Butylated Hydroxyanisole (BHA) and Butylated Hydroxytoluene (BHT) Segmented by Region in 2018 Table Company Profiles Table Product Introduction Table Crown Holdings Inc Production, Value ($), Price, Gross Margin 2014-2019 Figure Crown Holdings Inc Production and Growth Rate Figure Crown Holdings Inc Value ($) Market Share 2014-2019 Figure Crown Holdings Inc Market Share of Butylated Hydroxyanisole (BHA) and Butylated Hydroxytoluene (BHT) Segmented by Region in 2018 Table Company Profiles Table Product Introduction Table Bemis Company Inc. Production, Value ($), Price, Gross Margin 2014-2019 Figure Bemis Company Inc. Production and Growth Rate Figure Bemis Company Inc. Value ($) Market Share 2014-2019 Figure Bemis Company Inc. Market Share of Butylated Hydroxyanisole (BHA) and Butylated Hydroxytoluene (BHT) Segmented by Region in 2018 Table Company Profiles Table Product Introduction Table Perstorp Group Production, Value ($), Price, Gross Margin 2014-2019 Figure Perstorp Group Production and Growth Rate Figure Perstorp Group Value ($) Market Share 2014-2019 Figure Perstorp Group Market Share of Butylated Hydroxyanisole (BHA) and Butylated Hydroxytoluene (BHT) Segmented by Region in 2018 Table Company Profiles Table Product Introduction Table Impextraco Production, Value ($), Price, Gross Margin 2014-2019 Figure Impextraco Production and Growth Rate Figure Impextraco Value ($) Market Share 2014-2019 Figure Impextraco Market Share of Butylated Hydroxyanisole (BHA) and Butylated Hydroxytoluene (BHT) Segmented by Region in 2018 Table Company Profiles Table Product Introduction Table Tetra Pak Production, Value ($), Price, Gross Margin 2014-2019 Figure Tetra Pak Production and Growth Rate Figure Tetra Pak Value ($) Market Share 2014-2019 Figure Tetra Pak Market Share of Butylated Hydroxyanisole (BHA) and Butylated Hydroxytoluene (BHT) Segmented by Region in 2018 Table Global Butylated Hydroxyanisole (BHA) and Butylated Hydroxytoluene (BHT) Market Value ($) Forecast, by Type Table Global Butylated Hydroxyanisole (BHA) and Butylated Hydroxytoluene (BHT) Market Volume Forecast, by Type Figure Global Butylated Hydroxyanisole (BHA) and Butylated Hydroxytoluene (BHT) Market Value ($) and Growth Rate Forecast of Butylated Hydroxytoluen (2019-2024) Figure Global Butylated Hydroxyanisole (BHA) and Butylated Hydroxytoluene (BHT) Market Volume and Growth Rate Forecast of Butylated Hydroxytoluen (2019-2024) Figure Global Butylated Hydroxyanisole (BHA) and Butylated Hydroxytoluene (BHT) Market Value ($) and Growth Rate Forecast of Butylated Hydroxyanisole (2019-2024) Figure Global Butylated Hydroxyanisole (BHA) and Butylated Hydroxytoluene (BHT) Market Volume and Growth Rate Forecast of Butylated Hydroxyanisole (2019-2024) Table Global Market Value ($) Forecast by Application (2019-2024) Table Global Market Volume Forecast by Application (2019-2024) Figure Global Butylated Hydroxyanisole (BHA) and Butylated Hydroxytoluene (BHT) Consumption and Growth Rate of Pharmaceutical (2014-2019) Figure Global Butylated Hydroxyanisole (BHA) and Butylated Hydroxytoluene (BHT) Consumption and Growth Rate of Oil & Gas (2014-2019) Figure Global Butylated Hydroxyanisole (BHA) and Butylated Hydroxytoluene (BHT) Consumption and Growth Rate of Rubber/Plastic Industry (2014-2019) Figure Global Butylated Hydroxyanisole (BHA) and Butylated Hydroxytoluene (BHT) Consumption and Growth Rate of Food Industry (2014-2019) Figure Global Butylated Hydroxyanisole (BHA) and Butylated Hydroxytoluene (BHT) Consumption and Growth Rate of Cosmetic (2014-2019) Figure Global Butylated Hydroxyanisole (BHA) and Butylated Hydroxytoluene (BHT) Consumption and Growth Rate of Others (2014-2019) Figure Market Value ($) and Growth Rate Forecast of Others (2019-2024) Figure Market Volume and Growth Rate Forecast of Others (2019-2024) Figure North America Market Value ($) and Growth Rate Forecast (2019-2024) Table North America Consumption and Growth Rate Forecast (2019-2024) Figure Europe Market Value ($) and Growth Rate Forecast (2019-2024) Table Europe Consumption and Growth Rate Forecast (2019-2024) Figure China Market Value ($) and Growth Rate Forecast (2019-2024) Table China Consumption and Growth Rate Forecast (2019-2024) Figure Japan Market Value ($) and Growth Rate Forecast (2019-2024) Table Japan Consumption and Growth Rate Forecast (2019-2024) Figure Middle East & Africa Market Value ($) and Growth Rate Forecast (2019-2024) Table Middle East & Africa Consumption and Growth Rate Forecast (2019-2024) Figure India Market Value ($) and Growth Rate Forecast (2019-2024) Table India Consumption and Growth Rate Forecast (2019-2024) Figure South America Market Value ($) and Growth Rate Forecast (2019-2024) Table South America Consumption and Growth Rate Forecast (2019-2024) Figure Industry Resource/Technology/Labor Importance Analysis Table New Entrants SWOT Analysis Table New Project Analysis of Investment Recovery
Inquiry For Buying
Butylated Hydroxyanisole (BHA) and Butylated Hydroxytoluene (BHT)
Request Sample
Butylated Hydroxyanisole (BHA) and Butylated Hydroxytoluene (BHT)