Communication Tower Market Size, Share, and Trends Analysis Report
CAGR :

| Market Size 2024 (Base Year) | USD 10.41 Billion |
| Market Size 2032 (Forecast Year) | USD 17.36 Billion |
| CAGR | 6.6% |
| Forecast Period | 2025 - 2032 |
| Historical Period | 2020 - 2024 |
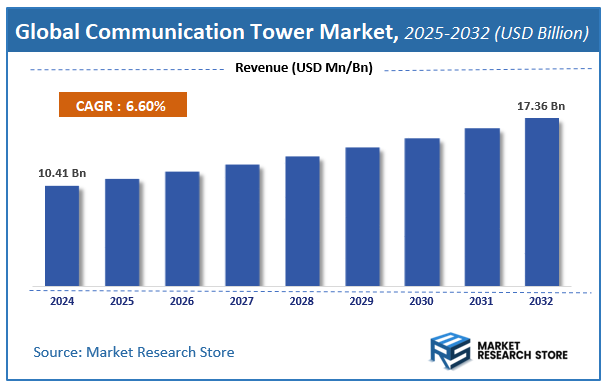
Market Research Store has published a report on the global communication tower market, estimating its value at USD 10.41 Billion in 2024, with projections indicating it will reach USD 17.36 Billion by the end of 2032. The market is expected to expand at a compound annual growth rate (CAGR) of around 6.6% over the forecast period. The report examines the factors driving market growth, the obstacles that could hinder this expansion, and the opportunities that may emerge in the communication tower industry. Additionally, it offers a detailed analysis of how these elements will affect demand dynamics and market performance throughout the forecast period.
To Get more Insights, Request a Free Sample
Communication Tower Market: Overview
The growth of the communication tower market is fueled by rising global demand across various industries and applications. The report highlights lucrative opportunities, analyzing cost structures, key segments, emerging trends, regional dynamics, and advancements by leading players to provide comprehensive market insights. The communication tower market report offers a detailed industry analysis from 2024 to 2032, combining quantitative and qualitative insights. It examines key factors such as pricing, market penetration, GDP impact, industry dynamics, major players, consumer behavior, and socio-economic conditions. Structured into multiple sections, the report provides a comprehensive perspective on the market from all angles.
Key sections of the communication tower market report include market segments, outlook, competitive landscape, and company profiles. Market Segments offer in-depth details based on Type, Application, Ownership, Installation, and other relevant classifications to support strategic marketing initiatives. Market Outlook thoroughly analyzes market trends, growth drivers, restraints, opportunities, challenges, Porter’s Five Forces framework, macroeconomic factors, value chain analysis, and pricing trends shaping the market now and in the future. The Competitive Landscape and Company Profiles section highlights major players, their strategies, and market positioning to guide investment and business decisions. The report also identifies innovation trends, new business opportunities, and investment prospects for the forecast period.
Key Highlights:
- As per the analysis shared by our research analyst, the global communication tower market is estimated to grow annually at a CAGR of around 6.6% over the forecast period (2025-2032).
- In terms of revenue, the global communication tower market size was valued at around USD 10.41 Billion in 2024 and is projected to reach USD 17.36 Billion by 2032.
- The market is projected to grow at a significant rate due to Growing deployment of telecom towers to support 4G and 5G networks, rising investments in rural connectivity, and increasing demand for energy-efficient and multi-tenant towers are fueling the Communication Tower market.
- Based on the Type, the Lattice Towers segment is growing at a high rate and will continue to dominate the global market as per industry projections.
- On the basis of Application, the Telecommunications segment is anticipated to command the largest market share.
- In terms of Ownership, the Operator-owned segment is projected to lead the global market.
- By Installation, the Rooftop segment is predicted to dominate the global market.
- Based on region, Asia Pacific is projected to dominate the global market during the forecast period.
Communication Tower Market: Report Scope
This report thoroughly analyzes the communication tower market, exploring its historical trends, current state, and future projections. The market estimates presented result from a robust research methodology, incorporating primary research, secondary sources, and expert opinions. These estimates are influenced by the prevailing market dynamics as well as key economic, social, and political factors. Furthermore, the report considers the impact of regulations, government expenditures, and advancements in research and development on the market. Both positive and negative shifts are evaluated to ensure a comprehensive and accurate market outlook.
| Report Attributes | Report Details |
|---|---|
| Report Name | Communication Tower Market |
| Market Size in 2024 | USD 10.41 Billion |
| Market Forecast in 2032 | USD 17.36 Billion |
| Growth Rate | CAGR of 6.6% |
| Number of Pages | 241 |
| Key Companies Covered | American Tower Corporation, Crown Castle International Corp., SBA Communications Corporation, China Tower Corporation Limited, Indus Towers Limited, Bharti Infratel Limited, Helios Towers Africa, IHS Towers, Phoenix Tower International, Cellnex Telecom, Vantage Towers |
| Segments Covered | By Type, By Application, By Ownership, By Installation, and By Region |
| Regions Covered | North America, Europe, Asia Pacific (APAC), Latin America, The Middle East and Africa (MEA) |
| Base Year | 2024 |
| Historical Year | 2020 to 2024 |
| Forecast Year | 2025 to 2032 |
| Customization Scope | Avail customized purchase options to meet your exact research needs. Request For Customization |
Communication Tower Market: Dynamics
Key Growth Drivers :
The Communication Tower market is experiencing robust growth, primarily driven by the exponential global demand for enhanced mobile broadband connectivity and the continuous rollout of next-generation wireless technologies. The widespread deployment of 5G networks, which require significantly more cell sites and denser tower infrastructure, is a major catalyst. Furthermore, the increasing adoption of IoT devices, cloud computing, and streaming services necessitates greater network capacity and coverage, directly fueling investment in new tower builds and co-location on existing structures. The rising subscriber base for mobile services, even in developed markets, coupled with the expansion into underserved rural and remote areas, further propels market expansion.
Restraints :
Despite the strong growth drivers, the Communication Tower market faces several significant restraints. Stringent and complex regulatory hurdles, including lengthy permitting processes, zoning restrictions, and aesthetic concerns from local communities, can significantly delay or prevent new tower construction. The high initial capital expenditure required for land acquisition, tower fabrication, and installation, particularly for large macro towers, can be a barrier. Intense competition among tower companies and network operators for prime locations can also lead to increased land lease costs. Furthermore, the increasing adoption of alternative network densification solutions, such as small cells, Distributed Antenna Systems (DAS), and even satellite-based solutions in certain areas, presents a competitive challenge to traditional tower models.
Opportunities :
Opportunities in the Communication Tower market are substantial, particularly in the rapid densification required for 5G, which necessitates a mix of traditional macro towers, smaller monopoles, and new street-level infrastructure. The increasing demand for tower infrastructure sharing and co-location services, where multiple operators deploy equipment on a single tower, offers a sustainable revenue model and optimizes resource utilization. Expanding into emerging markets with rapidly growing mobile subscriber bases and underdeveloped infrastructure presents significant greenfield opportunities. Furthermore, the integration of advanced technologies like edge computing, environmental sensors, and enhanced security features onto tower sites can create "smart" towers, adding new value propositions beyond basic connectivity.
Challenges :
The Communication Tower market confronts several challenges. Managing the escalating operational costs associated with power supply (especially in remote locations), security, and ongoing maintenance of a vast and geographically dispersed network of towers is a persistent hurdle. Ensuring the structural integrity and compliance of towers with evolving safety and environmental regulations, particularly in harsh weather conditions, requires continuous monitoring and investment. The complex negotiation and management of long-term land lease agreements with landlords, often involving varied terms and renewal cycles, can be administratively intensive. Additionally, adapting to the rapid pace of technological change in wireless communication, ensuring towers can support new antenna types and higher power requirements, necessitates continuous planning and upgrades.
Communication Tower Market: Segmentation Insights
The global communication tower market is segmented based on Type, Application, Ownership, Installation, and Region. All the segments of the communication tower market have been analyzed based on present & future trends and the market is estimated from 2024 to 2032.
Based on Type, the global communication tower market is divided into Lattice Towers, Guyed Towers, Monopole Towers, Stealth Towers.
On the basis of Application, the global communication tower market is bifurcated into Telecommunications, Broadcasting, Military, Others.
In terms of Ownership, the global communication tower market is categorized into Operator-owned, Joint Venture, Private.
Based on Installation, the global communication tower market is split into Rooftop, Ground-based.
Communication Tower Market: Regional Insights
The Asia-Pacific (APAC) region is the undisputed leader in the global communication tower market. This dominance is fueled by massive, ongoing investments in 4G network expansion and the rapid rollout of 5G infrastructure, particularly in high-growth countries like India and China. The region's vast geography, enormous population, and strong governmental push for digital connectivity drive unparalleled demand for new tower construction and site sharing, making APAC the largest and fastest-growing market globally.
Communication Tower Market: Competitive Landscape
The communication tower market report offers a thorough analysis of both established and emerging players within the market. It includes a detailed list of key companies, categorized based on the types of products they offer and other relevant factors. The report also highlights the market entry year for each player, providing further context for the research analysis.
The "Global Communication Tower Market" study offers valuable insights, focusing on the global market landscape, with an emphasis on major industry players such as;
- American Tower Corporation
- Crown Castle International Corp.
- SBA Communications Corporation
- China Tower Corporation Limited
- Indus Towers Limited
- Bharti Infratel Limited
- Helios Towers Africa
- IHS Towers
- Phoenix Tower International
- Cellnex Telecom
- Vantage Towers
The Global Communication Tower Market is Segmented as Follows:
By Type
- Lattice Towers
- Guyed Towers
- Monopole Towers
- Stealth Towers
By Application
- Telecommunications
- Broadcasting
- Military
- Others
By Ownership
- Operator-owned
- Joint Venture
- Private
By Installation
- Rooftop
- Ground-based
By Region
- North America
- The U.S.
- Canada
- Mexico
- Europe
- France
- The UK
- Spain
- Germany
- Italy
- Rest of Europe
- Asia Pacific
- China
- Japan
- India
- Australia
- South Korea
- Rest of Asia Pacific
- The Middle East & Africa
- Saudi Arabia
- UAE
- Egypt
- Kuwait
- South Africa
- Rest of the Middle East & Africa
- Latin America
- Brazil
- Argentina
- Rest of Latin America
Frequently Asked Questions
Table Of Content
List of Tables and Figures Figure Product Picture of Communication Tower Table Product Specification of Communication Tower Figure Market Concentration Ratio and Market Maturity Analysis of Communication Tower Figure Global Communication Tower Value ($) and Growth Rate from 2014-2024 Table Different Types of Communication Tower Figure Global Communication Tower Value ($) Segment by Type from 2014-2019 Figure Cable Tower Picture Figure Self-supporting Structures Picture Table Different Applications of Communication Tower Figure Global Communication Tower Value ($) Segment by Applications from 2014-2019 Figure Telecommunication Industry Picture Figure Military Picture Figure Industrial Manufacturing Picture Table Research Regions of Communication Tower Figure North America Communication Tower Production Value ($) and Growth Rate (2014-2019) Figure Europe Communication Tower Production Value ($) and Growth Rate (2014-2019) Table China Communication Tower Production Value ($) and Growth Rate (2014-2019) Table Japan Communication Tower Production Value ($) and Growth Rate (2014-2019) Table Middle East & Africa Communication Tower Production Value ($) and Growth Rate (2014-2019) Table India Communication Tower Production Value ($) and Growth Rate (2014-2019) Table South America Communication Tower Production Value ($) and Growth Rate (2014-2019) Table Emerging Countries of Communication Tower Table Growing Market of Communication Tower Figure Industry Chain Analysis of Communication Tower Table Upstream Raw Material Suppliers of Communication Tower with Contact Information Table Major Players Manufacturing Base and Market Share ($) of Communication Tower in 2018 Table Major Players Communication Tower Product Types in 2018 Figure Production Process of Communication Tower Figure Manufacturing Cost Structure of Communication Tower Figure Channel Status of Communication Tower Table Major Distributors of Communication Tower with Contact Information Table Major Downstream Buyers of Communication Tower with Contact Information Table Global Communication Tower Value ($) by Type (2014-2019) Table Global Communication Tower Value ($) Share by Type (2014-2019) Figure Global Communication Tower Value ($) Share by Type (2014-2019) Table Global Communication Tower Production by Type (2014-2019) Table Global Communication Tower Production Share by Type (2014-2019) Figure Global Communication Tower Production Share by Type (2014-2019) Figure Global Communication Tower Value ($) and Growth Rate of Cable Tower Figure Global Communication Tower Value ($) and Growth Rate of Self-supporting Structures Figure Global Communication Tower Price by Type (2014-2019) Table Global Communication Tower Consumption by Application (2014-2019) Table Global Communication Tower Consumption Market Share by Application (2014-2019) Figure Global Communication Tower Consumption Market Share by Application (2014-2019) Table Downstream Buyers Introduction by Application Figure Global Communication Tower Consumption and Growth Rate of Telecommunication Industry (2014-2019) Figure Global Communication Tower Consumption and Growth Rate of Military (2014-2019) Figure Global Communication Tower Consumption and Growth Rate of Industrial Manufacturing (2014-2019) Table Global Communication Tower Value ($) by Region (2014-2019) Table Global Communication Tower Value ($) Market Share by Region (2014-2019) Figure Global Communication Tower Value ($) Market Share by Region (2014-2019) Table Global Communication Tower Production by Region (2014-2019) Table Global Communication Tower Production Market Share by Region (2014-2019) Figure Global Communication Tower Production Market Share by Region (2014-2019) Table Global Communication Tower Production, Value ($), Price and Gross Margin (2014-2019) Table North America Communication Tower Production, Value ($), Price and Gross Margin (2014-2019) Table Europe Communication Tower Production, Value ($), Price and Gross Margin (2014-2019) Table China Communication Tower Production, Value ($), Price and Gross Margin (2014-2019) Table Japan Communication Tower Production, Value ($), Price and Gross Margin (2014-2019) Table Middle East & Africa Communication Tower Production, Value ($), Price and Gross Margin (2014-2019) Table India Communication Tower Production, Value ($), Price and Gross Margin (2014-2019) Table South America Communication Tower Production, Value ($), Price and Gross Margin (2014-2019) Table Global Communication Tower Consumption by Regions (2014-2019) Figure Global Communication Tower Consumption Share by Regions (2014-2019) Table North America Communication Tower Production, Consumption, Export, Import (2014-2019) Table Europe Communication Tower Production, Consumption, Export, Import (2014-2019) Table China Communication Tower Production, Consumption, Export, Import (2014-2019) Table Japan Communication Tower Production, Consumption, Export, Import (2014-2019) Table Middle East & Africa Communication Tower Production, Consumption, Export, Import (2014-2019) Table India Communication Tower Production, Consumption, Export, Import (2014-2019) Table South America Communication Tower Production, Consumption, Export, Import (2014-2019) Figure North America Communication Tower Production and Growth Rate Analysis Figure North America Communication Tower Consumption and Growth Rate Analysis Figure North America Communication Tower SWOT Analysis Figure Europe Communication Tower Production and Growth Rate Analysis Figure Europe Communication Tower Consumption and Growth Rate Analysis Figure Europe Communication Tower SWOT Analysis Figure China Communication Tower Production and Growth Rate Analysis Figure China Communication Tower Consumption and Growth Rate Analysis Figure China Communication Tower SWOT Analysis Figure Japan Communication Tower Production and Growth Rate Analysis Figure Japan Communication Tower Consumption and Growth Rate Analysis Figure Japan Communication Tower SWOT Analysis Figure Middle East & Africa Communication Tower Production and Growth Rate Analysis Figure Middle East & Africa Communication Tower Consumption and Growth Rate Analysis Figure Middle East & Africa Communication Tower SWOT Analysis Figure India Communication Tower Production and Growth Rate Analysis Figure India Communication Tower Consumption and Growth Rate Analysis Figure India Communication Tower SWOT Analysis Figure South America Communication Tower Production and Growth Rate Analysis Figure South America Communication Tower Consumption and Growth Rate Analysis Figure South America Communication Tower SWOT Analysis Figure Top 3 Market Share of Communication Tower Companies Figure Top 6 Market Share of Communication Tower Companies Table Mergers, Acquisitions and Expansion Analysis Table Company Profiles Table Product Introduction Table United States Cellular Co. Production, Value ($), Price, Gross Margin 2014-2019 Figure United States Cellular Co. Production and Growth Rate Figure United States Cellular Co. Value ($) Market Share 2014-2019 Figure United States Cellular Co. Market Share of Communication Tower Segmented by Region in 2018 Table Company Profiles Table Product Introduction Table Kemrock Production, Value ($), Price, Gross Margin 2014-2019 Figure Kemrock Production and Growth Rate Figure Kemrock Value ($) Market Share 2014-2019 Figure Kemrock Market Share of Communication Tower Segmented by Region in 2018 Table Company Profiles Table Product Introduction Table SBA Communications Production, Value ($), Price, Gross Margin 2014-2019 Figure SBA Communications Production and Growth Rate Figure SBA Communications Value ($) Market Share 2014-2019 Figure SBA Communications Market Share of Communication Tower Segmented by Region in 2018 Table Company Profiles Table Product Introduction Table American Tower Production, Value ($), Price, Gross Margin 2014-2019 Figure American Tower Production and Growth Rate Figure American Tower Value ($) Market Share 2014-2019 Figure American Tower Market Share of Communication Tower Segmented by Region in 2018 Table Company Profiles Table Product Introduction Table WADE Antenna Production, Value ($), Price, Gross Margin 2014-2019 Figure WADE Antenna Production and Growth Rate Figure WADE Antenna Value ($) Market Share 2014-2019 Figure WADE Antenna Market Share of Communication Tower Segmented by Region in 2018 Table Company Profiles Table Product Introduction Table Vertical Bridge Production, Value ($), Price, Gross Margin 2014-2019 Figure Vertical Bridge Production and Growth Rate Figure Vertical Bridge Value ($) Market Share 2014-2019 Figure Vertical Bridge Market Share of Communication Tower Segmented by Region in 2018 Table Company Profiles Table Product Introduction Table China Mobile Communications Group Co.,Ltd. Production, Value ($), Price, Gross Margin 2014-2019 Figure China Mobile Communications Group Co.,Ltd. Production and Growth Rate Figure China Mobile Communications Group Co.,Ltd. Value ($) Market Share 2014-2019 Figure China Mobile Communications Group Co.,Ltd. Market Share of Communication Tower Segmented by Region in 2018 Table Company Profiles Table Product Introduction Table CNC Machines Production, Value ($), Price, Gross Margin 2014-2019 Figure CNC Machines Production and Growth Rate Figure CNC Machines Value ($) Market Share 2014-2019 Figure CNC Machines Market Share of Communication Tower Segmented by Region in 2018 Table Company Profiles Table Product Introduction Table Rohn Products LLC Production, Value ($), Price, Gross Margin 2014-2019 Figure Rohn Products LLC Production and Growth Rate Figure Rohn Products LLC Value ($) Market Share 2014-2019 Figure Rohn Products LLC Market Share of Communication Tower Segmented by Region in 2018 Table Company Profiles Table Product Introduction Table China Telecom Production, Value ($), Price, Gross Margin 2014-2019 Figure China Telecom Production and Growth Rate Figure China Telecom Value ($) Market Share 2014-2019 Figure China Telecom Market Share of Communication Tower Segmented by Region in 2018 Table Company Profiles Table Product Introduction Table Alstom Production, Value ($), Price, Gross Margin 2014-2019 Figure Alstom Production and Growth Rate Figure Alstom Value ($) Market Share 2014-2019 Figure Alstom Market Share of Communication Tower Segmented by Region in 2018 Table Company Profiles Table Product Introduction Table Power Grid Corporation of India Limited Production, Value ($), Price, Gross Margin 2014-2019 Figure Power Grid Corporation of India Limited Production and Growth Rate Figure Power Grid Corporation of India Limited Value ($) Market Share 2014-2019 Figure Power Grid Corporation of India Limited Market Share of Communication Tower Segmented by Region in 2018 Table Company Profiles Table Product Introduction Table BS Group Production, Value ($), Price, Gross Margin 2014-2019 Figure BS Group Production and Growth Rate Figure BS Group Value ($) Market Share 2014-2019 Figure BS Group Market Share of Communication Tower Segmented by Region in 2018 Table Company Profiles Table Product Introduction Table Karamtara Production, Value ($), Price, Gross Margin 2014-2019 Figure Karamtara Production and Growth Rate Figure Karamtara Value ($) Market Share 2014-2019 Figure Karamtara Market Share of Communication Tower Segmented by Region in 2018 Table Company Profiles Table Product Introduction Table Insite Towers Production, Value ($), Price, Gross Margin 2014-2019 Figure Insite Towers Production and Growth Rate Figure Insite Towers Value ($) Market Share 2014-2019 Figure Insite Towers Market Share of Communication Tower Segmented by Region in 2018 Table Global Communication Tower Market Value ($) Forecast, by Type Table Global Communication Tower Market Volume Forecast, by Type Figure Global Communication Tower Market Value ($) and Growth Rate Forecast of Cable Tower (2019-2024) Figure Global Communication Tower Market Volume and Growth Rate Forecast of Cable Tower (2019-2024) Figure Global Communication Tower Market Value ($) and Growth Rate Forecast of Self-supporting Structures (2019-2024) Figure Global Communication Tower Market Volume and Growth Rate Forecast of Self-supporting Structures (2019-2024) Table Global Market Value ($) Forecast by Application (2019-2024) Table Global Market Volume Forecast by Application (2019-2024) Figure Global Communication Tower Consumption and Growth Rate of Telecommunication Industry (2014-2019) Figure Global Communication Tower Consumption and Growth Rate of Military (2014-2019) Figure Global Communication Tower Consumption and Growth Rate of Industrial Manufacturing (2014-2019) Figure Market Value ($) and Growth Rate Forecast of Industrial Manufacturing (2019-2024) Figure Market Volume and Growth Rate Forecast of Industrial Manufacturing (2019-2024) Figure North America Market Value ($) and Growth Rate Forecast (2019-2024) Table North America Consumption and Growth Rate Forecast (2019-2024) Figure Europe Market Value ($) and Growth Rate Forecast (2019-2024) Table Europe Consumption and Growth Rate Forecast (2019-2024) Figure China Market Value ($) and Growth Rate Forecast (2019-2024) Table China Consumption and Growth Rate Forecast (2019-2024) Figure Japan Market Value ($) and Growth Rate Forecast (2019-2024) Table Japan Consumption and Growth Rate Forecast (2019-2024) Figure Middle East & Africa Market Value ($) and Growth Rate Forecast (2019-2024) Table Middle East & Africa Consumption and Growth Rate Forecast (2019-2024) Figure India Market Value ($) and Growth Rate Forecast (2019-2024) Table India Consumption and Growth Rate Forecast (2019-2024) Figure South America Market Value ($) and Growth Rate Forecast (2019-2024) Table South America Consumption and Growth Rate Forecast (2019-2024) Figure Industry Resource/Technology/Labor Importance Analysis Table New Entrants SWOT Analysis Table New Project Analysis of Investment Recovery
Inquiry For Buying
Communication Tower
Request Sample
Communication Tower