Cricket Market Size, Share, and Trends Analysis Report
CAGR :

| Market Size 2024 (Base Year) | USD 630.04 Million |
| Market Size 2032 (Forecast Year) | USD 984.65 Million |
| CAGR | 5.74% |
| Forecast Period | 2025 - 2032 |
| Historical Period | 2020 - 2024 |
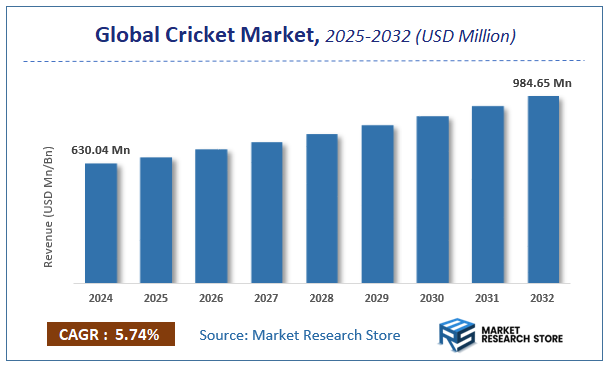
Market Research Store has published a report on the global cricket market, estimating its value at USD 630.04 Million in 2024, with projections indicating it will reach USD 984.65 Million by the end of 2032. The market is expected to expand at a compound annual growth rate (CAGR) of around 5.74% over the forecast period. The report examines the factors driving market growth, the obstacles that could hinder this expansion, and the opportunities that may emerge in the cricket industry. Additionally, it offers a detailed analysis of how these elements will affect demand dynamics and market performance throughout the forecast period.
To Get more Insights, Request a Free Sample
Cricket Market: Overview
The growth of the cricket market is fueled by rising global demand across various industries and applications. The report highlights lucrative opportunities, analyzing cost structures, key segments, emerging trends, regional dynamics, and advancements by leading players to provide comprehensive market insights. The cricket market report offers a detailed industry analysis from 2024 to 2032, combining quantitative and qualitative insights. It examines key factors such as pricing, market penetration, GDP impact, industry dynamics, major players, consumer behavior, and socio-economic conditions. Structured into multiple sections, the report provides a comprehensive perspective on the market from all angles.
Key sections of the cricket market report include market segments, outlook, competitive landscape, and company profiles. Market Segments offer in-depth details based on Demographic, Psychographic, Behavioral, Technology Adoption, and other relevant classifications to support strategic marketing initiatives. Market Outlook thoroughly analyzes market trends, growth drivers, restraints, opportunities, challenges, Porter’s Five Forces framework, macroeconomic factors, value chain analysis, and pricing trends shaping the market now and in the future. The Competitive Landscape and Company Profiles section highlights major players, their strategies, and market positioning to guide investment and business decisions. The report also identifies innovation trends, new business opportunities, and investment prospects for the forecast period.
Key Highlights:
- As per the analysis shared by our research analyst, the global cricket market is estimated to grow annually at a CAGR of around 5.74% over the forecast period (2025-2032).
- In terms of revenue, the global cricket market size was valued at around USD 630.04 Million in 2024 and is projected to reach USD 984.65 Million by 2032.
- The market is projected to grow at a significant rate due to Increasing popularity of cricket globally, growing investments in sports infrastructure, and rising engagement through leagues and tournaments are driving the Cricket market.
- Based on the Demographic, the Age Groups segment is growing at a high rate and will continue to dominate the global market as per industry projections.
- On the basis of Psychographic, the Lifestyle segment is anticipated to command the largest market share.
- In terms of Behavioral, the Purchase Behavior segment is projected to lead the global market.
- By Technology Adoption, the Device Usage segment is predicted to dominate the global market.
- Based on region, Asia-Pacific is projected to dominate the global market during the forecast period.
Cricket Market: Report Scope
This report thoroughly analyzes the cricket market, exploring its historical trends, current state, and future projections. The market estimates presented result from a robust research methodology, incorporating primary research, secondary sources, and expert opinions. These estimates are influenced by the prevailing market dynamics as well as key economic, social, and political factors. Furthermore, the report considers the impact of regulations, government expenditures, and advancements in research and development on the market. Both positive and negative shifts are evaluated to ensure a comprehensive and accurate market outlook.
| Report Attributes | Report Details |
|---|---|
| Report Name | Cricket Market |
| Market Size in 2024 | USD 630.04 Million |
| Market Forecast in 2032 | USD 984.65 Million |
| Growth Rate | CAGR of 5.74% |
| Number of Pages | 241 |
| Key Companies Covered | Gray Nicholls, Kookaburra, Slazenger, Sanspareils Greenlands, Puma, New Balance, Nike, Gunn & Moore, Woodworm, CA Sports, Adidas, British Cricket Balls, Sareen Sports Industries, Kippax, B.D. Mahajan and Sons (BDM), F.C.SONDHI |
| Segments Covered | By Demographic, By Psychographic, By Behavioral, By Technology Adoption, and By Region |
| Regions Covered | North America, Europe, Asia Pacific (APAC), Latin America, The Middle East and Africa (MEA) |
| Base Year | 2024 |
| Historical Year | 2020 to 2024 |
| Forecast Year | 2025 to 2032 |
| Customization Scope | Avail customized purchase options to meet your exact research needs. Request For Customization |
Cricket Market: Dynamics
Key Growth Drivers :
The cricket market is flourishing, primarily fueled by the immense popularity of the sport, especially in South Asia, Australia, and the UK. A major driver is the proliferation of professional T20 leagues like the Indian Premier League (IPL), Big Bash League (BBL), and The Hundred. These leagues have not only commercialized the sport on a massive scale but have also introduced a faster, more entertaining format that appeals to a wider, younger audience. This has led to a boom in media rights, sponsorships, and merchandise sales. Furthermore, technological advancements, such as the Decision Review System (DRS), real-time player analytics, and high-quality broadcasting, have significantly enhanced the viewer experience, boosting fan engagement. The growth of women's cricket and the increasing investment in grassroots and youth development programs are also crucial factors, broadening the talent pool and fan base. The rise of fantasy sports and e-sports related to cricket has also created new revenue streams and interactive platforms for fans.
Restraints :
Despite its growth, the cricket market faces significant restraints. A major issue is the high cost of quality equipment, particularly for premium bats and protective gear made from materials like English willow. This can be a barrier to entry for aspiring players in developing nations or those with limited disposable income, hindering grassroots participation. Furthermore, cricket is largely concentrated in a handful of countries, which limits its global reach compared to sports like football or basketball. The sport's complex rules and the long duration of traditional formats like Test matches can be intimidating for new audiences, especially in non-traditional cricket-playing regions. Other challenges include the lack of robust infrastructure in many emerging markets and intense competition for media attention and sponsorships from other popular sports.
Opportunities :
The cricket market is ripe with opportunities for expansion and innovation. The adoption of the sport in non-traditional markets like the USA and parts of Europe, driven by immigrant communities and the launch of new leagues like Major League Cricket, presents a significant growth avenue. The digital landscape offers vast opportunities, including live streaming on OTT platforms, which makes the sport more accessible to a global audience, and the use of social media for direct fan engagement and content marketing. The rise of women's cricket is a major opportunity, as it opens up new markets for sponsorships, viewership, and merchandise, and inspires a new generation of players. Moreover, there is an increasing demand for specialized, technologically advanced equipment, such as smart bats with embedded sensors, which can provide real-time analytics to players and coaches, creating a new, premium product segment.
Challenges :
The cricket market faces several challenges that can impact its sustainability and growth. One key challenge is the workload and fitness management of elite players who participate in all three formats of the game—Test, ODI, and T20—as well as multiple domestic leagues. This can lead to player burnout and injuries, affecting the quality of the game and star player availability. Financial mismanagement and non-payment issues, particularly in smaller leagues, can also erode trust and damage the sport's reputation. Another significant challenge is maintaining the relevance of traditional formats like Test cricket in a world that is increasingly embracing shorter, faster-paced entertainment. The industry also needs to address supply chain disruptions and the rising costs of raw materials for equipment, which can impact profitability and affordability. Lastly, with the increasing commercialization, there is a constant challenge to balance the financial interests of various stakeholders, from cricket boards to players and franchises, to ensure the long-term health of the sport.
Cricket Market: Segmentation Insights
The global cricket market is segmented based on Demographic, Psychographic, Behavioral, Technology Adoption, and Region. All the segments of the cricket market have been analyzed based on present & future trends and the market is estimated from 2024 to 2032.
Based on Demographic, the global cricket market is divided into Age Groups, Gender, Income Levels.
On the basis of Psychographic, the global cricket market is bifurcated into Lifestyle, Values and Beliefs, Interests.
In terms of Behavioral, the global cricket market is categorized into Purchase Behavior, Usage Rate, Brand Loyalty.
Based on Technology Adoption, the global cricket market is split into Device Usage, Media Consumption, Engagement Style.
Cricket Market: Regional Insights
The Asia-Pacific region, led overwhelmingly by India, is the dominant force in the global cricket market. This dominance encompasses media rights, sponsorship, merchandise, and fan engagement, driven by the Indian Premier League (IPL), which is the world's most valuable cricket league.
The region's massive, cricket-passionate population in countries like India, Pakistan, and Australia creates an unparalleled commercial ecosystem. While the United Kingdom remains a key traditional market, the Asia-Pacific region commands the largest market share, generating well over 70% of the sport's global commercial revenue.
Cricket Market: Competitive Landscape
The cricket market report offers a thorough analysis of both established and emerging players within the market. It includes a detailed list of key companies, categorized based on the types of products they offer and other relevant factors. The report also highlights the market entry year for each player, providing further context for the research analysis.
The "Global Cricket Market" study offers valuable insights, focusing on the global market landscape, with an emphasis on major industry players such as;
- Gray Nicholls
- Kookaburra
- Slazenger
- Sanspareils Greenlands
- Puma
- New Balance
- Nike
- Gunn & Moore
- Woodworm
- CA Sports
- Adidas
- British Cricket Balls
- Sareen Sports Industries
- Kippax
- B.D. Mahajan and Sons (BDM)
- F.C.SONDHI
The Global Cricket Market is Segmented as Follows:
By Demographic
- Age Groups
- Gender
- Income Levels
By Psychographic
- Lifestyle
- Values and Beliefs
- Interests
By Behavioral
- Purchase Behavior
- Usage Rate
- Brand Loyalty
By Technology Adoption
- Device Usage
- Media Consumption
- Engagement Style
By Region
- North America
- The U.S.
- Canada
- Mexico
- Europe
- France
- The UK
- Spain
- Germany
- Italy
- Rest of Europe
- Asia Pacific
- China
- Japan
- India
- Australia
- South Korea
- Rest of Asia Pacific
- The Middle East & Africa
- Saudi Arabia
- UAE
- Egypt
- Kuwait
- South Africa
- Rest of the Middle East & Africa
- Latin America
- Brazil
- Argentina
- Rest of Latin America
Frequently Asked Questions
Table Of Content
List of Tables and Figures Figure Product Picture of Cricket Table Product Specification of Cricket Figure Market Concentration Ratio and Market Maturity Analysis of Cricket Figure Global Cricket Value ($) and Growth Rate from 2014-2024 Table Different Types of Cricket Figure Global Cricket Value ($) Segment by Type from 2014-2019 Figure Cricket Bats Picture Figure Cricket Balls Picture Figure Cricket Protective Gear Picture Table Different Applications of Cricket Figure Global Cricket Value ($) Segment by Applications from 2014-2019 Figure Cricket Match Picture Figure Training Picture Figure Entertainment Picture Table Research Regions of Cricket Figure North America Cricket Production Value ($) and Growth Rate (2014-2019) Figure Europe Cricket Production Value ($) and Growth Rate (2014-2019) Table China Cricket Production Value ($) and Growth Rate (2014-2019) Table Japan Cricket Production Value ($) and Growth Rate (2014-2019) Table Middle East & Africa Cricket Production Value ($) and Growth Rate (2014-2019) Table India Cricket Production Value ($) and Growth Rate (2014-2019) Table South America Cricket Production Value ($) and Growth Rate (2014-2019) Table Emerging Countries of Cricket Table Growing Market of Cricket Figure Industry Chain Analysis of Cricket Table Upstream Raw Material Suppliers of Cricket with Contact Information Table Major Players Manufacturing Base and Market Share ($) of Cricket in 2018 Table Major Players Cricket Product Types in 2018 Figure Production Process of Cricket Figure Manufacturing Cost Structure of Cricket Figure Channel Status of Cricket Table Major Distributors of Cricket with Contact Information Table Major Downstream Buyers of Cricket with Contact Information Table Global Cricket Value ($) by Type (2014-2019) Table Global Cricket Value ($) Share by Type (2014-2019) Figure Global Cricket Value ($) Share by Type (2014-2019) Table Global Cricket Production by Type (2014-2019) Table Global Cricket Production Share by Type (2014-2019) Figure Global Cricket Production Share by Type (2014-2019) Figure Global Cricket Value ($) and Growth Rate of Cricket Bats Figure Global Cricket Value ($) and Growth Rate of Cricket Balls Figure Global Cricket Value ($) and Growth Rate of Cricket Protective Gear Figure Global Cricket Price by Type (2014-2019) Table Global Cricket Consumption by Application (2014-2019) Table Global Cricket Consumption Market Share by Application (2014-2019) Figure Global Cricket Consumption Market Share by Application (2014-2019) Table Downstream Buyers Introduction by Application Figure Global Cricket Consumption and Growth Rate of Cricket Match (2014-2019) Figure Global Cricket Consumption and Growth Rate of Training (2014-2019) Figure Global Cricket Consumption and Growth Rate of Entertainment (2014-2019) Table Global Cricket Value ($) by Region (2014-2019) Table Global Cricket Value ($) Market Share by Region (2014-2019) Figure Global Cricket Value ($) Market Share by Region (2014-2019) Table Global Cricket Production by Region (2014-2019) Table Global Cricket Production Market Share by Region (2014-2019) Figure Global Cricket Production Market Share by Region (2014-2019) Table Global Cricket Production, Value ($), Price and Gross Margin (2014-2019) Table North America Cricket Production, Value ($), Price and Gross Margin (2014-2019) Table Europe Cricket Production, Value ($), Price and Gross Margin (2014-2019) Table China Cricket Production, Value ($), Price and Gross Margin (2014-2019) Table Japan Cricket Production, Value ($), Price and Gross Margin (2014-2019) Table Middle East & Africa Cricket Production, Value ($), Price and Gross Margin (2014-2019) Table India Cricket Production, Value ($), Price and Gross Margin (2014-2019) Table South America Cricket Production, Value ($), Price and Gross Margin (2014-2019) Table Global Cricket Consumption by Regions (2014-2019) Figure Global Cricket Consumption Share by Regions (2014-2019) Table North America Cricket Production, Consumption, Export, Import (2014-2019) Table Europe Cricket Production, Consumption, Export, Import (2014-2019) Table China Cricket Production, Consumption, Export, Import (2014-2019) Table Japan Cricket Production, Consumption, Export, Import (2014-2019) Table Middle East & Africa Cricket Production, Consumption, Export, Import (2014-2019) Table India Cricket Production, Consumption, Export, Import (2014-2019) Table South America Cricket Production, Consumption, Export, Import (2014-2019) Figure North America Cricket Production and Growth Rate Analysis Figure North America Cricket Consumption and Growth Rate Analysis Figure North America Cricket SWOT Analysis Figure Europe Cricket Production and Growth Rate Analysis Figure Europe Cricket Consumption and Growth Rate Analysis Figure Europe Cricket SWOT Analysis Figure China Cricket Production and Growth Rate Analysis Figure China Cricket Consumption and Growth Rate Analysis Figure China Cricket SWOT Analysis Figure Japan Cricket Production and Growth Rate Analysis Figure Japan Cricket Consumption and Growth Rate Analysis Figure Japan Cricket SWOT Analysis Figure Middle East & Africa Cricket Production and Growth Rate Analysis Figure Middle East & Africa Cricket Consumption and Growth Rate Analysis Figure Middle East & Africa Cricket SWOT Analysis Figure India Cricket Production and Growth Rate Analysis Figure India Cricket Consumption and Growth Rate Analysis Figure India Cricket SWOT Analysis Figure South America Cricket Production and Growth Rate Analysis Figure South America Cricket Consumption and Growth Rate Analysis Figure South America Cricket SWOT Analysis Figure Top 3 Market Share of Cricket Companies Figure Top 6 Market Share of Cricket Companies Table Mergers, Acquisitions and Expansion Analysis Table Company Profiles Table Product Introduction Table Kippax Willow Production, Value ($), Price, Gross Margin 2014-2019 Figure Kippax Willow Production and Growth Rate Figure Kippax Willow Value ($) Market Share 2014-2019 Figure Kippax Willow Market Share of Cricket Segmented by Region in 2018 Table Company Profiles Table Product Introduction Table Sanspareils Greenlands Production, Value ($), Price, Gross Margin 2014-2019 Figure Sanspareils Greenlands Production and Growth Rate Figure Sanspareils Greenlands Value ($) Market Share 2014-2019 Figure Sanspareils Greenlands Market Share of Cricket Segmented by Region in 2018 Table Company Profiles Table Product Introduction Table Gunn & Moore Production, Value ($), Price, Gross Margin 2014-2019 Figure Gunn & Moore Production and Growth Rate Figure Gunn & Moore Value ($) Market Share 2014-2019 Figure Gunn & Moore Market Share of Cricket Segmented by Region in 2018 Table Company Profiles Table Product Introduction Table Spartan Sports Production, Value ($), Price, Gross Margin 2014-2019 Figure Spartan Sports Production and Growth Rate Figure Spartan Sports Value ($) Market Share 2014-2019 Figure Spartan Sports Market Share of Cricket Segmented by Region in 2018 Table Company Profiles Table Product Introduction Table Callen Cricket Production, Value ($), Price, Gross Margin 2014-2019 Figure Callen Cricket Production and Growth Rate Figure Callen Cricket Value ($) Market Share 2014-2019 Figure Callen Cricket Market Share of Cricket Segmented by Region in 2018 Table Company Profiles Table Product Introduction Table BD Mahajan & Sons Private Limited Production, Value ($), Price, Gross Margin 2014-2019 Figure BD Mahajan & Sons Private Limited Production and Growth Rate Figure BD Mahajan & Sons Private Limited Value ($) Market Share 2014-2019 Figure BD Mahajan & Sons Private Limited Market Share of Cricket Segmented by Region in 2018 Table Company Profiles Table Product Introduction Table Sareen Sports Industries(SS) Production, Value ($), Price, Gross Margin 2014-2019 Figure Sareen Sports Industries(SS) Production and Growth Rate Figure Sareen Sports Industries(SS) Value ($) Market Share 2014-2019 Figure Sareen Sports Industries(SS) Market Share of Cricket Segmented by Region in 2018 Table Company Profiles Table Product Introduction Table MRF SPORTS GOOD Production, Value ($), Price, Gross Margin 2014-2019 Figure MRF SPORTS GOOD Production and Growth Rate Figure MRF SPORTS GOOD Value ($) Market Share 2014-2019 Figure MRF SPORTS GOOD Market Share of Cricket Segmented by Region in 2018 Table Company Profiles Table Product Introduction Table PUMA Production, Value ($), Price, Gross Margin 2014-2019 Figure PUMA Production and Growth Rate Figure PUMA Value ($) Market Share 2014-2019 Figure PUMA Market Share of Cricket Segmented by Region in 2018 Table Company Profiles Table Product Introduction Table British Cricket Balls Production, Value ($), Price, Gross Margin 2014-2019 Figure British Cricket Balls Production and Growth Rate Figure British Cricket Balls Value ($) Market Share 2014-2019 Figure British Cricket Balls Market Share of Cricket Segmented by Region in 2018 Table Company Profiles Table Product Introduction Table Nike Production, Value ($), Price, Gross Margin 2014-2019 Figure Nike Production and Growth Rate Figure Nike Value ($) Market Share 2014-2019 Figure Nike Market Share of Cricket Segmented by Region in 2018 Table Company Profiles Table Product Introduction Table Adidas Production, Value ($), Price, Gross Margin 2014-2019 Figure Adidas Production and Growth Rate Figure Adidas Value ($) Market Share 2014-2019 Figure Adidas Market Share of Cricket Segmented by Region in 2018 Table Company Profiles Table Product Introduction Table Slazenger DHI Production, Value ($), Price, Gross Margin 2014-2019 Figure Slazenger DHI Production and Growth Rate Figure Slazenger DHI Value ($) Market Share 2014-2019 Figure Slazenger DHI Market Share of Cricket Segmented by Region in 2018 Table Company Profiles Table Product Introduction Table Kookaburra Sport Production, Value ($), Price, Gross Margin 2014-2019 Figure Kookaburra Sport Production and Growth Rate Figure Kookaburra Sport Value ($) Market Share 2014-2019 Figure Kookaburra Sport Market Share of Cricket Segmented by Region in 2018 Table Company Profiles Table Product Introduction Table Gray-Nicolls Production, Value ($), Price, Gross Margin 2014-2019 Figure Gray-Nicolls Production and Growth Rate Figure Gray-Nicolls Value ($) Market Share 2014-2019 Figure Gray-Nicolls Market Share of Cricket Segmented by Region in 2018 Table Company Profiles Table Product Introduction Table Masuri Production, Value ($), Price, Gross Margin 2014-2019 Figure Masuri Production and Growth Rate Figure Masuri Value ($) Market Share 2014-2019 Figure Masuri Market Share of Cricket Segmented by Region in 2018 Table Company Profiles Table Product Introduction Table CA Sports Production, Value ($), Price, Gross Margin 2014-2019 Figure CA Sports Production and Growth Rate Figure CA Sports Value ($) Market Share 2014-2019 Figure CA Sports Market Share of Cricket Segmented by Region in 2018 Table Global Cricket Market Value ($) Forecast, by Type Table Global Cricket Market Volume Forecast, by Type Figure Global Cricket Market Value ($) and Growth Rate Forecast of Cricket Bats (2019-2024) Figure Global Cricket Market Volume and Growth Rate Forecast of Cricket Bats (2019-2024) Figure Global Cricket Market Value ($) and Growth Rate Forecast of Cricket Balls (2019-2024) Figure Global Cricket Market Volume and Growth Rate Forecast of Cricket Balls (2019-2024) Figure Global Cricket Market Value ($) and Growth Rate Forecast of Cricket Protective Gear (2019-2024) Figure Global Cricket Market Volume and Growth Rate Forecast of Cricket Protective Gear (2019-2024) Table Global Market Value ($) Forecast by Application (2019-2024) Table Global Market Volume Forecast by Application (2019-2024) Figure Global Cricket Consumption and Growth Rate of Cricket Match (2014-2019) Figure Global Cricket Consumption and Growth Rate of Training (2014-2019) Figure Global Cricket Consumption and Growth Rate of Entertainment (2014-2019) Figure Market Value ($) and Growth Rate Forecast of Entertainment (2019-2024) Figure Market Volume and Growth Rate Forecast of Entertainment (2019-2024) Figure North America Market Value ($) and Growth Rate Forecast (2019-2024) Table North America Consumption and Growth Rate Forecast (2019-2024) Figure Europe Market Value ($) and Growth Rate Forecast (2019-2024) Table Europe Consumption and Growth Rate Forecast (2019-2024) Figure China Market Value ($) and Growth Rate Forecast (2019-2024) Table China Consumption and Growth Rate Forecast (2019-2024) Figure Japan Market Value ($) and Growth Rate Forecast (2019-2024) Table Japan Consumption and Growth Rate Forecast (2019-2024) Figure Middle East & Africa Market Value ($) and Growth Rate Forecast (2019-2024) Table Middle East & Africa Consumption and Growth Rate Forecast (2019-2024) Figure India Market Value ($) and Growth Rate Forecast (2019-2024) Table India Consumption and Growth Rate Forecast (2019-2024) Figure South America Market Value ($) and Growth Rate Forecast (2019-2024) Table South America Consumption and Growth Rate Forecast (2019-2024) Figure Industry Resource/Technology/Labor Importance Analysis Table New Entrants SWOT Analysis Table New Project Analysis of Investment Recovery
Inquiry For Buying
Cricket
Request Sample
Cricket