Cytotoxic Drug Market Size, Share, and Trends Analysis Report
CAGR :

| Market Size 2023 (Base Year) | USD 16.42 Billion |
| Market Size 2032 (Forecast Year) | USD 31.75 Billion |
| CAGR | 7.6% |
| Forecast Period | 2024 - 2032 |
| Historical Period | 2018 - 2023 |
Cytotoxic Drug Market Insights
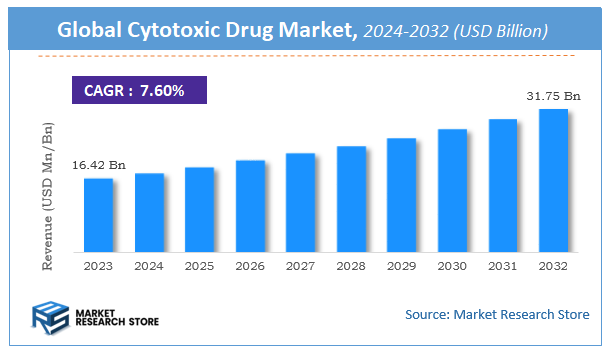
A latest report by Market Research Store estimates that the Global Cytotoxic Drug Market was valued at USD 16.42 Billion in 2023 and is expected to reach USD 31.75 Billion by 2032, with a CAGR of 7.6% during the forecast period 2024-2032. The report Cytotoxic Drug Market overview, growth factors, restraints, opportunities, segmentation, key developments, competitive landscape, consumer insights, and market growth forecast in terms of value or volume. These structured details offer an all-inclusive market overview, providing valuable insights for investment decisions, business decisions, strategic planning, and competitive analysis.
To Get more Insights, Request a Free Sample
Cytotoxic Drug Market: Overview
The growth of the cytotoxic drug market is fueled by rising global demand across various industries and applications. The report highlights lucrative opportunities, analyzing cost structures, key segments, emerging trends, regional dynamics, and advancements by leading players to provide comprehensive market insights. The cytotoxic drug market report offers a detailed industry analysis from 2024 to 2032, combining quantitative and qualitative insights. It examines key factors such as pricing, market penetration, GDP impact, industry dynamics, major players, consumer behavior, and socio-economic conditions. Structured into multiple sections, the report provides a comprehensive perspective on the market from all angles.
Key sections of the cytotoxic drug market report include market segments, outlook, competitive landscape, and company profiles. Market Segments offer in-depth details based on Disease, Therapy, End Use, and other relevant classifications to support strategic marketing initiatives. Market Outlook thoroughly analyzes market trends, growth drivers, restraints, opportunities, challenges, Porter’s Five Forces framework, macroeconomic factors, value chain analysis, and pricing trends shaping the market now and in the future. The Competitive Landscape and Company Profiles section highlights major players, their strategies, and market positioning to guide investment and business decisions. The report also identifies innovation trends, new business opportunities, and investment prospects for the forecast period.
Key Highlights:
- As per the analysis shared by our research analyst, the global cytotoxic drug market is estimated to grow annually at a CAGR of around 7.6% over the forecast period (2024-2032).
- In terms of revenue, the global cytotoxic drug market size was valued at around USD 16.42 Billion in 2023 and is projected to reach USD 31.75 Billion by 2032.
- The market is projected to grow at a significant rate due to increasing global incidence of cancer, coupled with advancements in oncology research and the development of new and improved cytotoxic drugs.
- Based on the Disease, the Leukemia segment is growing at a high rate and will continue to dominate the global market as per industry projections.
- On the basis of Therapy, the Chemotherapy segment is anticipated to command the largest market share.
- In terms of End Use, the Hospital Pharmacies segment is projected to lead the global market.
- Based on region, North America is projected to dominate the global market during the forecast period.
Cytotoxic Drug Market: Report Scope
This report thoroughly analyzes the cytotoxic drug market, exploring its historical trends, current state, and future projections. The market estimates presented result from a robust research methodology, incorporating primary research, secondary sources, and expert opinions. These estimates are influenced by the prevailing market dynamics as well as key economic, social, and political factors. Furthermore, the report considers the impact of regulations, government expenditures, and advancements in research and development on the market. Both positive and negative shifts are evaluated to ensure a comprehensive and accurate market outlook.
| Report Attributes | Report Details |
|---|---|
| Report Name | Cytotoxic Drug Market |
| Market Size in 2023 | USD 16.42 Billion |
| Market Forecast in 2032 | USD 31.75 Billion |
| Growth Rate | CAGR of 7.6% |
| Number of Pages | 177 |
| Key Companies Covered | Merck KGaA, Eli Lilly and Company, Celgene, Sanofi, GlaxoSmithKline Plc, Pfizer Inc., Johnson & Johnson Services Inc., F. Hoffmann La Roche Ltd., Lonza, Amgen, Fresenius Kabi AG, Teva Pharmaceuticals, and Novartis AG |
| Segments Covered | By Disease, By Therapy, By End Use, and By Region |
| Regions Covered | North America, Europe, Asia Pacific (APAC), Latin America, Middle East, and Africa (MEA) |
| Base Year | 2023 |
| Historical Year | 2018 to 2023 |
| Forecast Year | 2024 to 2032 |
| Customization Scope | Avail customized purchase options to meet your exact research needs. Request For Customization |
Cytotoxic Drug Market: Dynamics
Key Growth Drivers
The primary driver for the cytotoxic drug market is the escalating global incidence of cancer. With an aging population and lifestyle factors contributing to increased cancer diagnoses, the demand for effective chemotherapy treatments, where cytotoxic drugs are a cornerstone, continues to rise. Advancements in oncology research, including the development of novel cytotoxic agents with improved efficacy and fewer side effects, also fuel market expansion. Furthermore, increasing government initiatives and funding towards cancer research and treatment programs worldwide contribute significantly to market growth by improving access to these essential medications. The continuous evolution of chemotherapy protocols, often incorporating cytotoxic drugs in combination with targeted therapies and immunotherapies, further sustains their importance in cancer management.
Restraints
Despite the growing need, the cytotoxic drug market faces significant restraints. A major challenge is the severe side effects associated with these drugs. Cytotoxic agents, by nature, target rapidly dividing cells, which unfortunately include healthy cells, leading to adverse effects such as nausea, vomiting, bone marrow suppression, and organ toxicities. These side effects can limit the dosage and duration of treatment, impacting patient outcomes and quality of life. Additionally, the emergence of alternative cancer therapies, such as targeted therapies and immunotherapies, which often have more specific mechanisms of action and potentially fewer systemic side effects, poses a competitive threat to traditional cytotoxic drugs. The high cost associated with many cytotoxic drugs, both branded and novel, can also restrict their accessibility, particularly in developing economies or for patients with limited financial resources. Stringent regulatory approval processes for new drugs add to the time and cost of bringing innovative cytotoxic agents to market.
Opportunities
Several opportunities exist within the cytotoxic drug market to overcome restraints and drive future growth. The increasing focus on personalized medicine offers a significant avenue for developing more effective and less toxic cytotoxic treatments. By utilizing biomarkers and companion diagnostics, therapies can be tailored to individual patient profiles, potentially enhancing efficacy and reducing off-target effects. Technological innovations in drug delivery systems, such as nanoparticle-based delivery and antibody-drug conjugates, can improve the pharmacokinetics and specificity of cytotoxic drugs, leading to better tumor targeting and reduced systemic toxicity. The rising prevalence of cancer in emerging markets, coupled with improving healthcare infrastructure and increasing healthcare expenditure, presents a substantial opportunity for market expansion as access to cancer treatments improves. Furthermore, ongoing research and development efforts focused on combination therapies involving cytotoxic drugs with newer modalities like immunotherapy could enhance treatment outcomes and broaden their applicability across different cancer types. The development of safer and more convenient formulations, such as oral cytotoxic drugs, can also improve patient compliance and quality of life, driving market growth.
Challenges
The cytotoxic drug market faces several complex challenges. One of the most significant is the development of drug resistance in cancer cells, which can limit the long-term effectiveness of cytotoxic treatments. Overcoming resistance mechanisms requires continuous research and the development of novel agents or combination strategies. The inherent toxicity of cytotoxic drugs necessitates careful monitoring and management of side effects, often requiring specialized medical care and supportive therapies, adding to the overall treatment burden. The complexity of cancer biology, with its heterogeneity and evolving nature, makes it challenging to develop universally effective cytotoxic drugs, necessitating a more nuanced and personalized approach. Regulatory hurdles and the time-consuming and expensive nature of clinical trials can delay the introduction of new and improved cytotoxic agents. Additionally, the increasing availability of generic cytotoxic drugs, while improving affordability, can also intensify price competition and potentially impact the profitability of research-based pharmaceutical companies, potentially affecting future investment in innovation. Ensuring equitable access to cytotoxic drugs across different socioeconomic groups and regions remains a significant challenge, particularly in resource-limited settings.
Cytotoxic Drug Market: Segmentation Insights
The global cytotoxic drug market is segmented based on Disease, Therapy, End Use, and Region. All the segments of the cytotoxic drug market have been analyzed based on present & future trends and the market is estimated from 2024 to 2032.
Based on Disease, the global cytotoxic drug market is divided into Leukemia, Lymphoma, Myeloma.
On the basis of Therapy, the global cytotoxic drug market is bifurcated into Chemotherapy, Immunotherapy, Targeted Therapy, Other Therapies.
In terms of End Use, the global cytotoxic drug market is categorized into Hospital Pharmacies, Retail Pharmacies, Other (Specialty pharmacy and online).
Cytotoxic Drug Market: Regional Insights
The North American region, particularly the United States, dominates the global cytotoxic drug market, holding the largest revenue share due to high cancer prevalence, advanced healthcare infrastructure, and strong R&D investments. According to recent industry reports (2023-2024), North America accounted for over 40% of the market share, driven by increasing chemotherapy demand, FDA approvals for novel cytotoxic agents, and robust oncology drug reimbursement policies. Europe follows as the second-largest market, supported by government-funded healthcare systems and rising cancer cases. Meanwhile, the Asia-Pacific region is projected to grow at the highest CAGR, fueled by improving healthcare access, increasing cancer awareness, and expanding generic drug manufacturing in countries like India and China. However, North America remains the dominant force due to its well-established pharmaceutical industry and high adoption of cutting-edge therapies.
Cytotoxic Drug Market: Competitive Landscape
The cytotoxic drug market report offers a thorough analysis of both established and emerging players within the market. It includes a detailed list of key companies, categorized based on the types of products they offer and other relevant factors. The report also highlights the market entry year for each player, providing further context for the research analysis.
The "Global Cytotoxic Drug Market" study offers valuable insights, focusing on the global market landscape, with an emphasis on major industry players such as;
- Merck KGaA
- Eli Lilly and Company
- Celgene
- Sanofi
- GlaxoSmithKline Plc
- Pfizer Inc.
- Johnson & Johnson Services Inc.
- F. Hoffmann La Roche Ltd.
- Lonza
- Amgen
- Fresenius Kabi AG
- Teva Pharmaceuticals
- and Novartis AG
The Global Cytotoxic Drug Market is Segmented as Follows:
By Disease
- Leukemia
- Lymphoma
- Myeloma
By Therapy
- Chemotherapy
- Immunotherapy
- Targeted Therapy
- Other Therapies
By End Use
- Hospital Pharmacies
- Retail Pharmacies
- Other (Specialty pharmacy and online)
By Region
- North America
- The U.S.
- Canada
- Mexico
- Europe
- France
- The UK
- Spain
- Germany
- Italy
- Rest of Europe
- Asia Pacific
- China
- Japan
- India
- Australia
- South Korea
- Rest of Asia Pacific
- The Middle East & Africa
- Saudi Arabia
- UAE
- Egypt
- Kuwait
- South Africa
- Rest of the Middle East & Africa
- Latin America
- Brazil
- Argentina
- Rest of Latin America
Market Evolution
This section evaluates the market position of the product or service by examining its development pathway and competitive dynamics. It provides a detailed overview of the product's growth stages, including the early (historical) phase, the mid-stage, and anticipated future advancements influenced by innovation and emerging technologies.
Porter’s Analysis
Porter’s Five Forces framework offers a strategic lens for assessing competitor behavior and the positioning of key players in the cytotoxic drug industry. This section explores the external factors shaping competitive dynamics and influencing market strategies in the years ahead. The analysis focuses on five critical forces:
- Competitive Rivalry
- Threat of New Entrants
- Threat of Substitutes
- Supplier Bargaining Power
- Buyer Bargaining Power
Value Chain & Market Attractiveness Analysis
The value chain analysis helps businesses optimize operations by mapping the product flow from suppliers to end consumers, identifying opportunities to streamline processes and gain a competitive edge. Segment-wise market attractiveness analysis evaluates key dimensions like product categories, demographics, and regions, assessing growth potential, market size, and profitability. This enables businesses to focus resources on high-potential segments for better ROI and long-term value.
PESTEL Analysis
PESTEL analysis is a powerful tool in market research reports that enhances market understanding by systematically examining the external macro-environmental factors influencing a business or industry. The acronym stands for Political, Economic, Social, Technological, Environmental, and Legal factors. By evaluating these dimensions, PESTEL analysis provides a comprehensive overview of the broader context within which a market operates, helping businesses identify potential opportunities and threats.
- Political factors assess government policies, stability, trade regulations, and political risks that could impact market operations.
- Economic factors examine variables like inflation, exchange rates, economic growth, and consumer spending power to determine market viability.
- Social factors explore cultural trends, demographics, and lifestyle changes that shape consumer behavior and preferences.
- Technological factors evaluate innovation, R&D, and technological advancements affecting product development and operational efficiencies.
- Environmental factors focus on sustainability, climate change impacts, and eco-friendly practices shaping market trends.
- Legal factors address compliance requirements, industry regulations, and intellectual property laws impacting market entry and operations.
Import-export Analysis & Pricing Analysis
An import-export analysis is vital for market research, revealing global trade dynamics, trends, and opportunities. It examines trade volumes, product categories, and regional competitiveness, offering insights into supply chains and market demand. This section also analyzes past and future pricing trends, helping businesses optimize strategies and enabling consumers to assess product value effectively.
Cytotoxic Drug Market: Company Profiles
The report identifies key players in the cytotoxic drug market through a competitive landscape and company profiles, evaluating their offerings, financial performance, strategies, and market positioning. It includes a SWOT analysis of the top 3-5 companies, assessing strengths, weaknesses, opportunities, and threats. The competitive landscape highlights rankings, recent activities (mergers, acquisitions, partnerships, product launches), and regional footprints using the Ace matrix. Customization is available to meet client-specific needs.
Regional & Industry Footprint
This section details the geographic reach, sales networks, and market penetration of companies profiled in the cytotoxic drug report, showcasing their operations and distribution across regions. It analyzes the alignment of companies with specific industry verticals, highlighting the industries they serve and the scope of their products and services within those sectors.
Ace Matrix
This section categorizes companies into four distinct groups—Active, Cutting Edge, Innovator, and Emerging—based on their product and business strategies. The evaluation of product strategy focuses on aspects such as the range and depth of offerings, commitment to innovation, product functionalities, and scalability. Key elements like global reach, sector coverage, strategic acquisitions, and long-term growth plans are considered for business strategy. This analysis provides a detailed view of companies' position within the market and highlights their potential for future growth and development.
Research Methodology
The qualitative and quantitative insights for the cytotoxic drug market are derived through a multi-faceted research approach, combining input from subject matter experts, primary research, and secondary data sources. Primary research includes gathering critical information via face-to-face or telephonic interviews, surveys, questionnaires, and feedback from industry professionals, key opinion leaders (KOLs), and customers. Regular interviews with industry experts are conducted to deepen the analysis and reinforce the existing data, ensuring a robust and well-rounded market understanding.
Secondary research for this report was carried out by the Market Research Store team, drawing on a variety of authoritative sources, such as:
- Official company websites, annual reports, financial statements, investor presentations, and SEC filings
- Internal and external proprietary databases, as well as relevant patent and regulatory databases
- Government publications, national statistical databases, and industry-specific market reports
- Media coverage, including news articles, press releases, and webcasts about market participants
- Paid industry databases for detailed market insights
Market Research Store conducted in-depth consultations with various key opinion leaders in the industry, including senior executives from top companies and regional leaders from end-user organizations. This effort aimed to gather critical insights on factors such as the market share of dominant brands in specific countries and regions, along with pricing strategies for products and services.
To determine total sales data, the research team conducted primary interviews across multiple countries with influential stakeholders, including:
- Distributors
- Marketing, Brand, and Product Managers
- Procurement and Production Managers
- Sales and Regional Sales Managers, Country Managers
- Technical Specialists
- C-Level Executives
These subject matter experts, with their extensive industry experience, helped validate and refine the findings. For secondary research, data was sourced from a wide range of materials, including online resources, company annual reports, industry publications, research papers, association reports, and government websites. These various sources provide a comprehensive and well-rounded perspective on the market.
Frequently Asked Questions
Table Of Content
List of Tables and Figures Figure Product Picture of Cytotoxic Drug Table Product Specification of Cytotoxic Drug Figure Market Concentration Ratio and Market Maturity Analysis of Cytotoxic Drug Figure Global Cytotoxic Drug Value ($) and Growth Rate from 2014-2024 Table Different Types of Cytotoxic Drug Figure Global Cytotoxic Drug Value ($) Segment by Type from 2014-2019 Figure Antimetabolites Picture Figure Taxanes Picture Figure Camptothecin Analogues Picture Figure Alkylating Agents Picture Figure Vinca Alkaloids Picture Figure Epipodophyllo Toxin Picture Figure Miscellaneous Picture Table Different Applications of Cytotoxic Drug Figure Global Cytotoxic Drug Value ($) Segment by Applications from 2014-2019 Figure Retail Pharmacies Picture Figure Hospital Pharmacies Picture Figure Online Pharmacies Picture Table Research Regions of Cytotoxic Drug Figure North America Cytotoxic Drug Production Value ($) and Growth Rate (2014-2019) Figure Europe Cytotoxic Drug Production Value ($) and Growth Rate (2014-2019) Table China Cytotoxic Drug Production Value ($) and Growth Rate (2014-2019) Table Japan Cytotoxic Drug Production Value ($) and Growth Rate (2014-2019) Table Middle East & Africa Cytotoxic Drug Production Value ($) and Growth Rate (2014-2019) Table India Cytotoxic Drug Production Value ($) and Growth Rate (2014-2019) Table South America Cytotoxic Drug Production Value ($) and Growth Rate (2014-2019) Table Emerging Countries of Cytotoxic Drug Table Growing Market of Cytotoxic Drug Figure Industry Chain Analysis of Cytotoxic Drug Table Upstream Raw Material Suppliers of Cytotoxic Drug with Contact Information Table Major Players Manufacturing Base and Market Share ($) of Cytotoxic Drug in 2018 Table Major Players Cytotoxic Drug Product Types in 2018 Figure Production Process of Cytotoxic Drug Figure Manufacturing Cost Structure of Cytotoxic Drug Figure Channel Status of Cytotoxic Drug Table Major Distributors of Cytotoxic Drug with Contact Information Table Major Downstream Buyers of Cytotoxic Drug with Contact Information Table Global Cytotoxic Drug Value ($) by Type (2014-2019) Table Global Cytotoxic Drug Value ($) Share by Type (2014-2019) Figure Global Cytotoxic Drug Value ($) Share by Type (2014-2019) Table Global Cytotoxic Drug Production by Type (2014-2019) Table Global Cytotoxic Drug Production Share by Type (2014-2019) Figure Global Cytotoxic Drug Production Share by Type (2014-2019) Figure Global Cytotoxic Drug Value ($) and Growth Rate of Antimetabolites Figure Global Cytotoxic Drug Value ($) and Growth Rate of Taxanes Figure Global Cytotoxic Drug Value ($) and Growth Rate of Camptothecin Analogues Figure Global Cytotoxic Drug Value ($) and Growth Rate of Alkylating Agents Figure Global Cytotoxic Drug Value ($) and Growth Rate of Vinca Alkaloids Figure Global Cytotoxic Drug Value ($) and Growth Rate of Epipodophyllo Toxin Figure Global Cytotoxic Drug Value ($) and Growth Rate of Miscellaneous Figure Global Cytotoxic Drug Price by Type (2014-2019) Table Global Cytotoxic Drug Consumption by Application (2014-2019) Table Global Cytotoxic Drug Consumption Market Share by Application (2014-2019) Figure Global Cytotoxic Drug Consumption Market Share by Application (2014-2019) Table Downstream Buyers Introduction by Application Figure Global Cytotoxic Drug Consumption and Growth Rate of Retail Pharmacies (2014-2019) Figure Global Cytotoxic Drug Consumption and Growth Rate of Hospital Pharmacies (2014-2019) Figure Global Cytotoxic Drug Consumption and Growth Rate of Online Pharmacies (2014-2019) Table Global Cytotoxic Drug Value ($) by Region (2014-2019) Table Global Cytotoxic Drug Value ($) Market Share by Region (2014-2019) Figure Global Cytotoxic Drug Value ($) Market Share by Region (2014-2019) Table Global Cytotoxic Drug Production by Region (2014-2019) Table Global Cytotoxic Drug Production Market Share by Region (2014-2019) Figure Global Cytotoxic Drug Production Market Share by Region (2014-2019) Table Global Cytotoxic Drug Production, Value ($), Price and Gross Margin (2014-2019) Table North America Cytotoxic Drug Production, Value ($), Price and Gross Margin (2014-2019) Table Europe Cytotoxic Drug Production, Value ($), Price and Gross Margin (2014-2019) Table China Cytotoxic Drug Production, Value ($), Price and Gross Margin (2014-2019) Table Japan Cytotoxic Drug Production, Value ($), Price and Gross Margin (2014-2019) Table Middle East & Africa Cytotoxic Drug Production, Value ($), Price and Gross Margin (2014-2019) Table India Cytotoxic Drug Production, Value ($), Price and Gross Margin (2014-2019) Table South America Cytotoxic Drug Production, Value ($), Price and Gross Margin (2014-2019) Table Global Cytotoxic Drug Consumption by Regions (2014-2019) Figure Global Cytotoxic Drug Consumption Share by Regions (2014-2019) Table North America Cytotoxic Drug Production, Consumption, Export, Import (2014-2019) Table Europe Cytotoxic Drug Production, Consumption, Export, Import (2014-2019) Table China Cytotoxic Drug Production, Consumption, Export, Import (2014-2019) Table Japan Cytotoxic Drug Production, Consumption, Export, Import (2014-2019) Table Middle East & Africa Cytotoxic Drug Production, Consumption, Export, Import (2014-2019) Table India Cytotoxic Drug Production, Consumption, Export, Import (2014-2019) Table South America Cytotoxic Drug Production, Consumption, Export, Import (2014-2019) Figure North America Cytotoxic Drug Production and Growth Rate Analysis Figure North America Cytotoxic Drug Consumption and Growth Rate Analysis Figure North America Cytotoxic Drug SWOT Analysis Figure Europe Cytotoxic Drug Production and Growth Rate Analysis Figure Europe Cytotoxic Drug Consumption and Growth Rate Analysis Figure Europe Cytotoxic Drug SWOT Analysis Figure China Cytotoxic Drug Production and Growth Rate Analysis Figure China Cytotoxic Drug Consumption and Growth Rate Analysis Figure China Cytotoxic Drug SWOT Analysis Figure Japan Cytotoxic Drug Production and Growth Rate Analysis Figure Japan Cytotoxic Drug Consumption and Growth Rate Analysis Figure Japan Cytotoxic Drug SWOT Analysis Figure Middle East & Africa Cytotoxic Drug Production and Growth Rate Analysis Figure Middle East & Africa Cytotoxic Drug Consumption and Growth Rate Analysis Figure Middle East & Africa Cytotoxic Drug SWOT Analysis Figure India Cytotoxic Drug Production and Growth Rate Analysis Figure India Cytotoxic Drug Consumption and Growth Rate Analysis Figure India Cytotoxic Drug SWOT Analysis Figure South America Cytotoxic Drug Production and Growth Rate Analysis Figure South America Cytotoxic Drug Consumption and Growth Rate Analysis Figure South America Cytotoxic Drug SWOT Analysis Figure Top 3 Market Share of Cytotoxic Drug Companies Figure Top 6 Market Share of Cytotoxic Drug Companies Table Mergers, Acquisitions and Expansion Analysis Table Company Profiles Table Product Introduction Table GlaxoSmithKlin Production, Value ($), Price, Gross Margin 2014-2019 Figure GlaxoSmithKlin Production and Growth Rate Figure GlaxoSmithKlin Value ($) Market Share 2014-2019 Figure GlaxoSmithKlin Market Share of Cytotoxic Drug Segmented by Region in 2018 Table Company Profiles Table Product Introduction Table Johnson&Johnso Production, Value ($), Price, Gross Margin 2014-2019 Figure Johnson&Johnso Production and Growth Rate Figure Johnson&Johnso Value ($) Market Share 2014-2019 Figure Johnson&Johnso Market Share of Cytotoxic Drug Segmented by Region in 2018 Table Company Profiles Table Product Introduction Table Celgen Production, Value ($), Price, Gross Margin 2014-2019 Figure Celgen Production and Growth Rate Figure Celgen Value ($) Market Share 2014-2019 Figure Celgen Market Share of Cytotoxic Drug Segmented by Region in 2018 Table Company Profiles Table Product Introduction Table Merck&Co Production, Value ($), Price, Gross Margin 2014-2019 Figure Merck&Co Production and Growth Rate Figure Merck&Co Value ($) Market Share 2014-2019 Figure Merck&Co Market Share of Cytotoxic Drug Segmented by Region in 2018 Table Company Profiles Table Product Introduction Table Eli Lilly Production, Value ($), Price, Gross Margin 2014-2019 Figure Eli Lilly Production and Growth Rate Figure Eli Lilly Value ($) Market Share 2014-2019 Figure Eli Lilly Market Share of Cytotoxic Drug Segmented by Region in 2018 Table Company Profiles Table Product Introduction Table Pfize Production, Value ($), Price, Gross Margin 2014-2019 Figure Pfize Production and Growth Rate Figure Pfize Value ($) Market Share 2014-2019 Figure Pfize Market Share of Cytotoxic Drug Segmented by Region in 2018 Table Company Profiles Table Product Introduction Table Roche Holding AG Production, Value ($), Price, Gross Margin 2014-2019 Figure Roche Holding AG Production and Growth Rate Figure Roche Holding AG Value ($) Market Share 2014-2019 Figure Roche Holding AG Market Share of Cytotoxic Drug Segmented by Region in 2018 Table Company Profiles Table Product Introduction Table Sanof Production, Value ($), Price, Gross Margin 2014-2019 Figure Sanof Production and Growth Rate Figure Sanof Value ($) Market Share 2014-2019 Figure Sanof Market Share of Cytotoxic Drug Segmented by Region in 2018 Table Company Profiles Table Product Introduction Table Amgen Production, Value ($), Price, Gross Margin 2014-2019 Figure Amgen Production and Growth Rate Figure Amgen Value ($) Market Share 2014-2019 Figure Amgen Market Share of Cytotoxic Drug Segmented by Region in 2018 Table Global Cytotoxic Drug Market Value ($) Forecast, by Type Table Global Cytotoxic Drug Market Volume Forecast, by Type Figure Global Cytotoxic Drug Market Value ($) and Growth Rate Forecast of Antimetabolites (2019-2024) Figure Global Cytotoxic Drug Market Volume and Growth Rate Forecast of Antimetabolites (2019-2024) Figure Global Cytotoxic Drug Market Value ($) and Growth Rate Forecast of Taxanes (2019-2024) Figure Global Cytotoxic Drug Market Volume and Growth Rate Forecast of Taxanes (2019-2024) Figure Global Cytotoxic Drug Market Value ($) and Growth Rate Forecast of Camptothecin Analogues (2019-2024) Figure Global Cytotoxic Drug Market Volume and Growth Rate Forecast of Camptothecin Analogues (2019-2024) Figure Global Cytotoxic Drug Market Value ($) and Growth Rate Forecast of Alkylating Agents (2019-2024) Figure Global Cytotoxic Drug Market Volume and Growth Rate Forecast of Alkylating Agents (2019-2024) Figure Global Cytotoxic Drug Market Value ($) and Growth Rate Forecast of Vinca Alkaloids (2019-2024) Figure Global Cytotoxic Drug Market Volume and Growth Rate Forecast of Vinca Alkaloids (2019-2024) Figure Global Cytotoxic Drug Market Value ($) and Growth Rate Forecast of Epipodophyllo Toxin (2019-2024) Figure Global Cytotoxic Drug Market Volume and Growth Rate Forecast of Epipodophyllo Toxin (2019-2024) Figure Global Cytotoxic Drug Market Value ($) and Growth Rate Forecast of Miscellaneous (2019-2024) Figure Global Cytotoxic Drug Market Volume and Growth Rate Forecast of Miscellaneous (2019-2024) Table Global Market Value ($) Forecast by Application (2019-2024) Table Global Market Volume Forecast by Application (2019-2024) Figure Global Cytotoxic Drug Consumption and Growth Rate of Retail Pharmacies (2014-2019) Figure Global Cytotoxic Drug Consumption and Growth Rate of Hospital Pharmacies (2014-2019) Figure Global Cytotoxic Drug Consumption and Growth Rate of Online Pharmacies (2014-2019) Figure Market Value ($) and Growth Rate Forecast of Online Pharmacies (2019-2024) Figure Market Volume and Growth Rate Forecast of Online Pharmacies (2019-2024) Figure North America Market Value ($) and Growth Rate Forecast (2019-2024) Table North America Consumption and Growth Rate Forecast (2019-2024) Figure Europe Market Value ($) and Growth Rate Forecast (2019-2024) Table Europe Consumption and Growth Rate Forecast (2019-2024) Figure China Market Value ($) and Growth Rate Forecast (2019-2024) Table China Consumption and Growth Rate Forecast (2019-2024) Figure Japan Market Value ($) and Growth Rate Forecast (2019-2024) Table Japan Consumption and Growth Rate Forecast (2019-2024) Figure Middle East & Africa Market Value ($) and Growth Rate Forecast (2019-2024) Table Middle East & Africa Consumption and Growth Rate Forecast (2019-2024) Figure India Market Value ($) and Growth Rate Forecast (2019-2024) Table India Consumption and Growth Rate Forecast (2019-2024) Figure South America Market Value ($) and Growth Rate Forecast (2019-2024) Table South America Consumption and Growth Rate Forecast (2019-2024) Figure Industry Resource/Technology/Labor Importance Analysis Table New Entrants SWOT Analysis Table New Project Analysis of Investment Recovery
Inquiry For Buying
Cytotoxic Drug
Request Sample
Cytotoxic Drug