Feed Phytogenic Market Size, Share, and Trends Analysis Report
CAGR :

| Market Size 2024 (Base Year) | USD 852.63 Million |
| Market Size 2032 (Forecast Year) | USD 1487.03 Million |
| CAGR | 7.2% |
| Forecast Period | 2025 - 2032 |
| Historical Period | 2020 - 2024 |
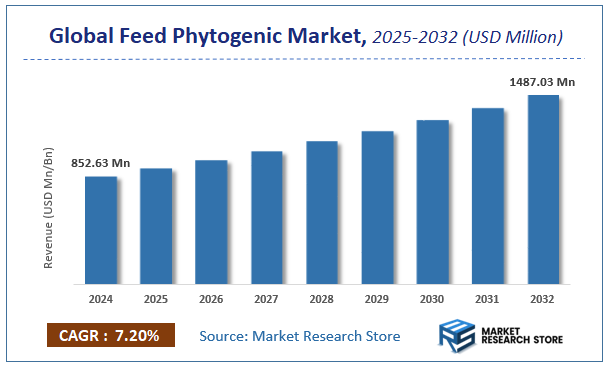
Market Research Store has published a report on the global feed phytogenic market, estimating its value at USD 852.63 Million in 2024, with projections indicating it will reach USD 1487.03 Million by the end of 2032. The market is expected to expand at a compound annual growth rate (CAGR) of around 7.2% over the forecast period. The report examines the factors driving market growth, the obstacles that could hinder this expansion, and the opportunities that may emerge in the feed phytogenic industry. Additionally, it offers a detailed analysis of how these elements will affect demand dynamics and market performance throughout the forecast period.
To Get more Insights, Request a Free Sample
Feed Phytogenic Market: Overview
The growth of the feed phytogenic market is fueled by rising global demand across various industries and applications. The report highlights lucrative opportunities, analyzing cost structures, key segments, emerging trends, regional dynamics, and advancements by leading players to provide comprehensive market insights. The feed phytogenic market report offers a detailed industry analysis from 2024 to 2032, combining quantitative and qualitative insights. It examines key factors such as pricing, market penetration, GDP impact, industry dynamics, major players, consumer behavior, and socio-economic conditions. Structured into multiple sections, the report provides a comprehensive perspective on the market from all angles.
Key sections of the feed phytogenic market report include market segments, outlook, competitive landscape, and company profiles. Market Segments offer in-depth details based on Type, Livestock, Source, Function, and other relevant classifications to support strategic marketing initiatives. Market Outlook thoroughly analyzes market trends, growth drivers, restraints, opportunities, challenges, Porter’s Five Forces framework, macroeconomic factors, value chain analysis, and pricing trends shaping the market now and in the future. The Competitive Landscape and Company Profiles section highlights major players, their strategies, and market positioning to guide investment and business decisions. The report also identifies innovation trends, new business opportunities, and investment prospects for the forecast period.
Key Highlights:
- As per the analysis shared by our research analyst, the global feed phytogenic market is estimated to grow annually at a CAGR of around 7.2% over the forecast period (2025-2032).
- In terms of revenue, the global feed phytogenic market size was valued at around USD 852.63 Million in 2024 and is projected to reach USD 1487.03 Million by 2032.
- The market is projected to grow at a significant rate due to Growing demand for natural feed additives, increasing use of plant-derived compounds to enhance animal health, and rising awareness of antibiotic-free livestock production are driving the global Feed Phytogenic market.
- Based on the Type, the Essential oils segment is growing at a high rate and will continue to dominate the global market as per industry projections.
- On the basis of Livestock, the Poultry segment is anticipated to command the largest market share.
- In terms of Source, the Herbs & spices segment is projected to lead the global market.
- By Function, the Performance enhancers segment is predicted to dominate the global market.
- Based on region, Asia Pacific is projected to dominate the global market during the forecast period.
Feed Phytogenic Market: Report Scope
This report thoroughly analyzes the feed phytogenic market, exploring its historical trends, current state, and future projections. The market estimates presented result from a robust research methodology, incorporating primary research, secondary sources, and expert opinions. These estimates are influenced by the prevailing market dynamics as well as key economic, social, and political factors. Furthermore, the report considers the impact of regulations, government expenditures, and advancements in research and development on the market. Both positive and negative shifts are evaluated to ensure a comprehensive and accurate market outlook.
| Report Attributes | Report Details |
|---|---|
| Report Name | Feed Phytogenic Market |
| Market Size in 2024 | USD 852.63 Million |
| Market Forecast in 2032 | USD 1487.03 Million |
| Growth Rate | CAGR of 7.2% |
| Number of Pages | 214 |
| Key Companies Covered | Delacon Biotechnik GmbH, BIOMIN Holding GmbH, Bluestar Adisseo Co., Ltd., and Natural Remedies |
| Segments Covered | By Type, By Livestock, By Source, By Function, and By Region |
| Regions Covered | North America, Europe, Asia Pacific (APAC), Latin America, The Middle East and Africa (MEA) |
| Base Year | 2024 |
| Historical Year | 2020 to 2024 |
| Forecast Year | 2025 to 2032 |
| Customization Scope | Avail customized purchase options to meet your exact research needs. Request For Customization |
Feed Phytogenic Market: Dynamics
Key Growth Drivers :
The Feed Phytogenic market is experiencing significant growth, primarily driven by the escalating global concern over antibiotic resistance in livestock and the subsequent regulatory bans or restrictions on antibiotic growth promoters (AGPs) in animal feed. This has created a strong demand for natural, safe, and effective alternatives like phytogenics to improve animal health, performance, and immunity. Furthermore, the growing consumer preference for naturally raised and "antibiotic-free" meat, dairy, and egg products pushes feed manufacturers to adopt phytogenic solutions. The increasing global demand for animal protein, coupled with the need for sustainable and efficient livestock production, also fuels the adoption of these plant-derived additives.
Restraints :
Despite the robust growth, the Feed Phytogenic market faces several restraints. The relatively higher cost of some high-quality, standardized phytogenic products compared to traditional feed additives can be a barrier for feed manufacturers and farmers operating on tight margins. The variability in the composition and efficacy of plant extracts, depending on sourcing, processing, and storage, can lead to inconsistent results and skepticism among users. Furthermore, the complex regulatory approval processes for novel feed additives, especially concerning their safety and efficacy claims, can be lengthy and expensive, hindering market entry and widespread adoption of new phytogenic solutions.
Opportunities :
Opportunities in the Feed Phytogenic market are substantial, particularly in the development of scientifically validated, standardized, and highly bioavailable phytogenic formulations for specific animal species and production stages. Expanding research into novel plant extracts and their synergistic combinations to target specific health challenges (e.g., gut health, immunity, stress reduction) offers significant growth potential. The growing trend of precision animal nutrition, which tailors feed additives to individual animal needs, presents an avenue for customized phytogenic solutions. Furthermore, increasing market penetration in emerging economies, where livestock industries are rapidly expanding and there's a growing awareness of natural alternatives, offers vast untapped potential.
Challenges :
The Feed Phytogenic market confronts several challenges. Ensuring consistent efficacy and stability of phytogenic compounds throughout the feed manufacturing process and subsequent storage is a critical technical hurdle, as many are sensitive to heat and oxidation. The need to educate farmers and feed formulators about the scientific basis, benefits, and proper application of phytogenics, differentiating them from less effective herbal remedies, remains an ongoing challenge. Intense competition from a multitude of new and established players offering similar plant-based solutions can lead to price erosion. Additionally, demonstrating a clear and quantifiable return on investment (ROI) for phytogenics to farmers, who often prioritize immediate cost savings, is a continuous sales and marketing challenge.
Feed Phytogenic Market: Segmentation Insights
The global feed phytogenic market is segmented based on Type, Livestock, Source, Function, and Region. All the segments of the feed phytogenic market have been analyzed based on present & future trends and the market is estimated from 2024 to 2032.
Based on Type, the global feed phytogenic market is divided into Essential oils, Flavonoids, Saponins, Oleoresins, Others.
On the basis of Livestock, the global feed phytogenic market is bifurcated into Poultry, Swine, Ruminants, Aquatic animals, Others.
In terms of Source, the global feed phytogenic market is categorized into Herbs & spices, Flowers, Fruits & vegetables.
Based on Function, the global feed phytogenic market is split into Performance enhancers, Antimicrobial properties, Palatability enhancers, Others.
Feed Phytogenic Market: Regional Insights
Europe is the established and dominant region in the global feed phytogenic market. This leadership is driven by the European Union's early and stringent ban on antibiotic growth promoters (AGPs) in animal feed, which forced the industry to seek natural alternatives like phytogenics. Strong consumer demand for organic and naturally-produced meat, coupled with advanced animal nutrition practices and significant investments in research by key market players, has solidified Europe's position as the most mature and largest market. While Asia-Pacific is growing rapidly, Europe remains the innovation and regulatory trendsetter for these natural feed additives.
Feed Phytogenic Market: Competitive Landscape
The feed phytogenic market report offers a thorough analysis of both established and emerging players within the market. It includes a detailed list of key companies, categorized based on the types of products they offer and other relevant factors. The report also highlights the market entry year for each player, providing further context for the research analysis.
The "Global Feed Phytogenic Market" study offers valuable insights, focusing on the global market landscape, with an emphasis on major industry players such as;
- Delacon Biotechnik GmbH
- BIOMIN Holding GmbH
- Bluestar Adisseo Co.
- Ltd.
- and Natural Remedies
The Global Feed Phytogenic Market is Segmented as Follows:
By Type
- Essential oils
- Flavonoids
- Saponins
- Oleoresins
- Others
By Livestock
- Poultry
- Swine
- Ruminants
- Aquatic animals
- Others
By Source
- Herbs & spices
- Flowers
- Fruits & vegetables
By Function
- Performance enhancers
- Antimicrobial properties
- Palatability enhancers
- Others
By Region
- North America
- The U.S.
- Canada
- Mexico
- Europe
- France
- The UK
- Spain
- Germany
- Italy
- Rest of Europe
- Asia Pacific
- China
- Japan
- India
- Australia
- South Korea
- Rest of Asia Pacific
- The Middle East & Africa
- Saudi Arabia
- UAE
- Egypt
- Kuwait
- South Africa
- Rest of the Middle East & Africa
- Latin America
- Brazil
- Argentina
- Rest of Latin America
Frequently Asked Questions
Table Of Content
List of Tables and Figures Figure Product Picture of Feed Phytogenic Table Product Specification of Feed Phytogenic Figure Market Concentration Ratio and Market Maturity Analysis of Feed Phytogenic Figure Global Feed Phytogenic Value ($) and Growth Rate from 2014-2024 Table Different Types of Feed Phytogenic Figure Global Feed Phytogenic Value ($) Segment by Type from 2014-2019 Figure Essential Oils Picture Figure Herbs & Spices Picture Figure Oleoresins Picture Figure Mucilage Picture Figure Echinacea Picture Table Different Applications of Feed Phytogenic Figure Global Feed Phytogenic Value ($) Segment by Applications from 2014-2019 Figure Swine Picture Figure Ruminants Picture Figure Poultry Picture Figure Equine Picture Figure Aquatics Picture Figure Other Animals Picture Table Research Regions of Feed Phytogenic Figure North America Feed Phytogenic Production Value ($) and Growth Rate (2014-2019) Figure Europe Feed Phytogenic Production Value ($) and Growth Rate (2014-2019) Table China Feed Phytogenic Production Value ($) and Growth Rate (2014-2019) Table Japan Feed Phytogenic Production Value ($) and Growth Rate (2014-2019) Table Middle East & Africa Feed Phytogenic Production Value ($) and Growth Rate (2014-2019) Table India Feed Phytogenic Production Value ($) and Growth Rate (2014-2019) Table South America Feed Phytogenic Production Value ($) and Growth Rate (2014-2019) Table Emerging Countries of Feed Phytogenic Table Growing Market of Feed Phytogenic Figure Industry Chain Analysis of Feed Phytogenic Table Upstream Raw Material Suppliers of Feed Phytogenic with Contact Information Table Major Players Manufacturing Base and Market Share ($) of Feed Phytogenic in 2018 Table Major Players Feed Phytogenic Product Types in 2018 Figure Production Process of Feed Phytogenic Figure Manufacturing Cost Structure of Feed Phytogenic Figure Channel Status of Feed Phytogenic Table Major Distributors of Feed Phytogenic with Contact Information Table Major Downstream Buyers of Feed Phytogenic with Contact Information Table Global Feed Phytogenic Value ($) by Type (2014-2019) Table Global Feed Phytogenic Value ($) Share by Type (2014-2019) Figure Global Feed Phytogenic Value ($) Share by Type (2014-2019) Table Global Feed Phytogenic Production by Type (2014-2019) Table Global Feed Phytogenic Production Share by Type (2014-2019) Figure Global Feed Phytogenic Production Share by Type (2014-2019) Figure Global Feed Phytogenic Value ($) and Growth Rate of Essential Oils Figure Global Feed Phytogenic Value ($) and Growth Rate of Herbs & Spices Figure Global Feed Phytogenic Value ($) and Growth Rate of Oleoresins Figure Global Feed Phytogenic Value ($) and Growth Rate of Mucilage Figure Global Feed Phytogenic Value ($) and Growth Rate of Echinacea Figure Global Feed Phytogenic Price by Type (2014-2019) Table Global Feed Phytogenic Consumption by Application (2014-2019) Table Global Feed Phytogenic Consumption Market Share by Application (2014-2019) Figure Global Feed Phytogenic Consumption Market Share by Application (2014-2019) Table Downstream Buyers Introduction by Application Figure Global Feed Phytogenic Consumption and Growth Rate of Swine (2014-2019) Figure Global Feed Phytogenic Consumption and Growth Rate of Ruminants (2014-2019) Figure Global Feed Phytogenic Consumption and Growth Rate of Poultry (2014-2019) Figure Global Feed Phytogenic Consumption and Growth Rate of Equine (2014-2019) Figure Global Feed Phytogenic Consumption and Growth Rate of Aquatics (2014-2019) Figure Global Feed Phytogenic Consumption and Growth Rate of Other Animals (2014-2019) Table Global Feed Phytogenic Value ($) by Region (2014-2019) Table Global Feed Phytogenic Value ($) Market Share by Region (2014-2019) Figure Global Feed Phytogenic Value ($) Market Share by Region (2014-2019) Table Global Feed Phytogenic Production by Region (2014-2019) Table Global Feed Phytogenic Production Market Share by Region (2014-2019) Figure Global Feed Phytogenic Production Market Share by Region (2014-2019) Table Global Feed Phytogenic Production, Value ($), Price and Gross Margin (2014-2019) Table North America Feed Phytogenic Production, Value ($), Price and Gross Margin (2014-2019) Table Europe Feed Phytogenic Production, Value ($), Price and Gross Margin (2014-2019) Table China Feed Phytogenic Production, Value ($), Price and Gross Margin (2014-2019) Table Japan Feed Phytogenic Production, Value ($), Price and Gross Margin (2014-2019) Table Middle East & Africa Feed Phytogenic Production, Value ($), Price and Gross Margin (2014-2019) Table India Feed Phytogenic Production, Value ($), Price and Gross Margin (2014-2019) Table South America Feed Phytogenic Production, Value ($), Price and Gross Margin (2014-2019) Table Global Feed Phytogenic Consumption by Regions (2014-2019) Figure Global Feed Phytogenic Consumption Share by Regions (2014-2019) Table North America Feed Phytogenic Production, Consumption, Export, Import (2014-2019) Table Europe Feed Phytogenic Production, Consumption, Export, Import (2014-2019) Table China Feed Phytogenic Production, Consumption, Export, Import (2014-2019) Table Japan Feed Phytogenic Production, Consumption, Export, Import (2014-2019) Table Middle East & Africa Feed Phytogenic Production, Consumption, Export, Import (2014-2019) Table India Feed Phytogenic Production, Consumption, Export, Import (2014-2019) Table South America Feed Phytogenic Production, Consumption, Export, Import (2014-2019) Figure North America Feed Phytogenic Production and Growth Rate Analysis Figure North America Feed Phytogenic Consumption and Growth Rate Analysis Figure North America Feed Phytogenic SWOT Analysis Figure Europe Feed Phytogenic Production and Growth Rate Analysis Figure Europe Feed Phytogenic Consumption and Growth Rate Analysis Figure Europe Feed Phytogenic SWOT Analysis Figure China Feed Phytogenic Production and Growth Rate Analysis Figure China Feed Phytogenic Consumption and Growth Rate Analysis Figure China Feed Phytogenic SWOT Analysis Figure Japan Feed Phytogenic Production and Growth Rate Analysis Figure Japan Feed Phytogenic Consumption and Growth Rate Analysis Figure Japan Feed Phytogenic SWOT Analysis Figure Middle East & Africa Feed Phytogenic Production and Growth Rate Analysis Figure Middle East & Africa Feed Phytogenic Consumption and Growth Rate Analysis Figure Middle East & Africa Feed Phytogenic SWOT Analysis Figure India Feed Phytogenic Production and Growth Rate Analysis Figure India Feed Phytogenic Consumption and Growth Rate Analysis Figure India Feed Phytogenic SWOT Analysis Figure South America Feed Phytogenic Production and Growth Rate Analysis Figure South America Feed Phytogenic Consumption and Growth Rate Analysis Figure South America Feed Phytogenic SWOT Analysis Figure Top 3 Market Share of Feed Phytogenic Companies Figure Top 6 Market Share of Feed Phytogenic Companies Table Mergers, Acquisitions and Expansion Analysis Table Company Profiles Table Product Introduction Table Pancosma Production, Value ($), Price, Gross Margin 2014-2019 Figure Pancosma Production and Growth Rate Figure Pancosma Value ($) Market Share 2014-2019 Figure Pancosma Market Share of Feed Phytogenic Segmented by Region in 2018 Table Company Profiles Table Product Introduction Table Biomin Holding Production, Value ($), Price, Gross Margin 2014-2019 Figure Biomin Holding Production and Growth Rate Figure Biomin Holding Value ($) Market Share 2014-2019 Figure Biomin Holding Market Share of Feed Phytogenic Segmented by Region in 2018 Table Company Profiles Table Product Introduction Table Delacon Biotechnik Production, Value ($), Price, Gross Margin 2014-2019 Figure Delacon Biotechnik Production and Growth Rate Figure Delacon Biotechnik Value ($) Market Share 2014-2019 Figure Delacon Biotechnik Market Share of Feed Phytogenic Segmented by Region in 2018 Table Company Profiles Table Product Introduction Table A&A Pharmachem Production, Value ($), Price, Gross Margin 2014-2019 Figure A&A Pharmachem Production and Growth Rate Figure A&A Pharmachem Value ($) Market Share 2014-2019 Figure A&A Pharmachem Market Share of Feed Phytogenic Segmented by Region in 2018 Table Company Profiles Table Product Introduction Table Phytosynthese Production, Value ($), Price, Gross Margin 2014-2019 Figure Phytosynthese Production and Growth Rate Figure Phytosynthese Value ($) Market Share 2014-2019 Figure Phytosynthese Market Share of Feed Phytogenic Segmented by Region in 2018 Table Company Profiles Table Product Introduction Table Cargill Production, Value ($), Price, Gross Margin 2014-2019 Figure Cargill Production and Growth Rate Figure Cargill Value ($) Market Share 2014-2019 Figure Cargill Market Share of Feed Phytogenic Segmented by Region in 2018 Table Company Profiles Table Product Introduction Table Kemin Industries Production, Value ($), Price, Gross Margin 2014-2019 Figure Kemin Industries Production and Growth Rate Figure Kemin Industries Value ($) Market Share 2014-2019 Figure Kemin Industries Market Share of Feed Phytogenic Segmented by Region in 2018 Table Company Profiles Table Product Introduction Table Dostofarm Production, Value ($), Price, Gross Margin 2014-2019 Figure Dostofarm Production and Growth Rate Figure Dostofarm Value ($) Market Share 2014-2019 Figure Dostofarm Market Share of Feed Phytogenic Segmented by Region in 2018 Table Company Profiles Table Product Introduction Table Phytobiotics Futterzusatzstoffe Production, Value ($), Price, Gross Margin 2014-2019 Figure Phytobiotics Futterzusatzstoffe Production and Growth Rate Figure Phytobiotics Futterzusatzstoffe Value ($) Market Share 2014-2019 Figure Phytobiotics Futterzusatzstoffe Market Share of Feed Phytogenic Segmented by Region in 2018 Table Company Profiles Table Product Introduction Table Du Pont Production, Value ($), Price, Gross Margin 2014-2019 Figure Du Pont Production and Growth Rate Figure Du Pont Value ($) Market Share 2014-2019 Figure Du Pont Market Share of Feed Phytogenic Segmented by Region in 2018 Table Global Feed Phytogenic Market Value ($) Forecast, by Type Table Global Feed Phytogenic Market Volume Forecast, by Type Figure Global Feed Phytogenic Market Value ($) and Growth Rate Forecast of Essential Oils (2019-2024) Figure Global Feed Phytogenic Market Volume and Growth Rate Forecast of Essential Oils (2019-2024) Figure Global Feed Phytogenic Market Value ($) and Growth Rate Forecast of Herbs & Spices (2019-2024) Figure Global Feed Phytogenic Market Volume and Growth Rate Forecast of Herbs & Spices (2019-2024) Figure Global Feed Phytogenic Market Value ($) and Growth Rate Forecast of Oleoresins (2019-2024) Figure Global Feed Phytogenic Market Volume and Growth Rate Forecast of Oleoresins (2019-2024) Figure Global Feed Phytogenic Market Value ($) and Growth Rate Forecast of Mucilage (2019-2024) Figure Global Feed Phytogenic Market Volume and Growth Rate Forecast of Mucilage (2019-2024) Figure Global Feed Phytogenic Market Value ($) and Growth Rate Forecast of Echinacea (2019-2024) Figure Global Feed Phytogenic Market Volume and Growth Rate Forecast of Echinacea (2019-2024) Table Global Market Value ($) Forecast by Application (2019-2024) Table Global Market Volume Forecast by Application (2019-2024) Figure Global Feed Phytogenic Consumption and Growth Rate of Swine (2014-2019) Figure Global Feed Phytogenic Consumption and Growth Rate of Ruminants (2014-2019) Figure Global Feed Phytogenic Consumption and Growth Rate of Poultry (2014-2019) Figure Global Feed Phytogenic Consumption and Growth Rate of Equine (2014-2019) Figure Global Feed Phytogenic Consumption and Growth Rate of Aquatics (2014-2019) Figure Global Feed Phytogenic Consumption and Growth Rate of Other Animals (2014-2019) Figure Market Value ($) and Growth Rate Forecast of Other Animals (2019-2024) Figure Market Volume and Growth Rate Forecast of Other Animals (2019-2024) Figure North America Market Value ($) and Growth Rate Forecast (2019-2024) Table North America Consumption and Growth Rate Forecast (2019-2024) Figure Europe Market Value ($) and Growth Rate Forecast (2019-2024) Table Europe Consumption and Growth Rate Forecast (2019-2024) Figure China Market Value ($) and Growth Rate Forecast (2019-2024) Table China Consumption and Growth Rate Forecast (2019-2024) Figure Japan Market Value ($) and Growth Rate Forecast (2019-2024) Table Japan Consumption and Growth Rate Forecast (2019-2024) Figure Middle East & Africa Market Value ($) and Growth Rate Forecast (2019-2024) Table Middle East & Africa Consumption and Growth Rate Forecast (2019-2024) Figure India Market Value ($) and Growth Rate Forecast (2019-2024) Table India Consumption and Growth Rate Forecast (2019-2024) Figure South America Market Value ($) and Growth Rate Forecast (2019-2024) Table South America Consumption and Growth Rate Forecast (2019-2024) Figure Industry Resource/Technology/Labor Importance Analysis Table New Entrants SWOT Analysis Table New Project Analysis of Investment Recovery
Inquiry For Buying
Feed Phytogenic
Request Sample
Feed Phytogenic