Gear Box Market Size, Share, and Trends Analysis Report
CAGR :

| Market Size 2023 (Base Year) | USD 30.61 Billion |
| Market Size 2032 (Forecast Year) | USD 46.4 Billion |
| CAGR | 4.2% |
| Forecast Period | 2024 - 2032 |
| Historical Period | 2018 - 2023 |
Gear Box Market Insights
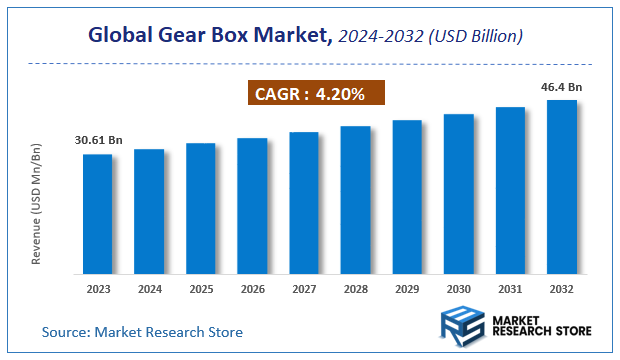
As per the published report by Market Research Store, the Global Gear Box Market size was estimated at USD 30.61 Billion in 2023 and is anticipated to reach reach USD 46.4 Billion by 2032, growing at a projected CAGR of 4.2% during the forecast period 2024-2032. The report provides a detailed analysis of the global Gear Box Market, including market trends, market dynamics, and market opportunities during the forecast period (2024-2032). It delves deeper into several market facets, such as market definition, size, growth, forecast, segmentation, competitive analysis, growth drivers, restraints, financial analysis, SWOT analysis, PORTER’s five force analysis, PESTEL analysis, market share analysis, cost-benefit analysis, challenges, restraints, strategic recommendations, and market players.
To Get more Insights, Request a Free Sample
Gear Box Market: Overview
The growth of the gear box market is fueled by rising global demand across various industries and applications. The report highlights lucrative opportunities, analyzing cost structures, key segments, emerging trends, regional dynamics, and advancements by leading players to provide comprehensive market insights. The gear box market report offers a detailed industry analysis from 2024 to 2032, combining quantitative and qualitative insights. It examines key factors such as pricing, market penetration, GDP impact, industry dynamics, major players, consumer behavior, and socio-economic conditions. Structured into multiple sections, the report provides a comprehensive perspective on the market from all angles.
Key sections of the gear box market report include market segments, outlook, competitive landscape, and company profiles. Market Segments offer in-depth details based on Product, Application, and other relevant classifications to support strategic marketing initiatives. Market Outlook thoroughly analyzes market trends, growth drivers, restraints, opportunities, challenges, Porter’s Five Forces framework, macroeconomic factors, value chain analysis, and pricing trends shaping the market now and in the future. The Competitive Landscape and Company Profiles section highlights major players, their strategies, and market positioning to guide investment and business decisions. The report also identifies innovation trends, new business opportunities, and investment prospects for the forecast period.
Key Highlights:
- As per the analysis shared by our research analyst, the global gear box market is estimated to grow annually at a CAGR of around 4.2% over the forecast period (2024-2032).
- In terms of revenue, the global gear box market size was valued at around USD 30.61 Billion in 2023 and is projected to reach USD 46.4 Billion by 2032.
- The market is projected to grow at a significant rate due to increasing industrial automation, the growth of renewable energy sectors like wind power, and the rising demand for efficient power transmission in the automotive industry, including electric vehicles.
- Based on the Product, the Helical Gearbox segment is growing at a high rate and will continue to dominate the global market as per industry projections.
- On the basis of Application, the Marine segment is anticipated to command the largest market share.
- Based on region, Asia-Pacific is projected to dominate the global market during the forecast period.
Gear Box Market: Report Scope
This report thoroughly analyzes the gear box market, exploring its historical trends, current state, and future projections. The market estimates presented result from a robust research methodology, incorporating primary research, secondary sources, and expert opinions. These estimates are influenced by the prevailing market dynamics as well as key economic, social, and political factors. Furthermore, the report considers the impact of regulations, government expenditures, and advancements in research and development on the market. Both positive and negative shifts are evaluated to ensure a comprehensive and accurate market outlook.
| Report Attributes | Report Details |
|---|---|
| Report Name | Gear Box Market |
| Market Size in 2023 | USD 30.61 Billion |
| Market Forecast in 2032 | USD 46.4 Billion |
| Growth Rate | CAGR of 4.2% |
| Number of Pages | 198 |
| Key Companies Covered | David Brown, Emerson Electric, Rotork Plc, Bonfiglioli Group, FLSmidth MAAG, ZF Friedrichshafen, HMA Group, SEW, Katsa, Kumera, Renold, Radicon, Sumitomo Heavy IndustriesLtd (Hansen), Northern Engineering, Falk Gear (Rexnord), Flender, NORD Drivesystems, |
| Segments Covered | By Product, By Application, and By Region |
| Regions Covered | North America, Europe, Asia Pacific (APAC), Latin America, Middle East, and Africa (MEA) |
| Base Year | 2023 |
| Historical Year | 2018 to 2023 |
| Forecast Year | 2024 to 2032 |
| Customization Scope | Avail customized purchase options to meet your exact research needs. Request For Customization |
Gear Box Market: Dynamics
Key Growth Drivers:
The gearbox market is experiencing steady growth, primarily fueled by the increasing demand for efficient power transmission and speed control solutions across diverse industrial applications. The growing adoption of automation and robotics in manufacturing, requiring precise motion control, is a major catalyst. The expanding renewable energy sector, particularly wind turbines, relies heavily on high-performance gearboxes. Technological advancements in gear design, materials, and manufacturing processes are enhancing the performance and durability of gearboxes. Additionally, the increasing demand for customized gearboxes for specific applications, such as electric vehicles and aerospace systems, contributes to market expansion.
Restraints:
Despite the market's positive trajectory, several restraints impede its full potential. The high cost of specialized gearboxes, particularly those designed for high-power or high-precision applications, can deter some industries. The complexities associated with designing and manufacturing gearboxes, requiring specialized expertise and equipment, can create barriers to entry. Concerns regarding the noise and vibration generated by gearboxes in high-speed applications pose challenges. Furthermore, the need for regular maintenance and lubrication can increase operational costs. The cyclical nature of industrial activity and fluctuations in capital expenditure can also impact market stability.
Opportunities:
The gearbox market presents numerous opportunities for innovation and expansion. The development of high-efficiency gearboxes with reduced energy losses and improved power density can enhance performance and sustainability. The integration of smart sensors and monitoring systems into gearboxes can enable real-time performance tracking and predictive maintenance. The growing demand for lightweight and compact gearboxes for electric vehicles and aerospace applications offers niche market segments. The expansion of gearbox applications in emerging sectors, such as robotics and additive manufacturing, provides new market opportunities. Furthermore, the development of customized gearboxes with advanced materials, such as composites and ceramics, can cater to specialized applications.
Challenges:
The gearbox market faces several challenges that require strategic solutions. Ensuring the reliability and durability of gearboxes in diverse operating conditions and load scenarios is crucial. Maintaining consistent product quality and performance across diverse manufacturing facilities and customer requirements is essential. Adapting to the evolving needs and preferences of diverse industries, including the demand for high efficiency and low noise, necessitates continuous product development and innovation. Managing the complexities of gear design and manufacturing, particularly for high-speed and high-load applications, is critical. Additionally, addressing the skills gap and providing adequate training for gearbox installation, maintenance, and repair is paramount.
Gear Box Market: Segmentation Insights
The global gear box market is segmented based on Product, Application, and Region. All the segments of the gear box market have been analyzed based on present & future trends and the market is estimated from 2024 to 2032.
Based on Product, the global gear box market is divided into Helical Gearbox, Worm Reduction Gearbox, Planetary Gearbox, Others.
On the basis of Application, the global gear box market is bifurcated into Marine, Paper & Fiber, Mining & Minerals, Construction, Aerospace & Defense, Others.
Gear Box Market: Regional Insights
The Asia-Pacific (APAC) region dominates the global gearbox market, holding the largest market share due to rapid industrialization, expanding automotive production, and heavy investments in manufacturing and infrastructure. China, India, and Japan are the key contributors, driven by strong demand from the automotive, wind energy, and construction equipment sectors. Europe follows as the second-largest market, with Germany, Italy, and France leading due to advanced manufacturing capabilities and high adoption of precision gear systems in automotive and industrial applications.
North America shows steady growth, supported by the presence of major automotive OEMs and increasing renewable energy projects. The Middle East & Africa and Latin America are emerging markets, with growth fueled by mining, oil & gas, and construction activities. APAC's dominance is expected to persist, propelled by urbanization, automation, and rising electric vehicle production.
Gear Box Market: Competitive Landscape
The gear box market report offers a thorough analysis of both established and emerging players within the market. It includes a detailed list of key companies, categorized based on the types of products they offer and other relevant factors. The report also highlights the market entry year for each player, providing further context for the research analysis.
The "Global Gear Box Market" study offers valuable insights, focusing on the global market landscape, with an emphasis on major industry players such as;
- David Brown
- Emerson Electric
- Rotork Plc
- Bonfiglioli Group
- FLSmidth MAAG
- ZF Friedrichshafen
- HMA Group
- SEW
- Katsa
- Kumera
- Renold
- Radicon
- Sumitomo Heavy IndustriesLtd (Hansen)
- Northern Engineering
- Falk Gear (Rexnord)
- Flender
- NORD Drivesystems
- Eaton Corp
- Hale
The Global Gear Box Market is Segmented as Follows:
By Product
- Helical Gearbox
- Worm Reduction Gearbox
- Planetary Gearbox
- Others
By Application
- Marine
- Paper & Fiber
- Mining & Minerals
- Construction
- Aerospace & Defense
- Others
By Region
- North America
- The U.S.
- Canada
- Mexico
- Europe
- France
- The UK
- Spain
- Germany
- Italy
- Rest of Europe
- Asia Pacific
- China
- Japan
- India
- Australia
- South Korea
- Rest of Asia Pacific
- The Middle East & Africa
- Saudi Arabia
- UAE
- Egypt
- Kuwait
- South Africa
- Rest of the Middle East & Africa
- Latin America
- Brazil
- Argentina
- Rest of Latin America
Market Evolution
This section evaluates the market position of the product or service by examining its development pathway and competitive dynamics. It provides a detailed overview of the product's growth stages, including the early (historical) phase, the mid-stage, and anticipated future advancements influenced by innovation and emerging technologies.
Porter’s Analysis
Porter’s Five Forces framework offers a strategic lens for assessing competitor behavior and the positioning of key players in the gear box industry. This section explores the external factors shaping competitive dynamics and influencing market strategies in the years ahead. The analysis focuses on five critical forces:
- Competitive Rivalry
- Threat of New Entrants
- Threat of Substitutes
- Supplier Bargaining Power
- Buyer Bargaining Power
Value Chain & Market Attractiveness Analysis
The value chain analysis helps businesses optimize operations by mapping the product flow from suppliers to end consumers, identifying opportunities to streamline processes and gain a competitive edge. Segment-wise market attractiveness analysis evaluates key dimensions like product categories, demographics, and regions, assessing growth potential, market size, and profitability. This enables businesses to focus resources on high-potential segments for better ROI and long-term value.
PESTEL Analysis
PESTEL analysis is a powerful tool in market research reports that enhances market understanding by systematically examining the external macro-environmental factors influencing a business or industry. The acronym stands for Political, Economic, Social, Technological, Environmental, and Legal factors. By evaluating these dimensions, PESTEL analysis provides a comprehensive overview of the broader context within which a market operates, helping businesses identify potential opportunities and threats.
- Political factors assess government policies, stability, trade regulations, and political risks that could impact market operations.
- Economic factors examine variables like inflation, exchange rates, economic growth, and consumer spending power to determine market viability.
- Social factors explore cultural trends, demographics, and lifestyle changes that shape consumer behavior and preferences.
- Technological factors evaluate innovation, R&D, and technological advancements affecting product development and operational efficiencies.
- Environmental factors focus on sustainability, climate change impacts, and eco-friendly practices shaping market trends.
- Legal factors address compliance requirements, industry regulations, and intellectual property laws impacting market entry and operations.
Import-Export Analysis & Pricing Analysis
An import-export analysis is vital for market research, revealing global trade dynamics, trends, and opportunities. It examines trade volumes, product categories, and regional competitiveness, offering insights into supply chains and market demand. This section also analyzes past and future pricing trends, helping businesses optimize strategies and enabling consumers to assess product value effectively.
Gear Box Market: Company Profiles
The report identifies key players in the gear box market through competitive landscape and company profiles, evaluating their offerings, financial performance, strategies, and market positioning. It includes a SWOT analysis of the top 3-5 companies, assessing strengths, weaknesses, opportunities, and threats. The competitive landscape highlights rankings, recent activities (mergers, acquisitions, partnerships, product launches), and regional footprints using the Ace matrix. Customization is available to meet client-specific needs.
Regional & Industry Footprint
This section details the geographic reach, sales networks, and market penetration of companies profiled in the gear box report, showcasing their operations and distribution across regions. It analyzes the alignment of companies with specific industry verticals, highlighting the industries they serve and the scope of their products and services within those sectors.
Ace Matrix
This section categorizes companies into four distinct groups—Active, Cutting Edge, Innovator, and Emerging—based on their product and business strategies. The evaluation of product strategy focuses on aspects such as the range and depth of offerings, commitment to innovation, product functionalities, and scalability. Key elements like global reach, sector coverage, strategic acquisitions, and long-term growth plans are considered for business strategy. This analysis provides a detailed view of companies' position within the market and highlights their potential for future growth and development.
Research Methodology
The qualitative and quantitative insights for the gear box market are derived through a multi-faceted research approach, combining input from subject matter experts, primary research, and secondary data sources. Primary research includes gathering critical information via face-to-face or telephonic interviews, surveys, questionnaires, and feedback from industry professionals, key opinion leaders (KOLs), and customers. Regular interviews with industry experts are conducted to deepen the analysis and reinforce the existing data, ensuring a robust and well-rounded market understanding.
Secondary research for this report was carried out by the Market Research Store team, drawing on a variety of authoritative sources, such as:
- Official company websites, annual reports, financial statements, investor presentations, and SEC filings
- Internal and external proprietary databases, as well as relevant patent and regulatory databases
- Government publications, national statistical databases, and industry-specific market reports
- Media coverage, including news articles, press releases, and webcasts about market participants
- Paid industry databases for detailed market insights
Market Research Store conducted in-depth consultations with various key opinion leaders in the industry, including senior executives from top companies and regional leaders from end-user organizations. This effort aimed to gather critical insights on factors such as the market share of dominant brands in specific countries and regions, along with pricing strategies for products and services.
To determine total sales data, the research team conducted primary interviews across multiple countries with influential stakeholders, including:
- Distributors
- Marketing, Brand, and Product Managers
- Procurement and Production Managers
- Sales and Regional Sales Managers, Country Managers
- Technical Specialists
- C-Level Executives
These subject matter experts, with their extensive industry experience, helped validate and refine the findings. For secondary research, data was sourced from a wide range of materials, including online resources, company annual reports, industry publications, research papers, association reports, and government websites. These various sources provide a comprehensive and well-rounded perspective on the market.
Frequently Asked Questions
Table Of Content
List of Tables and Figures Figure Product Picture of Gear Box Table Product Specification of Gear Box Figure Market Concentration Ratio and Market Maturity Analysis of Gear Box Figure Global Gear Box Value ($) and Growth Rate from 2014-2024 Table Different Types of Gear Box Figure Global Gear Box Value ($) Segment by Type from 2014-2019 Figure Standard Gearbox Picture Figure Precision Gearbox Picture Table Different Applications of Gear Box Figure Global Gear Box Value ($) Segment by Applications from 2014-2019 Figure Passenger Vehicle Picture Figure Commercial Vehicle Picture Table Research Regions of Gear Box Figure North America Gear Box Production Value ($) and Growth Rate (2014-2019) Figure Europe Gear Box Production Value ($) and Growth Rate (2014-2019) Table China Gear Box Production Value ($) and Growth Rate (2014-2019) Table Japan Gear Box Production Value ($) and Growth Rate (2014-2019) Table Middle East & Africa Gear Box Production Value ($) and Growth Rate (2014-2019) Table India Gear Box Production Value ($) and Growth Rate (2014-2019) Table South America Gear Box Production Value ($) and Growth Rate (2014-2019) Table Emerging Countries of Gear Box Table Growing Market of Gear Box Figure Industry Chain Analysis of Gear Box Table Upstream Raw Material Suppliers of Gear Box with Contact Information Table Major Players Manufacturing Base and Market Share ($) of Gear Box in 2018 Table Major Players Gear Box Product Types in 2018 Figure Production Process of Gear Box Figure Manufacturing Cost Structure of Gear Box Figure Channel Status of Gear Box Table Major Distributors of Gear Box with Contact Information Table Major Downstream Buyers of Gear Box with Contact Information Table Global Gear Box Value ($) by Type (2014-2019) Table Global Gear Box Value ($) Share by Type (2014-2019) Figure Global Gear Box Value ($) Share by Type (2014-2019) Table Global Gear Box Production by Type (2014-2019) Table Global Gear Box Production Share by Type (2014-2019) Figure Global Gear Box Production Share by Type (2014-2019) Figure Global Gear Box Value ($) and Growth Rate of Standard Gearbox Figure Global Gear Box Value ($) and Growth Rate of Precision Gearbox Figure Global Gear Box Price by Type (2014-2019) Table Global Gear Box Consumption by Application (2014-2019) Table Global Gear Box Consumption Market Share by Application (2014-2019) Figure Global Gear Box Consumption Market Share by Application (2014-2019) Table Downstream Buyers Introduction by Application Figure Global Gear Box Consumption and Growth Rate of Passenger Vehicle (2014-2019) Figure Global Gear Box Consumption and Growth Rate of Commercial Vehicle (2014-2019) Table Global Gear Box Value ($) by Region (2014-2019) Table Global Gear Box Value ($) Market Share by Region (2014-2019) Figure Global Gear Box Value ($) Market Share by Region (2014-2019) Table Global Gear Box Production by Region (2014-2019) Table Global Gear Box Production Market Share by Region (2014-2019) Figure Global Gear Box Production Market Share by Region (2014-2019) Table Global Gear Box Production, Value ($), Price and Gross Margin (2014-2019) Table North America Gear Box Production, Value ($), Price and Gross Margin (2014-2019) Table Europe Gear Box Production, Value ($), Price and Gross Margin (2014-2019) Table China Gear Box Production, Value ($), Price and Gross Margin (2014-2019) Table Japan Gear Box Production, Value ($), Price and Gross Margin (2014-2019) Table Middle East & Africa Gear Box Production, Value ($), Price and Gross Margin (2014-2019) Table India Gear Box Production, Value ($), Price and Gross Margin (2014-2019) Table South America Gear Box Production, Value ($), Price and Gross Margin (2014-2019) Table Global Gear Box Consumption by Regions (2014-2019) Figure Global Gear Box Consumption Share by Regions (2014-2019) Table North America Gear Box Production, Consumption, Export, Import (2014-2019) Table Europe Gear Box Production, Consumption, Export, Import (2014-2019) Table China Gear Box Production, Consumption, Export, Import (2014-2019) Table Japan Gear Box Production, Consumption, Export, Import (2014-2019) Table Middle East & Africa Gear Box Production, Consumption, Export, Import (2014-2019) Table India Gear Box Production, Consumption, Export, Import (2014-2019) Table South America Gear Box Production, Consumption, Export, Import (2014-2019) Figure North America Gear Box Production and Growth Rate Analysis Figure North America Gear Box Consumption and Growth Rate Analysis Figure North America Gear Box SWOT Analysis Figure Europe Gear Box Production and Growth Rate Analysis Figure Europe Gear Box Consumption and Growth Rate Analysis Figure Europe Gear Box SWOT Analysis Figure China Gear Box Production and Growth Rate Analysis Figure China Gear Box Consumption and Growth Rate Analysis Figure China Gear Box SWOT Analysis Figure Japan Gear Box Production and Growth Rate Analysis Figure Japan Gear Box Consumption and Growth Rate Analysis Figure Japan Gear Box SWOT Analysis Figure Middle East & Africa Gear Box Production and Growth Rate Analysis Figure Middle East & Africa Gear Box Consumption and Growth Rate Analysis Figure Middle East & Africa Gear Box SWOT Analysis Figure India Gear Box Production and Growth Rate Analysis Figure India Gear Box Consumption and Growth Rate Analysis Figure India Gear Box SWOT Analysis Figure South America Gear Box Production and Growth Rate Analysis Figure South America Gear Box Consumption and Growth Rate Analysis Figure South America Gear Box SWOT Analysis Figure Top 3 Market Share of Gear Box Companies Figure Top 6 Market Share of Gear Box Companies Table Mergers, Acquisitions and Expansion Analysis Table Company Profiles Table Product Introduction Table SEW Eurodrive Production, Value ($), Price, Gross Margin 2014-2019 Figure SEW Eurodrive Production and Growth Rate Figure SEW Eurodrive Value ($) Market Share 2014-2019 Figure SEW Eurodrive Market Share of Gear Box Segmented by Region in 2018 Table Company Profiles Table Product Introduction Table David Brown Engineering Production, Value ($), Price, Gross Margin 2014-2019 Figure David Brown Engineering Production and Growth Rate Figure David Brown Engineering Value ($) Market Share 2014-2019 Figure David Brown Engineering Market Share of Gear Box Segmented by Region in 2018 Table Company Profiles Table Product Introduction Table Curtis Machine Company Production, Value ($), Price, Gross Margin 2014-2019 Figure Curtis Machine Company Production and Growth Rate Figure Curtis Machine Company Value ($) Market Share 2014-2019 Figure Curtis Machine Company Market Share of Gear Box Segmented by Region in 2018 Table Company Profiles Table Product Introduction Table Rexnord Production, Value ($), Price, Gross Margin 2014-2019 Figure Rexnord Production and Growth Rate Figure Rexnord Value ($) Market Share 2014-2019 Figure Rexnord Market Share of Gear Box Segmented by Region in 2018 Table Company Profiles Table Product Introduction Table Brevini Power Transmission Production, Value ($), Price, Gross Margin 2014-2019 Figure Brevini Power Transmission Production and Growth Rate Figure Brevini Power Transmission Value ($) Market Share 2014-2019 Figure Brevini Power Transmission Market Share of Gear Box Segmented by Region in 2018 Table Company Profiles Table Product Introduction Table Oerlikon Graziano Drive Systems Production, Value ($), Price, Gross Margin 2014-2019 Figure Oerlikon Graziano Drive Systems Production and Growth Rate Figure Oerlikon Graziano Drive Systems Value ($) Market Share 2014-2019 Figure Oerlikon Graziano Drive Systems Market Share of Gear Box Segmented by Region in 2018 Table Company Profiles Table Product Introduction Table Emerson Electric Production, Value ($), Price, Gross Margin 2014-2019 Figure Emerson Electric Production and Growth Rate Figure Emerson Electric Value ($) Market Share 2014-2019 Figure Emerson Electric Market Share of Gear Box Segmented by Region in 2018 Table Company Profiles Table Product Introduction Table Siemens Production, Value ($), Price, Gross Margin 2014-2019 Figure Siemens Production and Growth Rate Figure Siemens Value ($) Market Share 2014-2019 Figure Siemens Market Share of Gear Box Segmented by Region in 2018 Table Company Profiles Table Product Introduction Table Cone Drive Operations Production, Value ($), Price, Gross Margin 2014-2019 Figure Cone Drive Operations Production and Growth Rate Figure Cone Drive Operations Value ($) Market Share 2014-2019 Figure Cone Drive Operations Market Share of Gear Box Segmented by Region in 2018 Table Company Profiles Table Product Introduction Table Bonfiglioli Production, Value ($), Price, Gross Margin 2014-2019 Figure Bonfiglioli Production and Growth Rate Figure Bonfiglioli Value ($) Market Share 2014-2019 Figure Bonfiglioli Market Share of Gear Box Segmented by Region in 2018 Table Company Profiles Table Product Introduction Table Horsburgh & Scott Production, Value ($), Price, Gross Margin 2014-2019 Figure Horsburgh & Scott Production and Growth Rate Figure Horsburgh & Scott Value ($) Market Share 2014-2019 Figure Horsburgh & Scott Market Share of Gear Box Segmented by Region in 2018 Table Company Profiles Table Product Introduction Table ABB Production, Value ($), Price, Gross Margin 2014-2019 Figure ABB Production and Growth Rate Figure ABB Value ($) Market Share 2014-2019 Figure ABB Market Share of Gear Box Segmented by Region in 2018 Table Global Gear Box Market Value ($) Forecast, by Type Table Global Gear Box Market Volume Forecast, by Type Figure Global Gear Box Market Value ($) and Growth Rate Forecast of Standard Gearbox (2019-2024) Figure Global Gear Box Market Volume and Growth Rate Forecast of Standard Gearbox (2019-2024) Figure Global Gear Box Market Value ($) and Growth Rate Forecast of Precision Gearbox (2019-2024) Figure Global Gear Box Market Volume and Growth Rate Forecast of Precision Gearbox (2019-2024) Table Global Market Value ($) Forecast by Application (2019-2024) Table Global Market Volume Forecast by Application (2019-2024) Figure Global Gear Box Consumption and Growth Rate of Passenger Vehicle (2014-2019) Figure Global Gear Box Consumption and Growth Rate of Commercial Vehicle (2014-2019) Figure Market Value ($) and Growth Rate Forecast of Commercial Vehicle (2019-2024) Figure Market Volume and Growth Rate Forecast of Commercial Vehicle (2019-2024) Figure North America Market Value ($) and Growth Rate Forecast (2019-2024) Table North America Consumption and Growth Rate Forecast (2019-2024) Figure Europe Market Value ($) and Growth Rate Forecast (2019-2024) Table Europe Consumption and Growth Rate Forecast (2019-2024) Figure China Market Value ($) and Growth Rate Forecast (2019-2024) Table China Consumption and Growth Rate Forecast (2019-2024) Figure Japan Market Value ($) and Growth Rate Forecast (2019-2024) Table Japan Consumption and Growth Rate Forecast (2019-2024) Figure Middle East & Africa Market Value ($) and Growth Rate Forecast (2019-2024) Table Middle East & Africa Consumption and Growth Rate Forecast (2019-2024) Figure India Market Value ($) and Growth Rate Forecast (2019-2024) Table India Consumption and Growth Rate Forecast (2019-2024) Figure South America Market Value ($) and Growth Rate Forecast (2019-2024) Table South America Consumption and Growth Rate Forecast (2019-2024) Figure Industry Resource/Technology/Labor Importance Analysis Table New Entrants SWOT Analysis Table New Project Analysis of Investment Recovery
Inquiry For Buying
Gear Box
Request Sample
Gear Box