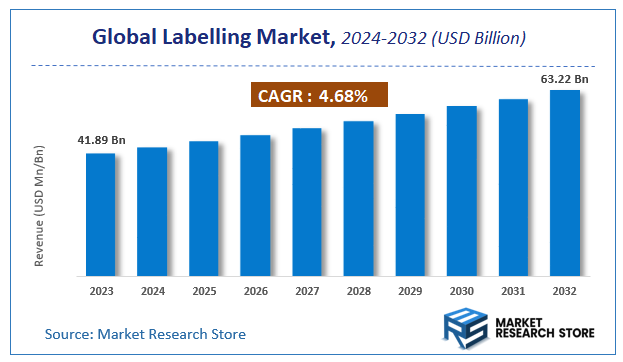
Labelling Market Size, Share, and Trends Analysis Report
CAGR :

| Market Size 2023 (Base Year) | USD 41.89 Billion |
| Market Size 2032 (Forecast Year) | USD 63.22 Billion |
| CAGR | 4.68% |
| Forecast Period | 2024 - 2032 |
| Historical Period | 2018 - 2023 |
Labelling Market Insights
As per the published report by Market Research Store, the Global Labelling Market size was estimated at USD 41.89 Billion in 2023 and is anticipated to reach reach USD 63.22 Billion by 2032, growing at a projected CAGR of 4.68% during the forecast period 2024-2032. The report provides a detailed analysis of the global Labelling Market, including market trends, market dynamics, and market opportunities during the forecast period (2024-2032). It delves deeper into several market facets, such as market definition, size, growth, forecast, segmentation, competitive analysis, growth drivers, restraints, financial analysis, SWOT analysis, PORTER’s five force analysis, PESTEL analysis, market share analysis, cost-benefit analysis, challenges, restraints, strategic recommendations, and market players.
To Get more Insights, Request a Free Sample
Labelling Market: Overview
The growth of the labelling market is fueled by rising global demand across various industries and applications. The report highlights lucrative opportunities, analyzing cost structures, key segments, emerging trends, regional dynamics, and advancements by leading players to provide comprehensive market insights. The labelling market report offers a detailed industry analysis from 2024 to 2032, combining quantitative and qualitative insights. It examines key factors such as pricing, market penetration, GDP impact, industry dynamics, major players, consumer behavior, and socio-economic conditions. Structured into multiple sections, the report provides a comprehensive perspective on the market from all angles.
Key sections of the labelling market report include market segments, outlook, competitive landscape, and company profiles. Market Segments offer in-depth details based on Material, Product Type, Printing Technology, Ink Type, End Use, and other relevant classifications to support strategic marketing initiatives. Market Outlook thoroughly analyzes market trends, growth drivers, restraints, opportunities, challenges, Porter’s Five Forces framework, macroeconomic factors, value chain analysis, and pricing trends shaping the market now and in the future. The Competitive Landscape and Company Profiles section highlights major players, their strategies, and market positioning to guide investment and business decisions. The report also identifies innovation trends, new business opportunities, and investment prospects for the forecast period.
Key Highlights:
- As per the analysis shared by our research analyst, the global labelling market is estimated to grow annually at a CAGR of around 4.68% over the forecast period (2024-2032).
- In terms of revenue, the global labelling market size was valued at around USD 41.89 Billion in 2023 and is projected to reach USD 63.22 Billion by 2032.
- The market is projected to grow at a significant rate due to rising demand for packaged goods, stringent regulatory requirements, technological advancements in labelling systems, and increasing consumer demand for product information and sustainability.
- Based on the Material, the Plastic Includes Polyethylene (Pe) segment is growing at a high rate and will continue to dominate the global market as per industry projections.
- On the basis of Product Type, the Pressure Sensitive Labels segment is anticipated to command the largest market share.
- In terms of Printing Technology, the Flexographic Printing segment is projected to lead the global market.
- By Ink Type, the Solvent Based segment is predicted to dominate the global market.
- Based on the End Use, the Food segment is expected to swipe the largest market share.
- Based on region, Asia-Pacific is projected to dominate the global market during the forecast period.
Labelling Market: Report Scope
This report thoroughly analyzes the labelling market, exploring its historical trends, current state, and future projections. The market estimates presented result from a robust research methodology, incorporating primary research, secondary sources, and expert opinions. These estimates are influenced by the prevailing market dynamics as well as key economic, social, and political factors. Furthermore, the report considers the impact of regulations, government expenditures, and advancements in research and development on the market. Both positive and negative shifts are evaluated to ensure a comprehensive and accurate market outlook.
| Report Attributes | Report Details |
|---|---|
| Report Name | Labelling Market |
| Market Size in 2023 | USD 41.89 Billion |
| Market Forecast in 2032 | USD 63.22 Billion |
| Growth Rate | CAGR of 4.68% |
| Number of Pages | 159 |
| Key Companies Covered | Fuji Seal International Inc., 3M Company, Multi-Color Corporation, AVERY DENNISON CORPORATION, CCL Industries, UPM Global, Toray Plastics (America) Inc., Huhtamäki Oyj, Amcor plc, Klöckner Pentaplast, Allen Plastic Industries Co. Ltd., Lintec Corporation, BRADY Corp, Derksen Co., Sigma Aldrich Corporation, JK Labels |
| Segments Covered | By Material, By Product Type, By Printing Technology, By Ink Type, By End Use, and By Region |
| Regions Covered | North America, Europe, Asia Pacific (APAC), Latin America, Middle East, and Africa (MEA) |
| Base Year | 2023 |
| Historical Year | 2018 to 2023 |
| Forecast Year | 2024 to 2032 |
| Customization Scope | Avail customized purchase options to meet your exact research needs. Request For Customization |
Labelling Market: Dynamics
Key Growth Drivers
The labelling market is currently experiencing significant growth fueled by several interconnected factors. The relentless expansion of the Fast-Moving Consumer Goods (FMCG) sector globally necessitates extensive product labelling for identification, branding, and conveying crucial information to consumers, including ingredients, nutritional facts, and usage instructions. The burgeoning e-commerce industry further amplifies this demand, requiring labels for shipping, tracking, and returns management, ensuring efficient logistics and inventory control. Stringent and evolving government regulations across various industries, particularly in food and pharmaceuticals, mandate detailed and accurate labelling to ensure consumer safety and transparency, driving the adoption of more sophisticated and informative labels. Moreover, the increasing emphasis on brand differentiation and visual appeal in marketing strategies leads companies to invest in high-quality, aesthetically pleasing labels that capture consumer attention and build brand recognition. The rising adoption of track and trace technologies, such as barcodes and RFID, for supply chain optimization and anti-counterfeiting measures also significantly contributes to the growth of the labelling market.
Restraints
Despite the robust growth drivers, the labelling market faces certain limitations and restraints. The volatility in raw material prices, particularly for paper, plastic films, adhesives, and printing inks, can significantly impact the production costs for label manufacturers, potentially squeezing profit margins. The increasing environmental concerns and regulations regarding waste and recyclability are pushing the market towards more sustainable labelling solutions, which may involve higher initial costs or require significant research and development efforts. The need for global companies to comply with diverse and often conflicting labelling regulations across different international markets adds complexity and cost to their operations. Furthermore, the potential for counterfeiting and the need for sophisticated anti-counterfeiting labels can increase production costs and complexity. The increasing preference for digital information delivery in some sectors might also pose a long-term restraint on the reliance solely on physical labels.
Opportunities
The labelling market is rife with opportunities for innovation and expansion. The growing demand for sustainable and eco-friendly labelling solutions, including biodegradable, recyclable, and compostable labels, presents a significant avenue for manufacturers to develop and market environmentally responsible products, catering to the increasing consumer and regulatory focus on sustainability. Advancements in digital printing technologies offer opportunities for greater customization, short-run printing, and variable data printing, enabling personalized and on-demand labelling solutions for marketing campaigns and product variations. The integration of smart technologies into labels, such as NFC, RFID, and QR codes, opens up possibilities for enhanced product tracking, authentication, consumer engagement through interactive content, and real-time information sharing. The expansion of end-use industries in emerging economies, coupled with rising consumer spending, presents a substantial growth opportunity for label manufacturers to cater to new markets and increasing demand for packaged goods. Moreover, the growing need for advanced security and anti-counterfeiting labels, particularly in pharmaceuticals and luxury goods, offers a niche market for specialized label solutions.
Challenges
The labelling market encounters several challenges that require strategic navigation. Intense competition among a large number of label manufacturers, both global and regional, necessitates continuous innovation in terms of design, functionality, and cost-effectiveness to maintain market share. Keeping pace with the rapidly evolving technologies in printing, materials, and smart features requires significant investment in research and development and infrastructure upgrades. Ensuring compliance with increasingly stringent and diverse global regulatory requirements demands robust quality control processes and a deep understanding of international standards. Managing the complexities of global supply chains and potential disruptions in the availability of raw materials can impact production schedules and costs. Furthermore, educating end-users about the benefits and functionalities of advanced labelling technologies, such as smart labels, and overcoming potential adoption barriers remains a challenge. The need to balance cost-effectiveness with the increasing demand for sophisticated and sustainable labelling solutions also presents a continuous challenge for manufacturers.
Labelling Market: Segmentation Insights
The global labelling market is segmented based on Material, Product Type, Printing Technology, Ink Type, End Use, and Region. All the segments of the labelling market have been analyzed based on present & future trends and the market is estimated from 2024 to 2032.
Based on Material, the global labelling market is divided into Plastic Includes Polyethylene (Pe), Polypropylene (Pp), Polyvinyl Chloride (Pvc), Polyethylene Terephthalate (Pet).
On the basis of Product Type, the global labelling market is bifurcated into Pressure Sensitive Labels, Shrink Labels, Stretch Labels, Wet Glue Labels And Others (In-Mold, Pre-Gummed, Etc.).
In terms of Printing Technology, the global labelling market is categorized into Flexographic Printing, Digital Printing, Gravure Printing, Offset Printing And Letterpress Printing.
Based on Ink Type, the global labelling market is split into Solvent Based, Water Based, Uv Based And Others (Latex Based, Etc.)..
By End Use, the global labelling market is divided into Food, Beverages, Pharmaceutical, Cosmetics & Personal Care, Homecare & Toiletries, Chemicals, Automobiles.
Labelling Market: Regional Insights
The global labelling market is experiencing steady growth, driven by increasing demand from industries such as food & beverage, pharmaceuticals, and consumer goods, along with advancements in smart and sustainable labeling solutions. Asia-Pacific (APAC) dominates the market, accounting for the largest revenue share, due to rapid industrialization, expanding retail sectors, and stringent labeling regulations in countries like China, India, and Japan. The region’s booming e-commerce and packaged food industries further fuel demand. North America follows closely, supported by high adoption of advanced labeling technologies, strict FDA compliance requirements, and a strong presence of key market players in the U.S. and Canada. Europe remains a significant market, with growth driven by sustainability initiatives, eco-friendly labeling trends, and robust pharmaceutical labeling standards in Germany, France, and the U.K. While APAC leads, Latin America and the Middle East & Africa are emerging as high-growth regions due to increasing consumer awareness and retail modernization. APAC’s dominance is expected to persist, bolstered by its manufacturing prowess and rising disposable incomes.
Labelling Market: Competitive Landscape
The labelling market Report offers a thorough analysis of both established and emerging players within the market. It includes a detailed list of key companies, categorized based on the types of products they offer and other relevant factors. The report also highlights the market entry year for each player, providing further context for the research analysis.
The "Global Labelling Market" study offers valuable insights, focusing on the global market landscape, with an emphasis on major industry players such as;
- Fuji Seal International Inc.
- 3M Company
- Multi-Color Corporation
- AVERY DENNISON CORPORATION
- CCL Industries
- UPM Global
- Toray Plastics (America) Inc.
- Huhtamäki Oyj
- Amcor plc
- Klöckner Pentaplast
- Allen Plastic Industries Co. Ltd.
- Lintec Corporation
- BRADY Corp
- Derksen Co.
- Sigma Aldrich Corporation
- JK Labels
The Global Labelling Market is Segmented as Follows:
By Material
- Plastic Includes Polyethylene (Pe)
- Polypropylene (Pp)
- Polyvinyl Chloride (Pvc)
- Polyethylene Terephthalate (Pet)
By Product Type
- Pressure Sensitive Labels
- Shrink Labels
- Stretch Labels
- Wet Glue Labels And Others (In-Mold
- Pre-Gummed
- Etc.)
By Printing Technology
- Flexographic Printing
- Digital Printing
- Gravure Printing
- Offset Printing And Letterpress Printing
By Ink Type
- Solvent Based
- Water Based
- Uv Based And Others (Latex Based
- Etc.).
By End Use
- Food
- Beverages
- Pharmaceutical
- Cosmetics & Personal Care
- Homecare & Toiletries
- Chemicals
- Automobiles
By Region
- North America
- The U.S.
- Canada
- Mexico
- Europe
- France
- The UK
- Spain
- Germany
- Italy
- Rest of Europe
- Asia Pacific
- China
- Japan
- India
- Australia
- South Korea
- Rest of Asia Pacific
- The Middle East & Africa
- Saudi Arabia
- UAE
- Egypt
- Kuwait
- South Africa
- Rest of the Middle East & Africa
- Latin America
- Brazil
- Argentina
- Rest of Latin America
Market Evolution
This section evaluates the market position of the product or service by examining its development pathway and competitive dynamics. It provides a detailed overview of the product's growth stages, including the early (historical) phase, the mid-stage, and anticipated future advancements influenced by innovation and emerging technologies.
Porter’s Analysis
Porter’s Five Forces framework offers a strategic lens for assessing competitor behavior and the positioning of key players in the labelling industry. This section explores the external factors shaping competitive dynamics and influencing market strategies in the years ahead. The analysis focuses on five critical forces:
- Competitive Rivalry
- Threat of New Entrants
- Threat of Substitutes
- Supplier Bargaining Power
- Buyer Bargaining Power
Value Chain & Market Attractiveness Analysis
The value chain analysis helps businesses optimize operations by mapping the product flow from suppliers to end consumers, identifying opportunities to streamline processes and gain a competitive edge. Segment-wise market attractiveness analysis evaluates key dimensions like product categories, demographics, and regions, assessing growth potential, market size, and profitability. This enables businesses to focus resources on high-potential segments for better ROI and long-term value.
PESTEL Analysis
PESTEL analysis is a powerful tool in market research reports that enhances market understanding by systematically examining the external macro-environmental factors influencing a business or industry. The acronym stands for Political, Economic, Social, Technological, Environmental, and Legal factors. By evaluating these dimensions, PESTEL analysis provides a comprehensive overview of the broader context within which a market operates, helping businesses identify potential opportunities and threats.
- Political factors assess government policies, stability, trade regulations, and political risks that could impact market operations.
- Economic factors examine variables like inflation, exchange rates, economic growth, and consumer spending power to determine market viability.
- Social factors explore cultural trends, demographics, and lifestyle changes that shape consumer behavior and preferences.
- Technological factors evaluate innovation, R&D, and technological advancements affecting product development and operational efficiencies.
- Environmental factors focus on sustainability, climate change impacts, and eco-friendly practices shaping market trends.
- Legal factors address compliance requirements, industry regulations, and intellectual property laws impacting market entry and operations.
Import-Export Analysis & Pricing Analysis
An import-export analysis is vital for market research, revealing global trade dynamics, trends, and opportunities. It examines trade volumes, product categories, and regional competitiveness, offering insights into supply chains and market demand. This section also analyzes past and future pricing trends, helping businesses optimize strategies and enabling consumers to assess product value effectively.
Labelling Market: Company Profiles
The report identifies key players in the labelling market through a competitive landscape and company profiles, evaluating their offerings, financial performance, strategies, and market positioning. It includes a SWOT analysis of the top 3-5 companies, assessing strengths, weaknesses, opportunities, and threats. The competitive landscape highlights rankings, recent activities (mergers, acquisitions, partnerships, product launches), and regional footprints using the Ace matrix. Customization is available to meet client-specific needs.
Regional & Industry Footprint
This section details the geographic reach, sales networks, and market penetration of companies profiled in the labelling report, showcasing their operations and distribution across regions. It analyzes the alignment of companies with specific industry verticals, highlighting the industries they serve and the scope of their products and services within those sectors.
Ace Matrix
This section categorizes companies into four distinct groups—Active, Cutting Edge, Innovator, and Emerging—based on their product and business strategies. The evaluation of product strategy focuses on aspects such as the range and depth of offerings, commitment to innovation, product functionalities, and scalability. Key elements like global reach, sector coverage, strategic acquisitions, and long-term growth plans are considered for business strategy. This analysis provides a detailed view of companies' position within the market and highlights their potential for future growth and development.
Research Methodology
The qualitative and quantitative insights for the labelling market are derived through a multi-faceted research approach, combining input from subject matter experts, primary research, and secondary data sources. Primary research includes gathering critical information via face-to-face or telephonic interviews, surveys, questionnaires, and feedback from industry professionals, key opinion leaders (KOLs), and customers. Regular interviews with industry experts are conducted to deepen the analysis and reinforce the existing data, ensuring a robust and well-rounded market understanding.
Secondary research for this report was carried out by the Market Research Store team, drawing on a variety of authoritative sources, such as:
- Official company websites, annual reports, financial statements, investor presentations, and SEC filings
- Internal and external proprietary databases, as well as relevant patent and regulatory databases
- Government publications, national statistical databases, and industry-specific market reports
- Media coverage, including news articles, press releases, and webcasts about market participants
- Paid industry databases for detailed market insights
Market Research Store conducted in-depth consultations with various key opinion leaders in the industry, including senior executives from top companies and regional leaders from end-user organizations. This effort aimed to gather critical insights on factors such as the market share of dominant brands in specific countries and regions, along with pricing strategies for products and services.
To determine total sales data, the research team conducted primary interviews across multiple countries with influential stakeholders, including:
- Distributors
- Marketing, Brand, and Product Managers
- Procurement and Production Managers
- Sales and Regional Sales Managers, Country Managers
- Technical Specialists
- C-Level Executives
These subject matter experts, with their extensive industry experience, helped validate and refine the findings. For secondary research, data were sourced from a wide range of materials, including online resources, company annual reports, industry publications, research papers, association reports, and government websites. These various sources provide a comprehensive and well-rounded perspective on the market.
Frequently Asked Questions
Table Of Content
List of Tables and Figures Figure Product Picture of Labelling Table Product Specification of Labelling Figure Market Concentration Ratio and Market Maturity Analysis of Labelling Figure Global Labelling Value ($) and Growth Rate from 2014-2024 Table Different Types of Labelling Figure Global Labelling Value ($) Segment by Type from 2014-2019 Figure Paper Labels Picture Figure Plastic Labels Picture Figure Adhesive Labels Picture Figure Ink Labels Picture Table Different Applications of Labelling Figure Global Labelling Value ($) Segment by Applications from 2014-2019 Figure Pressure Sensitive Picture Figure Glue-applied Picture Figure Heat-Shrink & Stretch Sleeve Picture Figure In-mold Labels Picture Table Research Regions of Labelling Figure North America Labelling Production Value ($) and Growth Rate (2014-2019) Figure Europe Labelling Production Value ($) and Growth Rate (2014-2019) Table China Labelling Production Value ($) and Growth Rate (2014-2019) Table Japan Labelling Production Value ($) and Growth Rate (2014-2019) Table Middle East & Africa Labelling Production Value ($) and Growth Rate (2014-2019) Table India Labelling Production Value ($) and Growth Rate (2014-2019) Table South America Labelling Production Value ($) and Growth Rate (2014-2019) Table Emerging Countries of Labelling Table Growing Market of Labelling Figure Industry Chain Analysis of Labelling Table Upstream Raw Material Suppliers of Labelling with Contact Information Table Major Players Manufacturing Base and Market Share ($) of Labelling in 2018 Table Major Players Labelling Product Types in 2018 Figure Production Process of Labelling Figure Manufacturing Cost Structure of Labelling Figure Channel Status of Labelling Table Major Distributors of Labelling with Contact Information Table Major Downstream Buyers of Labelling with Contact Information Table Global Labelling Value ($) by Type (2014-2019) Table Global Labelling Value ($) Share by Type (2014-2019) Figure Global Labelling Value ($) Share by Type (2014-2019) Table Global Labelling Production by Type (2014-2019) Table Global Labelling Production Share by Type (2014-2019) Figure Global Labelling Production Share by Type (2014-2019) Figure Global Labelling Value ($) and Growth Rate of Paper Labels Figure Global Labelling Value ($) and Growth Rate of Plastic Labels Figure Global Labelling Value ($) and Growth Rate of Adhesive Labels Figure Global Labelling Value ($) and Growth Rate of Ink Labels Figure Global Labelling Price by Type (2014-2019) Table Global Labelling Consumption by Application (2014-2019) Table Global Labelling Consumption Market Share by Application (2014-2019) Figure Global Labelling Consumption Market Share by Application (2014-2019) Table Downstream Buyers Introduction by Application Figure Global Labelling Consumption and Growth Rate of Pressure Sensitive (2014-2019) Figure Global Labelling Consumption and Growth Rate of Glue-applied (2014-2019) Figure Global Labelling Consumption and Growth Rate of Heat-Shrink & Stretch Sleeve (2014-2019) Figure Global Labelling Consumption and Growth Rate of In-mold Labels (2014-2019) Table Global Labelling Value ($) by Region (2014-2019) Table Global Labelling Value ($) Market Share by Region (2014-2019) Figure Global Labelling Value ($) Market Share by Region (2014-2019) Table Global Labelling Production by Region (2014-2019) Table Global Labelling Production Market Share by Region (2014-2019) Figure Global Labelling Production Market Share by Region (2014-2019) Table Global Labelling Production, Value ($), Price and Gross Margin (2014-2019) Table North America Labelling Production, Value ($), Price and Gross Margin (2014-2019) Table Europe Labelling Production, Value ($), Price and Gross Margin (2014-2019) Table China Labelling Production, Value ($), Price and Gross Margin (2014-2019) Table Japan Labelling Production, Value ($), Price and Gross Margin (2014-2019) Table Middle East & Africa Labelling Production, Value ($), Price and Gross Margin (2014-2019) Table India Labelling Production, Value ($), Price and Gross Margin (2014-2019) Table South America Labelling Production, Value ($), Price and Gross Margin (2014-2019) Table Global Labelling Consumption by Regions (2014-2019) Figure Global Labelling Consumption Share by Regions (2014-2019) Table North America Labelling Production, Consumption, Export, Import (2014-2019) Table Europe Labelling Production, Consumption, Export, Import (2014-2019) Table China Labelling Production, Consumption, Export, Import (2014-2019) Table Japan Labelling Production, Consumption, Export, Import (2014-2019) Table Middle East & Africa Labelling Production, Consumption, Export, Import (2014-2019) Table India Labelling Production, Consumption, Export, Import (2014-2019) Table South America Labelling Production, Consumption, Export, Import (2014-2019) Figure North America Labelling Production and Growth Rate Analysis Figure North America Labelling Consumption and Growth Rate Analysis Figure North America Labelling SWOT Analysis Figure Europe Labelling Production and Growth Rate Analysis Figure Europe Labelling Consumption and Growth Rate Analysis Figure Europe Labelling SWOT Analysis Figure China Labelling Production and Growth Rate Analysis Figure China Labelling Consumption and Growth Rate Analysis Figure China Labelling SWOT Analysis Figure Japan Labelling Production and Growth Rate Analysis Figure Japan Labelling Consumption and Growth Rate Analysis Figure Japan Labelling SWOT Analysis Figure Middle East & Africa Labelling Production and Growth Rate Analysis Figure Middle East & Africa Labelling Consumption and Growth Rate Analysis Figure Middle East & Africa Labelling SWOT Analysis Figure India Labelling Production and Growth Rate Analysis Figure India Labelling Consumption and Growth Rate Analysis Figure India Labelling SWOT Analysis Figure South America Labelling Production and Growth Rate Analysis Figure South America Labelling Consumption and Growth Rate Analysis Figure South America Labelling SWOT Analysis Figure Top 3 Market Share of Labelling Companies Figure Top 6 Market Share of Labelling Companies Table Mergers, Acquisitions and Expansion Analysis Table Company Profiles Table Product Introduction Table Wepackit Production, Value ($), Price, Gross Margin 2014-2019 Figure Wepackit Production and Growth Rate Figure Wepackit Value ($) Market Share 2014-2019 Figure Wepackit Market Share of Labelling Segmented by Region in 2018 Table Company Profiles Table Product Introduction Table SATO America Production, Value ($), Price, Gross Margin 2014-2019 Figure SATO America Production and Growth Rate Figure SATO America Value ($) Market Share 2014-2019 Figure SATO America Market Share of Labelling Segmented by Region in 2018 Table Company Profiles Table Product Introduction Table Edwards Label Production, Value ($), Price, Gross Margin 2014-2019 Figure Edwards Label Production and Growth Rate Figure Edwards Label Value ($) Market Share 2014-2019 Figure Edwards Label Market Share of Labelling Segmented by Region in 2018 Table Company Profiles Table Product Introduction Table Allen Plastic Production, Value ($), Price, Gross Margin 2014-2019 Figure Allen Plastic Production and Growth Rate Figure Allen Plastic Value ($) Market Share 2014-2019 Figure Allen Plastic Market Share of Labelling Segmented by Region in 2018 Table Company Profiles Table Product Introduction Table Printpack Production, Value ($), Price, Gross Margin 2014-2019 Figure Printpack Production and Growth Rate Figure Printpack Value ($) Market Share 2014-2019 Figure Printpack Market Share of Labelling Segmented by Region in 2018 Table Company Profiles Table Product Introduction Table CCL Industries Production, Value ($), Price, Gross Margin 2014-2019 Figure CCL Industries Production and Growth Rate Figure CCL Industries Value ($) Market Share 2014-2019 Figure CCL Industries Market Share of Labelling Segmented by Region in 2018 Table Company Profiles Table Product Introduction Table Mepco Production, Value ($), Price, Gross Margin 2014-2019 Figure Mepco Production and Growth Rate Figure Mepco Value ($) Market Share 2014-2019 Figure Mepco Market Share of Labelling Segmented by Region in 2018 Table Company Profiles Table Product Introduction Table Bemis Company Production, Value ($), Price, Gross Margin 2014-2019 Figure Bemis Company Production and Growth Rate Figure Bemis Company Value ($) Market Share 2014-2019 Figure Bemis Company Market Share of Labelling Segmented by Region in 2018 Table Company Profiles Table Product Introduction Table Clabro Label Production, Value ($), Price, Gross Margin 2014-2019 Figure Clabro Label Production and Growth Rate Figure Clabro Label Value ($) Market Share 2014-2019 Figure Clabro Label Market Share of Labelling Segmented by Region in 2018 Table Company Profiles Table Product Introduction Table Sovereign Labelling System Production, Value ($), Price, Gross Margin 2014-2019 Figure Sovereign Labelling System Production and Growth Rate Figure Sovereign Labelling System Value ($) Market Share 2014-2019 Figure Sovereign Labelling System Market Share of Labelling Segmented by Region in 2018 Table Company Profiles Table Product Introduction Table MPI Label System Production, Value ($), Price, Gross Margin 2014-2019 Figure MPI Label System Production and Growth Rate Figure MPI Label System Value ($) Market Share 2014-2019 Figure MPI Label System Market Share of Labelling Segmented by Region in 2018 Table Company Profiles Table Product Introduction Table Clondalkin Group Production, Value ($), Price, Gross Margin 2014-2019 Figure Clondalkin Group Production and Growth Rate Figure Clondalkin Group Value ($) Market Share 2014-2019 Figure Clondalkin Group Market Share of Labelling Segmented by Region in 2018 Table Company Profiles Table Product Introduction Table Anchor Packaging Production, Value ($), Price, Gross Margin 2014-2019 Figure Anchor Packaging Production and Growth Rate Figure Anchor Packaging Value ($) Market Share 2014-2019 Figure Anchor Packaging Market Share of Labelling Segmented by Region in 2018 Table Company Profiles Table Product Introduction Table Hammer Packaging Production, Value ($), Price, Gross Margin 2014-2019 Figure Hammer Packaging Production and Growth Rate Figure Hammer Packaging Value ($) Market Share 2014-2019 Figure Hammer Packaging Market Share of Labelling Segmented by Region in 2018 Table Company Profiles Table Product Introduction Table Metro Label Production, Value ($), Price, Gross Margin 2014-2019 Figure Metro Label Production and Growth Rate Figure Metro Label Value ($) Market Share 2014-2019 Figure Metro Label Market Share of Labelling Segmented by Region in 2018 Table Company Profiles Table Product Introduction Table Taylor Label Production, Value ($), Price, Gross Margin 2014-2019 Figure Taylor Label Production and Growth Rate Figure Taylor Label Value ($) Market Share 2014-2019 Figure Taylor Label Market Share of Labelling Segmented by Region in 2018 Table Company Profiles Table Product Introduction Table Jet Label Production, Value ($), Price, Gross Margin 2014-2019 Figure Jet Label Production and Growth Rate Figure Jet Label Value ($) Market Share 2014-2019 Figure Jet Label Market Share of Labelling Segmented by Region in 2018 Table Company Profiles Table Product Introduction Table Best Label Company Production, Value ($), Price, Gross Margin 2014-2019 Figure Best Label Company Production and Growth Rate Figure Best Label Company Value ($) Market Share 2014-2019 Figure Best Label Company Market Share of Labelling Segmented by Region in 2018 Table Company Profiles Table Product Introduction Table Sleeve Seal Production, Value ($), Price, Gross Margin 2014-2019 Figure Sleeve Seal Production and Growth Rate Figure Sleeve Seal Value ($) Market Share 2014-2019 Figure Sleeve Seal Market Share of Labelling Segmented by Region in 2018 Table Company Profiles Table Product Introduction Table Nova Custom Label Production, Value ($), Price, Gross Margin 2014-2019 Figure Nova Custom Label Production and Growth Rate Figure Nova Custom Label Value ($) Market Share 2014-2019 Figure Nova Custom Label Market Share of Labelling Segmented by Region in 2018 Table Company Profiles Table Product Introduction Table Century Label Production, Value ($), Price, Gross Margin 2014-2019 Figure Century Label Production and Growth Rate Figure Century Label Value ($) Market Share 2014-2019 Figure Century Label Market Share of Labelling Segmented by Region in 2018 Table Company Profiles Table Product Introduction Table MCC Label Production, Value ($), Price, Gross Margin 2014-2019 Figure MCC Label Production and Growth Rate Figure MCC Label Value ($) Market Share 2014-2019 Figure MCC Label Market Share of Labelling Segmented by Region in 2018 Table Company Profiles Table Product Introduction Table Axon Production, Value ($), Price, Gross Margin 2014-2019 Figure Axon Production and Growth Rate Figure Axon Value ($) Market Share 2014-2019 Figure Axon Market Share of Labelling Segmented by Region in 2018 Table Company Profiles Table Product Introduction Table Packology Production, Value ($), Price, Gross Margin 2014-2019 Figure Packology Production and Growth Rate Figure Packology Value ($) Market Share 2014-2019 Figure Packology Market Share of Labelling Segmented by Region in 2018 Table Company Profiles Table Product Introduction Table Advanced Labels Production, Value ($), Price, Gross Margin 2014-2019 Figure Advanced Labels Production and Growth Rate Figure Advanced Labels Value ($) Market Share 2014-2019 Figure Advanced Labels Market Share of Labelling Segmented by Region in 2018 Table Company Profiles Table Product Introduction Table Ameri Seal Production, Value ($), Price, Gross Margin 2014-2019 Figure Ameri Seal Production and Growth Rate Figure Ameri Seal Value ($) Market Share 2014-2019 Figure Ameri Seal Market Share of Labelling Segmented by Region in 2018 Table Company Profiles Table Product Introduction Table Avery Dennison Production, Value ($), Price, Gross Margin 2014-2019 Figure Avery Dennison Production and Growth Rate Figure Avery Dennison Value ($) Market Share 2014-2019 Figure Avery Dennison Market Share of Labelling Segmented by Region in 2018 Table Company Profiles Table Product Introduction Table Allcan Label Production, Value ($), Price, Gross Margin 2014-2019 Figure Allcan Label Production and Growth Rate Figure Allcan Label Value ($) Market Share 2014-2019 Figure Allcan Label Market Share of Labelling Segmented by Region in 2018 Table Company Profiles Table Product Introduction Table Label World Production, Value ($), Price, Gross Margin 2014-2019 Figure Label World Production and Growth Rate Figure Label World Value ($) Market Share 2014-2019 Figure Label World Market Share of Labelling Segmented by Region in 2018 Table Company Profiles Table Product Introduction Table Label Quest Production, Value ($), Price, Gross Margin 2014-2019 Figure Label Quest Production and Growth Rate Figure Label Quest Value ($) Market Share 2014-2019 Figure Label Quest Market Share of Labelling Segmented by Region in 2018 Table Company Profiles Table Product Introduction Table Gilbreth Production, Value ($), Price, Gross Margin 2014-2019 Figure Gilbreth Production and Growth Rate Figure Gilbreth Value ($) Market Share 2014-2019 Figure Gilbreth Market Share of Labelling Segmented by Region in 2018 Table Company Profiles Table Product Introduction Table Progressive Label Production, Value ($), Price, Gross Margin 2014-2019 Figure Progressive Label Production and Growth Rate Figure Progressive Label Value ($) Market Share 2014-2019 Figure Progressive Label Market Share of Labelling Segmented by Region in 2018 Table Company Profiles Table Product Introduction Table Color Flex Production, Value ($), Price, Gross Margin 2014-2019 Figure Color Flex Production and Growth Rate Figure Color Flex Value ($) Market Share 2014-2019 Figure Color Flex Market Share of Labelling Segmented by Region in 2018 Table Company Profiles Table Product Introduction Table Classic Label Production, Value ($), Price, Gross Margin 2014-2019 Figure Classic Label Production and Growth Rate Figure Classic Label Value ($) Market Share 2014-2019 Figure Classic Label Market Share of Labelling Segmented by Region in 2018 Table Company Profiles Table Product Introduction Table Graphics Link Production, Value ($), Price, Gross Margin 2014-2019 Figure Graphics Link Production and Growth Rate Figure Graphics Link Value ($) Market Share 2014-2019 Figure Graphics Link Market Share of Labelling Segmented by Region in 2018 Table Company Profiles Table Product Introduction Table SleevCo Production, Value ($), Price, Gross Margin 2014-2019 Figure SleevCo Production and Growth Rate Figure SleevCo Value ($) Market Share 2014-2019 Figure SleevCo Market Share of Labelling Segmented by Region in 2018 Table Company Profiles Table Product Introduction Table Smyth Companies Production, Value ($), Price, Gross Margin 2014-2019 Figure Smyth Companies Production and Growth Rate Figure Smyth Companies Value ($) Market Share 2014-2019 Figure Smyth Companies Market Share of Labelling Segmented by Region in 2018 Table Company Profiles Table Product Introduction Table Promotional Graphics Production, Value ($), Price, Gross Margin 2014-2019 Figure Promotional Graphics Production and Growth Rate Figure Promotional Graphics Value ($) Market Share 2014-2019 Figure Promotional Graphics Market Share of Labelling Segmented by Region in 2018 Table Company Profiles Table Product Introduction Table Consolidated Label Production, Value ($), Price, Gross Margin 2014-2019 Figure Consolidated Label Production and Growth Rate Figure Consolidated Label Value ($) Market Share 2014-2019 Figure Consolidated Label Market Share of Labelling Segmented by Region in 2018 Table Company Profiles Table Product Introduction Table MRI Packaging Production, Value ($), Price, Gross Margin 2014-2019 Figure MRI Packaging Production and Growth Rate Figure MRI Packaging Value ($) Market Share 2014-2019 Figure MRI Packaging Market Share of Labelling Segmented by Region in 2018 Table Company Profiles Table Product Introduction Table ShrinkSleeveLabels.com Production, Value ($), Price, Gross Margin 2014-2019 Figure ShrinkSleeveLabels.com Production and Growth Rate Figure ShrinkSleeveLabels.com Value ($) Market Share 2014-2019 Figure ShrinkSleeveLabels.com Market Share of Labelling Segmented by Region in 2018 Table Company Profiles Table Product Introduction Table PDC International Production, Value ($), Price, Gross Margin 2014-2019 Figure PDC International Production and Growth Rate Figure PDC International Value ($) Market Share 2014-2019 Figure PDC International Market Share of Labelling Segmented by Region in 2018 Table Company Profiles Table Product Introduction Table Fort Dearborn Production, Value ($), Price, Gross Margin 2014-2019 Figure Fort Dearborn Production and Growth Rate Figure Fort Dearborn Value ($) Market Share 2014-2019 Figure Fort Dearborn Market Share of Labelling Segmented by Region in 2018 Table Company Profiles Table Product Introduction Table Canadian Label Company Production, Value ($), Price, Gross Margin 2014-2019 Figure Canadian Label Company Production and Growth Rate Figure Canadian Label Company Value ($) Market Share 2014-2019 Figure Canadian Label Company Market Share of Labelling Segmented by Region in 2018 Table Company Profiles Table Product Introduction Table LabelValue.com Production, Value ($), Price, Gross Margin 2014-2019 Figure LabelValue.com Production and Growth Rate Figure LabelValue.com Value ($) Market Share 2014-2019 Figure LabelValue.com Market Share of Labelling Segmented by Region in 2018 Table Global Labelling Market Value ($) Forecast, by Type Table Global Labelling Market Volume Forecast, by Type Figure Global Labelling Market Value ($) and Growth Rate Forecast of Paper Labels (2019-2024) Figure Global Labelling Market Volume and Growth Rate Forecast of Paper Labels (2019-2024) Figure Global Labelling Market Value ($) and Growth Rate Forecast of Plastic Labels (2019-2024) Figure Global Labelling Market Volume and Growth Rate Forecast of Plastic Labels (2019-2024) Figure Global Labelling Market Value ($) and Growth Rate Forecast of Adhesive Labels (2019-2024) Figure Global Labelling Market Volume and Growth Rate Forecast of Adhesive Labels (2019-2024) Figure Global Labelling Market Value ($) and Growth Rate Forecast of Ink Labels (2019-2024) Figure Global Labelling Market Volume and Growth Rate Forecast of Ink Labels (2019-2024) Table Global Market Value ($) Forecast by Application (2019-2024) Table Global Market Volume Forecast by Application (2019-2024) Figure Global Labelling Consumption and Growth Rate of Pressure Sensitive (2014-2019) Figure Global Labelling Consumption and Growth Rate of Glue-applied (2014-2019) Figure Global Labelling Consumption and Growth Rate of Heat-Shrink & Stretch Sleeve (2014-2019) Figure Global Labelling Consumption and Growth Rate of In-mold Labels (2014-2019) Figure Market Value ($) and Growth Rate Forecast of In-mold Labels (2019-2024) Figure Market Volume and Growth Rate Forecast of In-mold Labels (2019-2024) Figure North America Market Value ($) and Growth Rate Forecast (2019-2024) Table North America Consumption and Growth Rate Forecast (2019-2024) Figure Europe Market Value ($) and Growth Rate Forecast (2019-2024) Table Europe Consumption and Growth Rate Forecast (2019-2024) Figure China Market Value ($) and Growth Rate Forecast (2019-2024) Table China Consumption and Growth Rate Forecast (2019-2024) Figure Japan Market Value ($) and Growth Rate Forecast (2019-2024) Table Japan Consumption and Growth Rate Forecast (2019-2024) Figure Middle East & Africa Market Value ($) and Growth Rate Forecast (2019-2024) Table Middle East & Africa Consumption and Growth Rate Forecast (2019-2024) Figure India Market Value ($) and Growth Rate Forecast (2019-2024) Table India Consumption and Growth Rate Forecast (2019-2024) Figure South America Market Value ($) and Growth Rate Forecast (2019-2024) Table South America Consumption and Growth Rate Forecast (2019-2024) Figure Industry Resource/Technology/Labor Importance Analysis Table New Entrants SWOT Analysis Table New Project Analysis of Investment Recovery
Inquiry For Buying
Labelling
Request Sample
Labelling