Laptop Protection Shell Market Size, Share, and Trends Analysis Report
CAGR :

| Market Size 2023 (Base Year) | USD 2.28 Billion |
| Market Size 2032 (Forecast Year) | USD 4.16 Billion |
| CAGR | 6.9% |
| Forecast Period | 2024 - 2032 |
| Historical Period | 2018 - 2023 |
Laptop Protection Shell Market Insights
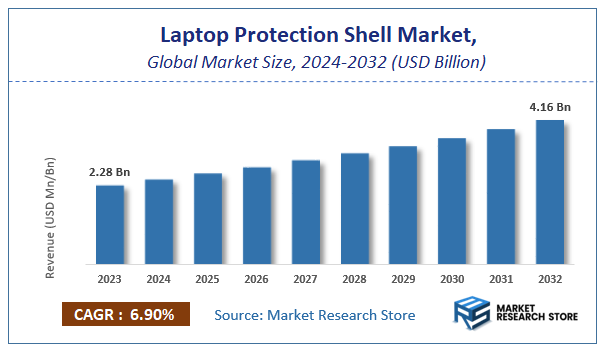
A latest report by Market Research Store estimates that the Global Laptop Protection Shell Market was valued at USD 2.28 Billion in 2023 and is expected to reach USD 4.16 Billion by 2032, with a CAGR of 6.9% during the forecast period 2024-2032. The report Laptop Protection Shell Market overview, growth factors, restraints, opportunities, segmentation, key developments, competitive landscape, consumer insights, and market growth forecast in terms of value or volume. These structured details offer an all-inclusive market overview, providing valuable insights for investment decisions, business decisions, strategic planning, and competitive analysis.
To Get more Insights, Request a Free Sample
Protection Shell Market: Overview
The growth of the laptop protection shell market is fueled by rising global demand across various industries and applications. The report highlights lucrative opportunities, analyzing cost structures, key segments, emerging trends, regional dynamics, and advancements by leading players to provide comprehensive market insights. The laptop protection shell market report offers a detailed industry analysis from 2024 to 2032, combining quantitative and qualitative insights. It examines key factors such as pricing, market penetration, GDP impact, industry dynamics, major players, consumer behavior, and socio-economic conditions. Structured into multiple sections, the report provides a comprehensive perspective on the market from all angles.
Key sections of the laptop protection shell market report include market segments, outlook, competitive landscape, and company profiles. Market Segments offer in-depth details based on Material, Laptop Size Compatibility, Design Type, End-User, Distribution Channel, and other relevant classifications to support strategic marketing initiatives. Market Outlook thoroughly analyzes market trends, growth drivers, restraints, opportunities, challenges, Porter’s Five Forces framework, macroeconomic factors, value chain analysis, and pricing trends shaping the market now and in the future. The Competitive Landscape and Company Profiles section highlights major players, their strategies, and market positioning to guide investment and business decisions. The report also identifies innovation trends, new business opportunities, and investment prospects for the forecast period.
Key Highlights:
- As per the analysis shared by our research analyst, the global laptop protection shell market is estimated to grow annually at a CAGR of around 6.9% over the forecast period (2024-2032).
- In terms of revenue, the global laptop protection shell market size was valued at around USD 2.28 Billion in 2023 and is projected to reach USD 4.16 Billion by 2032.
- The market is projected to grow at a significant rate due to increasing sales of laptops, growing awareness of device protection, and rising demand for durable and customizable protective accessories.
- Based on the Material, the Plastic segment is growing at a high rate and will continue to dominate the global market as per industry projections.
- On the basis of Laptop Size Compatibility, the Below 13 inches segment is anticipated to command the largest market share.
- In terms of Design Type, the Hard Shell Cases segment is projected to lead the global market.
- By End-User, the Students segment is predicted to dominate the global market.
- Based on the Distribution Channel, the Online Retailers segment is expected to swipe the largest market share.
- Based on region, Asia-Pacific is projected to dominate the global market during the forecast period.
Laptop Protection Shell Market: Report Scope
This report thoroughly analyzes the laptop protection shell market, exploring its historical trends, current state, and future projections. The market estimates presented result from a robust research methodology, incorporating primary research, secondary sources, and expert opinions. These estimates are influenced by the prevailing market dynamics as well as key economic, social, and political factors. Furthermore, the report considers the impact of regulations, government expenditures, and advancements in research and development on the market. Both positive and negative shifts are evaluated to ensure a comprehensive and accurate market outlook.
| Report Attributes | Report Details |
|---|---|
| Report Name | Laptop Protection Shell Market |
| Market Size in 2023 | USD 2.28 Billion |
| Market Forecast in 2032 | USD 4.16 Billion |
| Growth Rate | CAGR of 6.9% |
| Number of Pages | 184 |
| Key Companies Covered | Moshi, COOSKIN, IBENZER, Belkin, GMYLE, THULE, Speck, Kuzy, Topcase, Apple |
| Segments Covered | By Material, By Laptop Size Compatibility, By Design Type, By End-User, By Distribution Channel, and By Region |
| Regions Covered | North America, Europe, Asia Pacific (APAC), Latin America, Middle East, and Africa (MEA) |
| Base Year | 2023 |
| Historical Year | 2018 to 2023 |
| Forecast Year | 2024 to 2032 |
| Customization Scope | Avail customized purchase options to meet your exact research needs. Request For Customization |
Laptop Protection Shell Market: Dynamics
Key Growth Drivers:
The laptop protection shell market is experiencing steady growth, driven by the increasing prevalence of laptops in both professional and personal settings. The growing awareness of the high cost of laptop repairs and replacements fuels demand for protective accessories. The rise of remote work and digital nomad lifestyles, necessitating frequent laptop transport, further contributes to market expansion. Technological advancements in materials science, leading to thinner, lighter, and more durable protection shells, enhance product appeal. Additionally, the increasing availability of aesthetically pleasing and customizable protection shells caters to the design-conscious consumer, driving sales.
Restraints:
Despite the market's positive trajectory, several restraints impede its full potential. The inherent durability of modern laptops reduces the perceived need for external protection among some consumers. The availability of alternative protection solutions, such as laptop sleeves and backpacks with dedicated compartments, poses competitive challenges. Concerns regarding the potential for overheating or restricted airflow when using protection shells limit adoption. Furthermore, the compatibility issues with certain laptop models and the need for precise fitting can deter consumers. The competitive landscape, with numerous manufacturers offering similar products, can lead to price pressures and market saturation.
Opportunities:
The laptop protection shell market presents numerous opportunities for innovation and expansion. The development of smart protection shells with integrated cooling systems, wireless charging capabilities, and impact sensors can enhance functionality and user experience. The growing demand for eco-friendly and sustainable protection shells, made from recycled materials or biodegradable plastics, offers niche market segments. The expansion of protection shell applications in specialized industries, such as education and construction, where laptops are subjected to harsh environments, provides new market opportunities. Furthermore, the development of customizable protection shells with personalized designs and branding can appeal to corporate clients and individual consumers.
Challenges:
The laptop protection shell market faces several challenges that require strategic solutions. Ensuring the durability and impact resistance of protection shells while maintaining a slim and lightweight design is crucial. Maintaining consistent product quality and compatibility across diverse laptop models and sizes is essential. Adapting to the evolving needs and preferences of consumers, including the demand for aesthetic appeal and smart features, necessitates continuous product development and innovation. Ensuring compliance with safety regulations and material standards is necessary. Managing the complexities of supply chain logistics and ensuring timely delivery, particularly with customized orders, can be challenging. Additionally, addressing consumer concerns regarding overheating and restricted airflow is paramount.
Laptop Protection Shell Market: Segmentation Insights
The global laptop protection shell market is segmented based on Material, Laptop Size Compatibility, Design Type, End-User, Distribution Channel, and Region. All the segments of the laptop protection shell market have been analyzed based on present & future trends and the market is estimated from 2024 to 2032.
Based on Material, the global laptop protection shell market is divided into Plastic, Silicone, Leather, Metal, Hybrid.
On the basis of Laptop Size Compatibility, the global laptop protection shell market is bifurcated into Below 13 inches, 13-15 inches, Above 15 inches.
In terms of Design Type, the global laptop protection shell market is categorized into Hard Shell Cases, Soft Sleeve Covers, 2-in-1 Hybrid Covers.
Based on End-User, the global laptop protection shell market is split into Students, Professionals, Gamers, Corporate Users.
By Distribution Channel, the global laptop protection shell market is divided into Online Retailers, Specialty Stores, Supermarkets & Hypermarkets, Company Stores.
Laptop Protection Shell Market: Regional Insights
The Asia-Pacific (APAC) region dominates the global laptop protection shell market, driven by high demand from countries like China, India, Japan, and South Korea. According to recent market reports, APAC held over 40% of the market share in 2023, fueled by rapid urbanization, increasing laptop adoption, and a thriving e-commerce sector. China remains the largest contributor due to its massive electronics manufacturing base and consumer spending power.
North America and Europe follow, with significant growth attributed to premium product demand and brand-conscious consumers. The APAC region is expected to maintain its lead, growing at a CAGR of around 7-9% through 2030, supported by rising disposable incomes and expanding tech-savvy populations. Emerging markets in Southeast Asia further bolster regional dominance.
Laptop Protection Shell Market: Competitive Landscape
The laptop protection shell market Report offers a thorough analysis of both established and emerging players within the market. It includes a detailed list of key companies, categorized based on the types of products they offer and other relevant factors. The report also highlights the market entry year for each player, providing further context for the research analysis.
The "Global Laptop Protection Shell Market" study offers valuable insights, focusing on the global market landscape, with an emphasis on major industry players such as;
- Moshi
- COOSKIN
- IBENZER
- Belkin
- GMYLE
- THULE
- Speck
- Kuzy
- Topcase
- Apple
The Global Laptop Protection Shell Market is Segmented as Follows:
By Material
- Plastic
- Silicone
- Leather
- Metal
- Hybrid
By Laptop Size Compatibility
- Below 13 inches
- 13-15 inches
- Above 15 inches
By Design Type
- Hard Shell Cases
- Soft Sleeve Covers
- 2-in-1 Hybrid Covers
By End-User
- Students
- Professionals
- Gamers
- Corporate Users
By Distribution Channel
- Online Retailers
- Specialty Stores
- Supermarkets & Hypermarkets
- Company Stores
By Region
- North America
- The U.S.
- Canada
- Mexico
- Europe
- France
- The UK
- Spain
- Germany
- Italy
- Rest of Europe
- Asia Pacific
- China
- Japan
- India
- Australia
- South Korea
- Rest of Asia Pacific
- The Middle East & Africa
- Saudi Arabia
- UAE
- Egypt
- Kuwait
- South Africa
- Rest of the Middle East & Africa
- Latin America
- Brazil
- Argentina
- Rest of Latin America
Market Evolution
This section evaluates the market position of the product or service by examining its development pathway and competitive dynamics. It provides a detailed overview of the product's growth stages, including the early (historical) phase, the mid-stage, and anticipated future advancements influenced by innovation and emerging technologies.
Porter’s Analysis
Porter’s Five Forces framework offers a strategic lens for assessing competitor behavior and the positioning of key players in the laptop protection shell industry. This section explores the external factors shaping competitive dynamics and influencing market strategies in the years ahead. The analysis focuses on five critical forces:
- Competitive Rivalry
- Threat of New Entrants
- Threat of Substitutes
- Supplier Bargaining Power
- Buyer Bargaining Power
Value Chain & Market Attractiveness Analysis
The value chain analysis helps businesses optimize operations by mapping the product flow from suppliers to end consumers, identifying opportunities to streamline processes and gain a competitive edge. Segment-wise market attractiveness analysis evaluates key dimensions like product categories, demographics, and regions, assessing growth potential, market size, and profitability. This enables businesses to focus resources on high-potential segments for better ROI and long-term value.
PESTEL Analysis
PESTEL analysis is a powerful tool in market research reports that enhances market understanding by systematically examining the external macro-environmental factors influencing a business or industry. The acronym stands for Political, Economic, Social, Technological, Environmental, and Legal factors. By evaluating these dimensions, PESTEL analysis provides a comprehensive overview of the broader context within which a market operates, helping businesses identify potential opportunities and threats.
- Political factors assess government policies, stability, trade regulations, and political risks that could impact market operations.
- Economic factors examine variables like inflation, exchange rates, economic growth, and consumer spending power to determine market viability.
- Social factors explore cultural trends, demographics, and lifestyle changes that shape consumer behavior and preferences.
- Technological factors evaluate innovation, R&D, and technological advancements affecting product development and operational efficiencies.
- Environmental factors focus on sustainability, climate change impacts, and eco-friendly practices shaping market trends.
- Legal factors address compliance requirements, industry regulations, and intellectual property laws impacting market entry and operations.
Import-Export Analysis & Pricing Analysis
An import-export analysis is vital for market research, revealing global trade dynamics, trends, and opportunities. It examines trade volumes, product categories, and regional competitiveness, offering insights into supply chains and market demand. This section also analyzes past and future pricing trends, helping businesses optimize strategies and enabling consumers to assess product value effectively.
Laptop Protection Shell Market: Company Profiles
The report identifies key players in the laptop protection shell market through a competitive landscape and company profiles, evaluating their offerings, financial performance, strategies, and market positioning. It includes a SWOT analysis of the top 3-5 companies, assessing strengths, weaknesses, opportunities, and threats. The competitive landscape highlights rankings, recent activities (mergers, acquisitions, partnerships, product launches), and regional footprints using the Ace matrix. Customization is available to meet client-specific needs.
Regional & Industry Footprint
This section details the geographic reach, sales networks, and market penetration of companies profiled in the laptop protection shell report, showcasing their operations and distribution across regions. It analyzes the alignment of companies with specific industry verticals, highlighting the industries they serve and the scope of their products and services within those sectors.
Ace Matrix
This section categorizes companies into four distinct groups—Active, Cutting Edge, Innovator, and Emerging—based on their product and business strategies. The evaluation of product strategy focuses on aspects such as the range and depth of offerings, commitment to innovation, product functionalities, and scalability. Key elements like global reach, sector coverage, strategic acquisitions, and long-term growth plans are considered for business strategy. This analysis provides a detailed view of companies' position within the market and highlights their potential for future growth and development.
Research Methodology
The qualitative and quantitative insights for the laptop protection shell market are derived through a multi-faceted research approach, combining input from subject matter experts, primary research, and secondary data sources. Primary research includes gathering critical information via face-to-face or telephonic interviews, surveys, questionnaires, and feedback from industry professionals, key opinion leaders (KOLs), and customers. Regular interviews with industry experts are conducted to deepen the analysis and reinforce the existing data, ensuring a robust and well-rounded market understanding.
Secondary research for this report was carried out by the Market Research Store team, drawing on a variety of authoritative sources, such as:
- Official company websites, annual reports, financial statements, investor presentations, and SEC filings
- Internal and external proprietary databases, as well as relevant patent and regulatory databases
- Government publications, national statistical databases, and industry-specific market reports
- Media coverage, including news articles, press releases, and webcasts about market participants
- Paid industry databases for detailed market insights
Market Research Store conducted in-depth consultations with various key opinion leaders in the industry, including senior executives from top companies and regional leaders from end-user organizations. This effort aimed to gather critical insights on factors such as the market share of dominant brands in specific countries and regions, along with pricing strategies for products and services.
To determine total sales data, the research team conducted primary interviews across multiple countries with influential stakeholders, including:
- Distributors
- Marketing, Brand, and Product Managers
- Procurement and Production Managers
- Sales and Regional Sales Managers, Country Managers
- Technical Specialists
- C-Level Executives
These subject matter experts, with their extensive industry experience, helped validate and refine the findings. For secondary research, data were sourced from a wide range of materials, including online resources, company annual reports, industry publications, research papers, association reports, and government websites. These various sources provide a comprehensive and well-rounded perspective on the market.
Frequently Asked Questions
Table Of Content
List of Tables and Figures Figure Product Picture of Laptop Protection Shell Table Product Specification of Laptop Protection Shell Figure Market Concentration Ratio and Market Maturity Analysis of Laptop Protection Shell Figure Global Laptop Protection Shell Value ($) and Growth Rate from 2014-2024 Table Different Types of Laptop Protection Shell Figure Global Laptop Protection Shell Value ($) Segment by Type from 2014-2019 Figure Hard Shell Picture Figure Soft Shell Picture Figure Others Picture Table Different Applications of Laptop Protection Shell Figure Global Laptop Protection Shell Value ($) Segment by Applications from 2014-2019 Figure Protection Picture Figure Beauty Picture Figure Others Picture Table Research Regions of Laptop Protection Shell Figure North America Laptop Protection Shell Production Value ($) and Growth Rate (2014-2019) Figure Europe Laptop Protection Shell Production Value ($) and Growth Rate (2014-2019) Table China Laptop Protection Shell Production Value ($) and Growth Rate (2014-2019) Table Japan Laptop Protection Shell Production Value ($) and Growth Rate (2014-2019) Table Middle East & Africa Laptop Protection Shell Production Value ($) and Growth Rate (2014-2019) Table India Laptop Protection Shell Production Value ($) and Growth Rate (2014-2019) Table South America Laptop Protection Shell Production Value ($) and Growth Rate (2014-2019) Table Emerging Countries of Laptop Protection Shell Table Growing Market of Laptop Protection Shell Figure Industry Chain Analysis of Laptop Protection Shell Table Upstream Raw Material Suppliers of Laptop Protection Shell with Contact Information Table Major Players Manufacturing Base and Market Share ($) of Laptop Protection Shell in 2018 Table Major Players Laptop Protection Shell Product Types in 2018 Figure Production Process of Laptop Protection Shell Figure Manufacturing Cost Structure of Laptop Protection Shell Figure Channel Status of Laptop Protection Shell Table Major Distributors of Laptop Protection Shell with Contact Information Table Major Downstream Buyers of Laptop Protection Shell with Contact Information Table Global Laptop Protection Shell Value ($) by Type (2014-2019) Table Global Laptop Protection Shell Value ($) Share by Type (2014-2019) Figure Global Laptop Protection Shell Value ($) Share by Type (2014-2019) Table Global Laptop Protection Shell Production by Type (2014-2019) Table Global Laptop Protection Shell Production Share by Type (2014-2019) Figure Global Laptop Protection Shell Production Share by Type (2014-2019) Figure Global Laptop Protection Shell Value ($) and Growth Rate of Hard Shell Figure Global Laptop Protection Shell Value ($) and Growth Rate of Soft Shell Figure Global Laptop Protection Shell Value ($) and Growth Rate of Others Figure Global Laptop Protection Shell Price by Type (2014-2019) Table Global Laptop Protection Shell Consumption by Application (2014-2019) Table Global Laptop Protection Shell Consumption Market Share by Application (2014-2019) Figure Global Laptop Protection Shell Consumption Market Share by Application (2014-2019) Table Downstream Buyers Introduction by Application Figure Global Laptop Protection Shell Consumption and Growth Rate of Protection (2014-2019) Figure Global Laptop Protection Shell Consumption and Growth Rate of Beauty (2014-2019) Figure Global Laptop Protection Shell Consumption and Growth Rate of Others (2014-2019) Table Global Laptop Protection Shell Value ($) by Region (2014-2019) Table Global Laptop Protection Shell Value ($) Market Share by Region (2014-2019) Figure Global Laptop Protection Shell Value ($) Market Share by Region (2014-2019) Table Global Laptop Protection Shell Production by Region (2014-2019) Table Global Laptop Protection Shell Production Market Share by Region (2014-2019) Figure Global Laptop Protection Shell Production Market Share by Region (2014-2019) Table Global Laptop Protection Shell Production, Value ($), Price and Gross Margin (2014-2019) Table North America Laptop Protection Shell Production, Value ($), Price and Gross Margin (2014-2019) Table Europe Laptop Protection Shell Production, Value ($), Price and Gross Margin (2014-2019) Table China Laptop Protection Shell Production, Value ($), Price and Gross Margin (2014-2019) Table Japan Laptop Protection Shell Production, Value ($), Price and Gross Margin (2014-2019) Table Middle East & Africa Laptop Protection Shell Production, Value ($), Price and Gross Margin (2014-2019) Table India Laptop Protection Shell Production, Value ($), Price and Gross Margin (2014-2019) Table South America Laptop Protection Shell Production, Value ($), Price and Gross Margin (2014-2019) Table Global Laptop Protection Shell Consumption by Regions (2014-2019) Figure Global Laptop Protection Shell Consumption Share by Regions (2014-2019) Table North America Laptop Protection Shell Production, Consumption, Export, Import (2014-2019) Table Europe Laptop Protection Shell Production, Consumption, Export, Import (2014-2019) Table China Laptop Protection Shell Production, Consumption, Export, Import (2014-2019) Table Japan Laptop Protection Shell Production, Consumption, Export, Import (2014-2019) Table Middle East & Africa Laptop Protection Shell Production, Consumption, Export, Import (2014-2019) Table India Laptop Protection Shell Production, Consumption, Export, Import (2014-2019) Table South America Laptop Protection Shell Production, Consumption, Export, Import (2014-2019) Figure North America Laptop Protection Shell Production and Growth Rate Analysis Figure North America Laptop Protection Shell Consumption and Growth Rate Analysis Figure North America Laptop Protection Shell SWOT Analysis Figure Europe Laptop Protection Shell Production and Growth Rate Analysis Figure Europe Laptop Protection Shell Consumption and Growth Rate Analysis Figure Europe Laptop Protection Shell SWOT Analysis Figure China Laptop Protection Shell Production and Growth Rate Analysis Figure China Laptop Protection Shell Consumption and Growth Rate Analysis Figure China Laptop Protection Shell SWOT Analysis Figure Japan Laptop Protection Shell Production and Growth Rate Analysis Figure Japan Laptop Protection Shell Consumption and Growth Rate Analysis Figure Japan Laptop Protection Shell SWOT Analysis Figure Middle East & Africa Laptop Protection Shell Production and Growth Rate Analysis Figure Middle East & Africa Laptop Protection Shell Consumption and Growth Rate Analysis Figure Middle East & Africa Laptop Protection Shell SWOT Analysis Figure India Laptop Protection Shell Production and Growth Rate Analysis Figure India Laptop Protection Shell Consumption and Growth Rate Analysis Figure India Laptop Protection Shell SWOT Analysis Figure South America Laptop Protection Shell Production and Growth Rate Analysis Figure South America Laptop Protection Shell Consumption and Growth Rate Analysis Figure South America Laptop Protection Shell SWOT Analysis Figure Top 3 Market Share of Laptop Protection Shell Companies Figure Top 6 Market Share of Laptop Protection Shell Companies Table Mergers, Acquisitions and Expansion Analysis Table Company Profiles Table Product Introduction Table Moshi Production, Value ($), Price, Gross Margin 2014-2019 Figure Moshi Production and Growth Rate Figure Moshi Value ($) Market Share 2014-2019 Figure Moshi Market Share of Laptop Protection Shell Segmented by Region in 2018 Table Company Profiles Table Product Introduction Table COOSKIN Production, Value ($), Price, Gross Margin 2014-2019 Figure COOSKIN Production and Growth Rate Figure COOSKIN Value ($) Market Share 2014-2019 Figure COOSKIN Market Share of Laptop Protection Shell Segmented by Region in 2018 Table Company Profiles Table Product Introduction Table IBENZER Production, Value ($), Price, Gross Margin 2014-2019 Figure IBENZER Production and Growth Rate Figure IBENZER Value ($) Market Share 2014-2019 Figure IBENZER Market Share of Laptop Protection Shell Segmented by Region in 2018 Table Company Profiles Table Product Introduction Table Belkin Production, Value ($), Price, Gross Margin 2014-2019 Figure Belkin Production and Growth Rate Figure Belkin Value ($) Market Share 2014-2019 Figure Belkin Market Share of Laptop Protection Shell Segmented by Region in 2018 Table Company Profiles Table Product Introduction Table GMYLE Production, Value ($), Price, Gross Margin 2014-2019 Figure GMYLE Production and Growth Rate Figure GMYLE Value ($) Market Share 2014-2019 Figure GMYLE Market Share of Laptop Protection Shell Segmented by Region in 2018 Table Company Profiles Table Product Introduction Table THULE Production, Value ($), Price, Gross Margin 2014-2019 Figure THULE Production and Growth Rate Figure THULE Value ($) Market Share 2014-2019 Figure THULE Market Share of Laptop Protection Shell Segmented by Region in 2018 Table Company Profiles Table Product Introduction Table Speck Production, Value ($), Price, Gross Margin 2014-2019 Figure Speck Production and Growth Rate Figure Speck Value ($) Market Share 2014-2019 Figure Speck Market Share of Laptop Protection Shell Segmented by Region in 2018 Table Company Profiles Table Product Introduction Table Kuzy Production, Value ($), Price, Gross Margin 2014-2019 Figure Kuzy Production and Growth Rate Figure Kuzy Value ($) Market Share 2014-2019 Figure Kuzy Market Share of Laptop Protection Shell Segmented by Region in 2018 Table Company Profiles Table Product Introduction Table Topcase Production, Value ($), Price, Gross Margin 2014-2019 Figure Topcase Production and Growth Rate Figure Topcase Value ($) Market Share 2014-2019 Figure Topcase Market Share of Laptop Protection Shell Segmented by Region in 2018 Table Company Profiles Table Product Introduction Table Apple Production, Value ($), Price, Gross Margin 2014-2019 Figure Apple Production and Growth Rate Figure Apple Value ($) Market Share 2014-2019 Figure Apple Market Share of Laptop Protection Shell Segmented by Region in 2018 Table Global Laptop Protection Shell Market Value ($) Forecast, by Type Table Global Laptop Protection Shell Market Volume Forecast, by Type Figure Global Laptop Protection Shell Market Value ($) and Growth Rate Forecast of Hard Shell (2019-2024) Figure Global Laptop Protection Shell Market Volume and Growth Rate Forecast of Hard Shell (2019-2024) Figure Global Laptop Protection Shell Market Value ($) and Growth Rate Forecast of Soft Shell (2019-2024) Figure Global Laptop Protection Shell Market Volume and Growth Rate Forecast of Soft Shell (2019-2024) Figure Global Laptop Protection Shell Market Value ($) and Growth Rate Forecast of Others (2019-2024) Figure Global Laptop Protection Shell Market Volume and Growth Rate Forecast of Others (2019-2024) Table Global Market Value ($) Forecast by Application (2019-2024) Table Global Market Volume Forecast by Application (2019-2024) Figure Global Laptop Protection Shell Consumption and Growth Rate of Protection (2014-2019) Figure Global Laptop Protection Shell Consumption and Growth Rate of Beauty (2014-2019) Figure Global Laptop Protection Shell Consumption and Growth Rate of Others (2014-2019) Figure Market Value ($) and Growth Rate Forecast of Others (2019-2024) Figure Market Volume and Growth Rate Forecast of Others (2019-2024) Figure North America Market Value ($) and Growth Rate Forecast (2019-2024) Table North America Consumption and Growth Rate Forecast (2019-2024) Figure Europe Market Value ($) and Growth Rate Forecast (2019-2024) Table Europe Consumption and Growth Rate Forecast (2019-2024) Figure China Market Value ($) and Growth Rate Forecast (2019-2024) Table China Consumption and Growth Rate Forecast (2019-2024) Figure Japan Market Value ($) and Growth Rate Forecast (2019-2024) Table Japan Consumption and Growth Rate Forecast (2019-2024) Figure Middle East & Africa Market Value ($) and Growth Rate Forecast (2019-2024) Table Middle East & Africa Consumption and Growth Rate Forecast (2019-2024) Figure India Market Value ($) and Growth Rate Forecast (2019-2024) Table India Consumption and Growth Rate Forecast (2019-2024) Figure South America Market Value ($) and Growth Rate Forecast (2019-2024) Table South America Consumption and Growth Rate Forecast (2019-2024) Figure Industry Resource/Technology/Labor Importance Analysis Table New Entrants SWOT Analysis Table New Project Analysis of Investment Recovery
Inquiry For Buying
Laptop Protection Shell
Request Sample
Laptop Protection Shell