Luxury Hotel Market Size, Share, and Trends Analysis Report
CAGR :

| Market Size 2023 (Base Year) | USD 168.60 Billion |
| Market Size 2032 (Forecast Year) | USD 263.81 Billion |
| CAGR | 5.1% |
| Forecast Period | 2024 - 2032 |
| Historical Period | 2018 - 2023 |
Luxury Hotel Market Insights
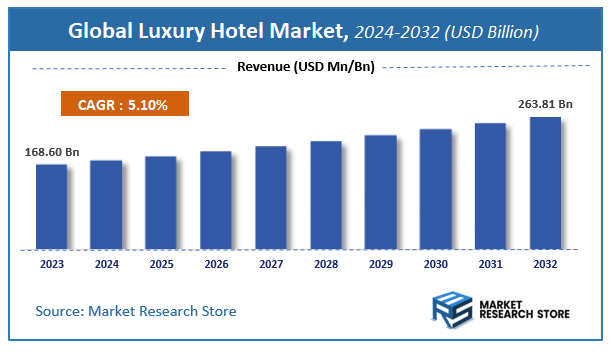
As per the published report by Market Research Store, the Global Luxury Hotel Market size was estimated at USD 168.60 Billion in 2023 and is anticipated to reach reach USD 263.81 Billion by 2032, growing at a projected CAGR of 5.1% during the forecast period 2024-2032. The report provides a detailed analysis of the global Luxury Hotel Market, including market trends, market dynamics, and market opportunities during the forecast period (2024-2032). It delves deeper into several market facets, such as market definition, size, growth, forecast, segmentation, competitive analysis, growth drivers, restraints, financial analysis, SWOT analysis, PORTER’s five force analysis, PESTEL analysis, market share analysis, cost-benefit analysis, challenges, restraints, strategic recommendations, and market players.
To Get more Insights, Request a Free Sample
Luxury Hotel Market: Overview
The growth of the luxury hotel market is fueled by rising global demand across various industries and applications. The report highlights lucrative opportunities, analyzing cost structures, key segments, emerging trends, regional dynamics, and advancements by leading players to provide comprehensive market insights. The luxury hotel market report offers a detailed industry analysis from 2024 to 2032, combining quantitative and qualitative insights. It examines key factors such as pricing, market penetration, GDP impact, industry dynamics, major players, consumer behavior, and socio-economic conditions. Structured into multiple sections, the report provides a comprehensive perspective on the market from all angles.
Key sections of the luxury hotel market report include market segments, outlook, competitive landscape, and company profiles. Market Segments offer in-depth details based on Room Type, Category, and other relevant classifications to support strategic marketing initiatives. Market Outlook thoroughly analyzes market trends, growth drivers, restraints, opportunities, challenges, Porter’s Five Forces framework, macroeconomic factors, value chain analysis, and pricing trends shaping the market now and in the future. The Competitive Landscape and Company Profiles section highlights major players, their strategies, and market positioning to guide investment and business decisions. The report also identifies innovation trends, new business opportunities, and investment prospects for the forecast period.
Key Highlights:
- As per the analysis shared by our research analyst, the global luxury hotel market is estimated to grow annually at a CAGR of around 5.1% over the forecast period (2024-2032).
- In terms of revenue, the global luxury hotel market size was valued at around USD 168.60 Billion in 2023 and is projected to reach USD 263.81 Billion by 2032.
- The market is projected to grow at a significant rate due to rising disposable incomes, increasing demand for unique and personalized travel experiences, and the growth of the affluent middle class, particularly in emerging economies.
- Based on the Room Type, the Luxury segment is growing at a high rate and will continue to dominate the global market as per industry projections.
- On the basis of Category, the Chain segment is anticipated to command the largest market share.
- Based on region, North America is projected to dominate the global market during the forecast period.
Luxury Hotel Market: Report Scope
This report thoroughly analyzes the luxury hotel market, exploring its historical trends, current state, and future projections. The market estimates presented result from a robust research methodology, incorporating primary research, secondary sources, and expert opinions. These estimates are influenced by the prevailing market dynamics as well as key economic, social, and political factors. Furthermore, the report considers the impact of regulations, government expenditures, and advancements in research and development on the market. Both positive and negative shifts are evaluated to ensure a comprehensive and accurate market outlook.
| Report Attributes | Report Details |
|---|---|
| Report Name | Luxury Hotel Market |
| Market Size in 2023 | USD 168.60 Billion |
| Market Forecast in 2032 | USD 263.81 Billion |
| Growth Rate | CAGR of 5.1% |
| Number of Pages | 184 |
| Key Companies Covered | Marriott International Inc. (U.S.), Hyatt Hotels Corporation (U.S.), InterContinental Hotels Group plc (U.K.), Four Seasons Hotel Limited (Canada) , Hilton Hotels & Resorts (U.S.), Kempinski Hotels S.A. (Switzerland), Accor SA (France), The Indian Hot |
| Segments Covered | By Room Type, By Category, and By Region |
| Regions Covered | North America, Europe, Asia Pacific (APAC), Latin America, Middle East, and Africa (MEA) |
| Base Year | 2023 |
| Historical Year | 2018 to 2023 |
| Forecast Year | 2024 to 2032 |
| Customization Scope | Avail customized purchase options to meet your exact research needs. Request For Customization |
Luxury Hotel Market: Dynamics
Key Growth Drivers
The Luxury Hotel market in Kolhapur, Maharashtra, India, is being driven by the increasing disposable incomes and a rising affluent population within the region and from nearby metropolitan areas seeking premium accommodation and experiences. The growing business travel to Kolhapur, spurred by its industrial and commercial activities, necessitates high-end lodging options for executives and corporate clients. Furthermore, the attraction of Kolhapur's historical and cultural sites, coupled with a desire for upscale hospitality, draws leisure travelers willing to pay for luxury amenities and services. The increasing connectivity and accessibility to Kolhapur via improved transportation infrastructure also facilitates the influx of high-spending tourists. The prestige and brand image associated with luxury hotels often attract discerning travelers seeking exclusivity and personalized attention.
Restraints
Despite the growth potential, the Luxury Hotel market in Kolhapur, Maharashtra, India, faces certain restraints. The relatively smaller scale of tourism and business activity compared to major metropolitan hubs might limit the overall demand for luxury accommodations. The price sensitivity of a significant portion of the domestic travel market can make it challenging to consistently maintain high occupancy rates at premium price points. Furthermore, the availability of alternative, less expensive accommodation options, such as mid-range hotels and guesthouses, can attract budget-conscious travelers. The need for highly skilled and trained staff to deliver the exceptional service expected in luxury hotels can be a challenge in a smaller city like Kolhapur. Inconsistent infrastructure in certain areas, such as power supply and high-speed internet, could also impact the guest experience at luxury properties.
Opportunities
The Luxury Hotel market in Kolhapur, Maharashtra, India, presents opportunities by leveraging the region's unique cultural heritage and natural surroundings to offer bespoke and experiential luxury stays. Focusing on attracting destination weddings and high-end social events can generate significant revenue. The development of wellness and spa facilities catering to a discerning clientele can enhance the appeal of luxury hotels. Collaborating with local artisans and showcasing regional crafts and cuisine can provide an authentic and memorable guest experience. The increasing trend of staycations and weekend getaways from nearby cities offers a potential market for luxury hotels in Kolhapur. Offering personalized services and exclusive packages tailored to individual guest preferences can foster loyalty and attract high-value customers.
Challenges
The Luxury Hotel market in Kolhapur, Maharashtra, India, faces challenges related to attracting and retaining a consistent flow of high-spending guests outside of peak tourist seasons or major events. Maintaining the high standards of service and amenities expected in the luxury segment requires ongoing investment in staff training and property upkeep. Competing with established luxury hotel brands in larger cities requires a strong unique selling proposition and effective marketing. Ensuring the privacy and security of high-profile guests is paramount. Adapting to the evolving expectations of luxury travelers, including technological integration and sustainability practices, requires continuous innovation. Building a strong brand reputation and garnering positive word-of-mouth in a smaller market is crucial for long-term success.
Luxury Hotel Market: Segmentation Insights
The global luxury hotel market is segmented based on Room Type, Category, and Region. All the segments of the luxury hotel market have been analyzed based on present & future trends and the market is estimated from 2024 to 2032.
Based on Room Type, the global luxury hotel market is divided into Luxury, Upper-upscale, Upscale.
On the basis of Category, the global luxury hotel market is bifurcated into Chain, Independent.
Luxury Hotel Market: Regional Insights
The Asia-Pacific (APAC) region, led by China, dominates the global luxury hotel market, capturing over 35% of the market share in 2024. This dominance is driven by China's booming domestic tourism, rapid urbanization, and a surge in ultra-high-net-worth individuals (UHNWIs) seeking exclusive experiences. Key destinations like Shanghai, Beijing, and Hainan Island have seen a proliferation of five-star brands (e.g., Aman, Mandarin Oriental, St. Regis), while Japan, Thailand, and the Maldives attract luxury travelers with unique cultural and beachfront offerings.
Europe ranks second, with France, Italy, and Switzerland leading due to their historic palaces, alpine resorts, and gourmet tourism. Meanwhile, North America remains a strong contender, with U.S. cities (New York, Miami, Los Angeles) and Caribbean resorts catering to business elites and celebrities. However, APAC's growth outpaces other regions, fueled by government-backed tourism initiatives, rising affluence, and a preference for opulent service standards.
Luxury Hotel Market: Competitive Landscape
The luxury hotel market report offers a thorough analysis of both established and emerging players within the market. It includes a detailed list of key companies, categorized based on the types of products they offer and other relevant factors. The report also highlights the market entry year for each player, providing further context for the research analysis.
The "Global Luxury Hotel Market" study offers valuable insights, focusing on the global market landscape, with an emphasis on major industry players such as;
- Marriott International Inc. (U.S.)
- Hyatt Hotels Corporation (U.S.)
- InterContinental Hotels Group plc (U.K.)
- Four Seasons Hotel Limited (Canada)
- Hilton Hotels & Resorts (U.S.)
- Kempinski Hotels S.A. (Switzerland)
- Accor SA (France)
- The Indian Hotels Company Limited (India)
- Mandarin Oriental Hotel Group (Hong Kong)
- Shangri La International Hotel Management Ltd. (Hong Kong)
The Global Luxury Hotel Market is Segmented as Follows:
By Room Type
- Luxury
- Upper-upscale
- Upscale
By Category
- Chain
- Independent
By Region
- North America
- The U.S.
- Canada
- Mexico
- Europe
- France
- The UK
- Spain
- Germany
- Italy
- Rest of Europe
- Asia Pacific
- China
- Japan
- India
- Australia
- South Korea
- Rest of Asia Pacific
- The Middle East & Africa
- Saudi Arabia
- UAE
- Egypt
- Kuwait
- South Africa
- Rest of the Middle East & Africa
- Latin America
- Brazil
- Argentina
- Rest of Latin America
Market Evolution
This section evaluates the market position of the product or service by examining its development pathway and competitive dynamics. It provides a detailed overview of the product's growth stages, including the early (historical) phase, the mid-stage, and anticipated future advancements influenced by innovation and emerging technologies.
Porter’s Analysis
Porter’s Five Forces framework offers a strategic lens for assessing competitor behavior and the positioning of key players in the luxury hotel industry. This section explores the external factors shaping competitive dynamics and influencing market strategies in the years ahead. The analysis focuses on five critical forces:
- Competitive Rivalry
- Threat of New Entrants
- Threat of Substitutes
- Supplier Bargaining Power
- Buyer Bargaining Power
Value Chain & Market Attractiveness Analysis
The value chain analysis helps businesses optimize operations by mapping the product flow from suppliers to end consumers, identifying opportunities to streamline processes and gain a competitive edge. Segment-wise market attractiveness analysis evaluates key dimensions like product categories, demographics, and regions, assessing growth potential, market size, and profitability. This enables businesses to focus resources on high-potential segments for better ROI and long-term value.
PESTEL Analysis
PESTEL analysis is a powerful tool in market research reports that enhances market understanding by systematically examining the external macro-environmental factors influencing a business or industry. The acronym stands for Political, Economic, Social, Technological, Environmental, and Legal factors. By evaluating these dimensions, PESTEL analysis provides a comprehensive overview of the broader context within which a market operates, helping businesses identify potential opportunities and threats.
- Political factors assess government policies, stability, trade regulations, and political risks that could impact market operations.
- Economic factors examine variables like inflation, exchange rates, economic growth, and consumer spending power to determine market viability.
- Social factors explore cultural trends, demographics, and lifestyle changes that shape consumer behavior and preferences.
- Technological factors evaluate innovation, R&D, and technological advancements affecting product development and operational efficiencies.
- Environmental factors focus on sustainability, climate change impacts, and eco-friendly practices shaping market trends.
- Legal factors address compliance requirements, industry regulations, and intellectual property laws impacting market entry and operations.
Import-Export Analysis & Pricing Analysis
An import-export analysis is vital for market research, revealing global trade dynamics, trends, and opportunities. It examines trade volumes, product categories, and regional competitiveness, offering insights into supply chains and market demand. This section also analyzes past and future pricing trends, helping businesses optimize strategies and enabling consumers to assess product value effectively.
Luxury Hotel Market: Company Profiles
The report identifies key players in the luxury hotel market through competitive landscape and company profiles, evaluating their offerings, financial performance, strategies, and market positioning. It includes a SWOT analysis of the top 3-5 companies, assessing strengths, weaknesses, opportunities, and threats. The competitive landscape highlights rankings, recent activities (mergers, acquisitions, partnerships, product launches), and regional footprints using the Ace matrix. Customization is available to meet client-specific needs.
Regional & Industry Footprint
This section details the geographic reach, sales networks, and market penetration of companies profiled in the luxury hotel report, showcasing their operations and distribution across regions. It analyzes the alignment of companies with specific industry verticals, highlighting the industries they serve and the scope of their products and services within those sectors.
Ace Matrix
This section categorizes companies into four distinct groups—Active, Cutting Edge, Innovator, and Emerging—based on their product and business strategies. The evaluation of product strategy focuses on aspects such as the range and depth of offerings, commitment to innovation, product functionalities, and scalability. Key elements like global reach, sector coverage, strategic acquisitions, and long-term growth plans are considered for business strategy. This analysis provides a detailed view of companies' position within the market and highlights their potential for future growth and development.
Research Methodology
The qualitative and quantitative insights for the luxury hotel market are derived through a multi-faceted research approach, combining input from subject matter experts, primary research, and secondary data sources. Primary research includes gathering critical information via face-to-face or telephonic interviews, surveys, questionnaires, and feedback from industry professionals, key opinion leaders (KOLs), and customers. Regular interviews with industry experts are conducted to deepen the analysis and reinforce the existing data, ensuring a robust and well-rounded market understanding.
Secondary research for this report was carried out by the Market Research Store team, drawing on a variety of authoritative sources, such as:
- Official company websites, annual reports, financial statements, investor presentations, and SEC filings
- Internal and external proprietary databases, as well as relevant patent and regulatory databases
- Government publications, national statistical databases, and industry-specific market reports
- Media coverage, including news articles, press releases, and webcasts about market participants
- Paid industry databases for detailed market insights
Market Research Store conducted in-depth consultations with various key opinion leaders in the industry, including senior executives from top companies and regional leaders from end-user organizations. This effort aimed to gather critical insights on factors such as the market share of dominant brands in specific countries and regions, along with pricing strategies for products and services.
To determine total sales data, the research team conducted primary interviews across multiple countries with influential stakeholders, including:
- Distributors
- Marketing, Brand, and Product Managers
- Procurement and Production Managers
- Sales and Regional Sales Managers, Country Managers
- Technical Specialists
- C-Level Executives
These subject matter experts, with their extensive industry experience, helped validate and refine the findings. For secondary research, data was sourced from a wide range of materials, including online resources, company annual reports, industry publications, research papers, association reports, and government websites. These various sources provide a comprehensive and well-rounded perspective on the market.
Frequently Asked Questions
Table Of Content
List of Tables and Figures Figure Product Picture of Luxury Hotel Table Product Specification of Luxury Hotel Figure Market Concentration Ratio and Market Maturity Analysis of Luxury Hotel Figure Global Luxury Hotel Value ($) and Growth Rate from 2014-2024 Table Different Types of Luxury Hotel Figure Global Luxury Hotel Value ($) Segment by Type from 2014-2019 Figure Business Hotels Picture Figure Suite Hotels Picture Figure Resorts Picture Table Different Applications of Luxury Hotel Figure Global Luxury Hotel Value ($) Segment by Applications from 2014-2019 Figure Room Picture Figure F&B Picture Figure SPA Picture Figure Others Picture Table Research Regions of Luxury Hotel Figure North America Luxury Hotel Production Value ($) and Growth Rate (2014-2019) Figure Europe Luxury Hotel Production Value ($) and Growth Rate (2014-2019) Table China Luxury Hotel Production Value ($) and Growth Rate (2014-2019) Table Japan Luxury Hotel Production Value ($) and Growth Rate (2014-2019) Table Middle East & Africa Luxury Hotel Production Value ($) and Growth Rate (2014-2019) Table India Luxury Hotel Production Value ($) and Growth Rate (2014-2019) Table South America Luxury Hotel Production Value ($) and Growth Rate (2014-2019) Table Emerging Countries of Luxury Hotel Table Growing Market of Luxury Hotel Figure Industry Chain Analysis of Luxury Hotel Table Upstream Raw Material Suppliers of Luxury Hotel with Contact Information Table Major Players Manufacturing Base and Market Share ($) of Luxury Hotel in 2018 Table Major Players Luxury Hotel Product Types in 2018 Figure Production Process of Luxury Hotel Figure Manufacturing Cost Structure of Luxury Hotel Figure Channel Status of Luxury Hotel Table Major Distributors of Luxury Hotel with Contact Information Table Major Downstream Buyers of Luxury Hotel with Contact Information Table Global Luxury Hotel Value ($) by Type (2014-2019) Table Global Luxury Hotel Value ($) Share by Type (2014-2019) Figure Global Luxury Hotel Value ($) Share by Type (2014-2019) Table Global Luxury Hotel Production by Type (2014-2019) Table Global Luxury Hotel Production Share by Type (2014-2019) Figure Global Luxury Hotel Production Share by Type (2014-2019) Figure Global Luxury Hotel Value ($) and Growth Rate of Business Hotels Figure Global Luxury Hotel Value ($) and Growth Rate of Suite Hotels Figure Global Luxury Hotel Value ($) and Growth Rate of Resorts Figure Global Luxury Hotel Price by Type (2014-2019) Table Global Luxury Hotel Consumption by Application (2014-2019) Table Global Luxury Hotel Consumption Market Share by Application (2014-2019) Figure Global Luxury Hotel Consumption Market Share by Application (2014-2019) Table Downstream Buyers Introduction by Application Figure Global Luxury Hotel Consumption and Growth Rate of Room (2014-2019) Figure Global Luxury Hotel Consumption and Growth Rate of F&B (2014-2019) Figure Global Luxury Hotel Consumption and Growth Rate of SPA (2014-2019) Figure Global Luxury Hotel Consumption and Growth Rate of Others (2014-2019) Table Global Luxury Hotel Value ($) by Region (2014-2019) Table Global Luxury Hotel Value ($) Market Share by Region (2014-2019) Figure Global Luxury Hotel Value ($) Market Share by Region (2014-2019) Table Global Luxury Hotel Production by Region (2014-2019) Table Global Luxury Hotel Production Market Share by Region (2014-2019) Figure Global Luxury Hotel Production Market Share by Region (2014-2019) Table Global Luxury Hotel Production, Value ($), Price and Gross Margin (2014-2019) Table North America Luxury Hotel Production, Value ($), Price and Gross Margin (2014-2019) Table Europe Luxury Hotel Production, Value ($), Price and Gross Margin (2014-2019) Table China Luxury Hotel Production, Value ($), Price and Gross Margin (2014-2019) Table Japan Luxury Hotel Production, Value ($), Price and Gross Margin (2014-2019) Table Middle East & Africa Luxury Hotel Production, Value ($), Price and Gross Margin (2014-2019) Table India Luxury Hotel Production, Value ($), Price and Gross Margin (2014-2019) Table South America Luxury Hotel Production, Value ($), Price and Gross Margin (2014-2019) Table Global Luxury Hotel Consumption by Regions (2014-2019) Figure Global Luxury Hotel Consumption Share by Regions (2014-2019) Table North America Luxury Hotel Production, Consumption, Export, Import (2014-2019) Table Europe Luxury Hotel Production, Consumption, Export, Import (2014-2019) Table China Luxury Hotel Production, Consumption, Export, Import (2014-2019) Table Japan Luxury Hotel Production, Consumption, Export, Import (2014-2019) Table Middle East & Africa Luxury Hotel Production, Consumption, Export, Import (2014-2019) Table India Luxury Hotel Production, Consumption, Export, Import (2014-2019) Table South America Luxury Hotel Production, Consumption, Export, Import (2014-2019) Figure North America Luxury Hotel Production and Growth Rate Analysis Figure North America Luxury Hotel Consumption and Growth Rate Analysis Figure North America Luxury Hotel SWOT Analysis Figure Europe Luxury Hotel Production and Growth Rate Analysis Figure Europe Luxury Hotel Consumption and Growth Rate Analysis Figure Europe Luxury Hotel SWOT Analysis Figure China Luxury Hotel Production and Growth Rate Analysis Figure China Luxury Hotel Consumption and Growth Rate Analysis Figure China Luxury Hotel SWOT Analysis Figure Japan Luxury Hotel Production and Growth Rate Analysis Figure Japan Luxury Hotel Consumption and Growth Rate Analysis Figure Japan Luxury Hotel SWOT Analysis Figure Middle East & Africa Luxury Hotel Production and Growth Rate Analysis Figure Middle East & Africa Luxury Hotel Consumption and Growth Rate Analysis Figure Middle East & Africa Luxury Hotel SWOT Analysis Figure India Luxury Hotel Production and Growth Rate Analysis Figure India Luxury Hotel Consumption and Growth Rate Analysis Figure India Luxury Hotel SWOT Analysis Figure South America Luxury Hotel Production and Growth Rate Analysis Figure South America Luxury Hotel Consumption and Growth Rate Analysis Figure South America Luxury Hotel SWOT Analysis Figure Top 3 Market Share of Luxury Hotel Companies Figure Top 6 Market Share of Luxury Hotel Companies Table Mergers, Acquisitions and Expansion Analysis Table Company Profiles Table Product Introduction Table Taj Hotels Production, Value ($), Price, Gross Margin 2014-2019 Figure Taj Hotels Production and Growth Rate Figure Taj Hotels Value ($) Market Share 2014-2019 Figure Taj Hotels Market Share of Luxury Hotel Segmented by Region in 2018 Table Company Profiles Table Product Introduction Table Aman Production, Value ($), Price, Gross Margin 2014-2019 Figure Aman Production and Growth Rate Figure Aman Value ($) Market Share 2014-2019 Figure Aman Market Share of Luxury Hotel Segmented by Region in 2018 Table Company Profiles Table Product Introduction Table Oberoi Production, Value ($), Price, Gross Margin 2014-2019 Figure Oberoi Production and Growth Rate Figure Oberoi Value ($) Market Share 2014-2019 Figure Oberoi Market Share of Luxury Hotel Segmented by Region in 2018 Table Company Profiles Table Product Introduction Table Jumirah Production, Value ($), Price, Gross Margin 2014-2019 Figure Jumirah Production and Growth Rate Figure Jumirah Value ($) Market Share 2014-2019 Figure Jumirah Market Share of Luxury Hotel Segmented by Region in 2018 Table Company Profiles Table Product Introduction Table InterContinental Production, Value ($), Price, Gross Margin 2014-2019 Figure InterContinental Production and Growth Rate Figure InterContinental Value ($) Market Share 2014-2019 Figure InterContinental Market Share of Luxury Hotel Segmented by Region in 2018 Table Company Profiles Table Product Introduction Table Peninsula Hotels Production, Value ($), Price, Gross Margin 2014-2019 Figure Peninsula Hotels Production and Growth Rate Figure Peninsula Hotels Value ($) Market Share 2014-2019 Figure Peninsula Hotels Market Share of Luxury Hotel Segmented by Region in 2018 Table Company Profiles Table Product Introduction Table Amanbagh Production, Value ($), Price, Gross Margin 2014-2019 Figure Amanbagh Production and Growth Rate Figure Amanbagh Value ($) Market Share 2014-2019 Figure Amanbagh Market Share of Luxury Hotel Segmented by Region in 2018 Table Company Profiles Table Product Introduction Table Bayan Tree Production, Value ($), Price, Gross Margin 2014-2019 Figure Bayan Tree Production and Growth Rate Figure Bayan Tree Value ($) Market Share 2014-2019 Figure Bayan Tree Market Share of Luxury Hotel Segmented by Region in 2018 Table Company Profiles Table Product Introduction Table Mandarin Oriental Production, Value ($), Price, Gross Margin 2014-2019 Figure Mandarin Oriental Production and Growth Rate Figure Mandarin Oriental Value ($) Market Share 2014-2019 Figure Mandarin Oriental Market Share of Luxury Hotel Segmented by Region in 2018 Table Company Profiles Table Product Introduction Table Marriott International Production, Value ($), Price, Gross Margin 2014-2019 Figure Marriott International Production and Growth Rate Figure Marriott International Value ($) Market Share 2014-2019 Figure Marriott International Market Share of Luxury Hotel Segmented by Region in 2018 Table Company Profiles Table Product Introduction Table MövenpickHotels & Resorts Production, Value ($), Price, Gross Margin 2014-2019 Figure MövenpickHotels & Resorts Production and Growth Rate Figure MövenpickHotels & Resorts Value ($) Market Share 2014-2019 Figure MövenpickHotels & Resorts Market Share of Luxury Hotel Segmented by Region in 2018 Table Company Profiles Table Product Introduction Table Four Seasons Production, Value ($), Price, Gross Margin 2014-2019 Figure Four Seasons Production and Growth Rate Figure Four Seasons Value ($) Market Share 2014-2019 Figure Four Seasons Market Share of Luxury Hotel Segmented by Region in 2018 Table Company Profiles Table Product Introduction Table Rosewood Production, Value ($), Price, Gross Margin 2014-2019 Figure Rosewood Production and Growth Rate Figure Rosewood Value ($) Market Share 2014-2019 Figure Rosewood Market Share of Luxury Hotel Segmented by Region in 2018 Table Global Luxury Hotel Market Value ($) Forecast, by Type Table Global Luxury Hotel Market Volume Forecast, by Type Figure Global Luxury Hotel Market Value ($) and Growth Rate Forecast of Business Hotels (2019-2024) Figure Global Luxury Hotel Market Volume and Growth Rate Forecast of Business Hotels (2019-2024) Figure Global Luxury Hotel Market Value ($) and Growth Rate Forecast of Suite Hotels (2019-2024) Figure Global Luxury Hotel Market Volume and Growth Rate Forecast of Suite Hotels (2019-2024) Figure Global Luxury Hotel Market Value ($) and Growth Rate Forecast of Resorts (2019-2024) Figure Global Luxury Hotel Market Volume and Growth Rate Forecast of Resorts (2019-2024) Table Global Market Value ($) Forecast by Application (2019-2024) Table Global Market Volume Forecast by Application (2019-2024) Figure Global Luxury Hotel Consumption and Growth Rate of Room (2014-2019) Figure Global Luxury Hotel Consumption and Growth Rate of F&B (2014-2019) Figure Global Luxury Hotel Consumption and Growth Rate of SPA (2014-2019) Figure Global Luxury Hotel Consumption and Growth Rate of Others (2014-2019) Figure Market Value ($) and Growth Rate Forecast of Others (2019-2024) Figure Market Volume and Growth Rate Forecast of Others (2019-2024) Figure North America Market Value ($) and Growth Rate Forecast (2019-2024) Table North America Consumption and Growth Rate Forecast (2019-2024) Figure Europe Market Value ($) and Growth Rate Forecast (2019-2024) Table Europe Consumption and Growth Rate Forecast (2019-2024) Figure China Market Value ($) and Growth Rate Forecast (2019-2024) Table China Consumption and Growth Rate Forecast (2019-2024) Figure Japan Market Value ($) and Growth Rate Forecast (2019-2024) Table Japan Consumption and Growth Rate Forecast (2019-2024) Figure Middle East & Africa Market Value ($) and Growth Rate Forecast (2019-2024) Table Middle East & Africa Consumption and Growth Rate Forecast (2019-2024) Figure India Market Value ($) and Growth Rate Forecast (2019-2024) Table India Consumption and Growth Rate Forecast (2019-2024) Figure South America Market Value ($) and Growth Rate Forecast (2019-2024) Table South America Consumption and Growth Rate Forecast (2019-2024) Figure Industry Resource/Technology/Labor Importance Analysis Table New Entrants SWOT Analysis Table New Project Analysis of Investment Recovery
Inquiry For Buying
Luxury Hotel
Request Sample
Luxury Hotel