Non-alcoholic Beverages and Soft Drinks Market Size, Share, and Trends Analysis Report
CAGR :

| Market Size 2024 (Base Year) | USD 268.52 Billion |
| Market Size 2032 (Forecast Year) | USD 427.98 Billion |
| CAGR | 6% |
| Forecast Period | 2025 - 2032 |
| Historical Period | 2020 - 2024 |
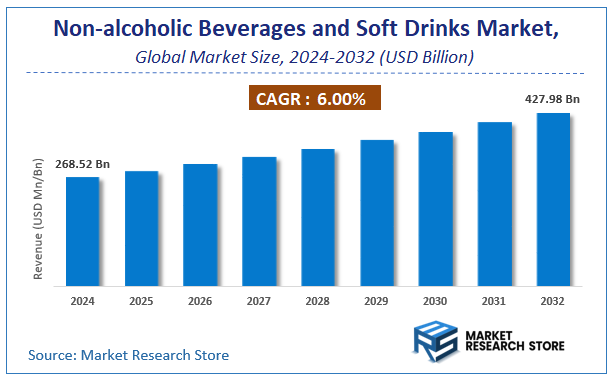
Market Research Store has published a report on the global non-alcoholic beverages and soft drinks market, estimating its value at USD 268.52 Billion in 2024, with projections indicating it will reach USD 427.98 Billion by the end of 2032. The market is expected to expand at a compound annual growth rate (CAGR) of around 6% over the forecast period. The report examines the factors driving market growth, the obstacles that could hinder this expansion, and the opportunities that may emerge in the non-alcoholic beverages and soft drinks industry. Additionally, it offers a detailed analysis of how these elements will affect demand dynamics and market performance throughout the forecast period.
To Get more Insights, Request a Free Sample
Non-alcoholic Beverages and Soft Drinks Market: Overview
The growth of the non-alcoholic beverages and soft drinks market is fueled by rising global demand across various industries and applications. The report highlights lucrative opportunities, analyzing cost structures, key segments, emerging trends, regional dynamics, and advancements by leading players to provide comprehensive market insights. The non-alcoholic beverages and soft drinks market report offers a detailed industry analysis from 2024 to 2032, combining quantitative and qualitative insights. It examines key factors such as pricing, market penetration, GDP impact, industry dynamics, major players, consumer behavior, and socio-economic conditions. Structured into multiple sections, the report provides a comprehensive perspective on the market from all angles.
Key sections of the non-alcoholic beverages and soft drinks market report include market segments, outlook, competitive landscape, and company profiles. Market Segments offer in-depth details based on Product Type, Flavor, Packaging, Distribution Channel, and other relevant classifications to support strategic marketing initiatives. Market Outlook thoroughly analyzes market trends, growth drivers, restraints, opportunities, challenges, Porter’s Five Forces framework, macroeconomic factors, value chain analysis, and pricing trends shaping the market now and in the future. The Competitive Landscape and Company Profiles section highlights major players, their strategies, and market positioning to guide investment and business decisions. The report also identifies innovation trends, new business opportunities, and investment prospects for the forecast period.
Key Highlights:
- As per the analysis shared by our research analyst, the global non-alcoholic beverages and soft drinks market is estimated to grow annually at a CAGR of around 6% over the forecast period (2025-2032).
- In terms of revenue, the global non-alcoholic beverages and soft drinks market size was valued at around USD 268.52 Billion in 2024 and is projected to reach USD 427.98 Billion by 2032.
- The market is projected to grow at a significant rate due to growing shift toward healthier, functional drink options.
- Based on the Product Type, the Carbonated Soft Drinks segment is growing at a high rate and will continue to dominate the global market as per industry projections.
- On the basis of Flavor, the Original segment is anticipated to command the largest market share.
- In terms of Packaging, the Cans segment is projected to lead the global market.
- By Distribution Channel, the Supermarkets/Hypermarkets segment is predicted to dominate the global market.
- Based on region, Asia-Pacific is projected to dominate the global market during the forecast period.
Non-alcoholic Beverages and Soft Drinks Market: Report Scope
This report thoroughly analyzes the non-alcoholic beverages and soft drinks market, exploring its historical trends, current state, and future projections. The market estimates presented result from a robust research methodology, incorporating primary research, secondary sources, and expert opinions. These estimates are influenced by the prevailing market dynamics as well as key economic, social, and political factors. Furthermore, the report considers the impact of regulations, government expenditures, and advancements in research and development on the market. Both positive and negative shifts are evaluated to ensure a comprehensive and accurate market outlook.
| Report Attributes | Report Details |
|---|---|
| Report Name | Non-alcoholic Beverages and Soft Drinks Market |
| Market Size in 2024 | USD 268.52 Billion |
| Market Forecast in 2032 | USD 427.98 Billion |
| Growth Rate | CAGR of 6% |
| Number of Pages | 207 |
| Key Companies Covered | Kraft Foods Group Inc, Danone, DydoDrincoInc., Coca-Cola Company, Dr. Pepper Snapple Group Inc., Unilever, San Benedetto, Nestlé S.A., Attitude Drinks Inc., PepsiCo Inc., Parle Agro Ltd |
| Segments Covered | By Product Type, By Flavor, By Packaging, By Distribution Channel, and By Region |
| Regions Covered | North America, Europe, Asia Pacific (APAC), Latin America, Middle East, and Africa (MEA) |
| Base Year | 2024 |
| Historical Year | 2020 to 2024 |
| Forecast Year | 2025 to 2032 |
| Customization Scope | Avail customized purchase options to meet your exact research needs. Request For Customization |
Non-alcoholic Beverages and Soft Drinks Market: Dynamics
Key Growth Drivers :
The RTD coffee and tea market is experiencing rapid expansion, primarily fueled by shifting consumer lifestyles and the demand for convenience. The rise of busy, on-the-go consumers, particularly millennials and Gen Z, has created a strong need for quick, accessible, and ready-to-consume beverages that don't require preparation. This is complemented by a growing focus on health and wellness, which is driving a move away from sugary carbonated drinks toward beverages perceived as healthier, such as unsweetened teas, cold-brew coffees, and products with functional benefits like added antioxidants or protein. The premiumization trend, where consumers are willing to pay more for high-quality, artisanal, and single-origin drinks, is also a significant driver. Furthermore, the expansion of e-commerce and a wide array of distribution channels, including supermarkets, convenience stores, and vending machines, have made these products easily available, contributing to their widespread popularity.
Restraints :
Despite the market's robust growth, it faces several significant restraints. A major challenge is the high cost of production, which is influenced by the volatility of raw material prices, such as coffee beans and tea leaves. The need for specialized packaging to ensure product stability and a longer shelf life also adds to the overall cost, which can make these products more expensive than traditional brewed beverages. Another restraint is the lingering perception among some consumers that bottled or canned drinks are not as fresh or flavorful as their freshly brewed counterparts. The market also faces intense competition from a variety of other beverages, including energy drinks, carbonated soft drinks, and specialty drinks from coffee shops and cafes, which can limit market share for individual brands.
Opportunities :
The RTD coffee and tea market presents numerous opportunities for innovation and growth. A key opportunity lies in catering to specific dietary trends and health-conscious consumers by introducing a wider variety of "better-for-you" options. This includes low-sugar, organic, plant-based, and functional beverages with added ingredients like adaptogens, probiotics, and vitamins. There is also a significant opportunity for product diversification by exploring new flavors and unique brewing methods, such as nitro-infused coffees and exotic fruit-infused teas. The rise of e-commerce allows brands to create direct-to-consumer models, enabling them to build a stronger brand identity and offer highly customized products. Lastly, there's potential for growth in emerging markets, where rising disposable incomes and urbanization are creating a new consumer base for premium and convenient beverages.
Challenges :
The market is highly fragmented and competitive, with numerous international players and local startups vying for consumer attention. This intense competition can lead to price wars and a constant need for innovation, which can be challenging for smaller companies with limited R&D budgets. The industry must also address consumer concerns regarding the environmental impact of single-use packaging. Brands that fail to adopt sustainable and eco-friendly packaging solutions may risk losing favor with a growing segment of environmentally conscious consumers. Lastly, maintaining product quality and consistency across a complex and often global supply chain is a significant operational challenge, as any disruption can affect the availability and taste of the final product.
Non-alcoholic Beverages and Soft Drinks Market: Segmentation Insights
The global non-alcoholic beverages and soft drinks market is segmented based on Product Type, Flavor, Packaging, Distribution Channel, and Region. All the segments of the non-alcoholic beverages and soft drinks market have been analyzed based on present & future trends and the market is estimated from 2024 to 2032.
Based on Product Type, the global non-alcoholic beverages and soft drinks market is divided into Carbonated Soft Drinks, Juice, Bottled Water, Functional Drinks, Sports & Energy Drinks, Ready-to-Drink Tea & Coffee, Others.
On the basis of Flavor, the global non-alcoholic beverages and soft drinks market is bifurcated into Original, Flavored.
In terms of Packaging, the global non-alcoholic beverages and soft drinks market is categorized into Cans, Bottles, Cartons, Others.
Based on Distribution Channel, the global non-alcoholic beverages and soft drinks market is split into Supermarkets/Hypermarkets, Convenience Stores, Online Retail, Vending Machines.
Non-alcoholic Beverages and Soft Drinks Market: Regional Insights
North America is the dominant region in the global non-alcoholic beverages and soft drinks market, holding a revenue share of over 30% as of recent market analyses. This leadership is driven by several key factors: high per capita consumption of carbonated soft drinks, a well-established and highly competitive landscape dominated by global giants like The Coca-Cola Company and PepsiCo, and a culture of constant innovation in flavors, sweeteners (e.g., zero-sugar options), and functional beverages (e.g., energy drinks, enhanced waters).
The region's mature retail and foodservice distribution networks ensure widespread product availability. While the Asia-Pacific region is the fastest-growing market due to its vast population and increasing urbanization, its market is more fragmented with lower per-capita spending. Europe is a significant but mature market with stricter regulations on sugar content. North America's combination of high consumption rates, strong brand loyalty, and relentless product development solidifies its position as the value and volume leader in the global non-alcoholic beverage industry.
Non-alcoholic Beverages and Soft Drinks Market: Competitive Landscape
The non-alcoholic beverages and soft drinks market report offers a thorough analysis of both established and emerging players within the market. It includes a detailed list of key companies, categorized based on the types of products they offer and other relevant factors. The report also highlights the market entry year for each player, providing further context for the research analysis.
The "Global Non-alcoholic Beverages and Soft Drinks Market" study offers valuable insights, focusing on the global market landscape, with an emphasis on major industry players such as;
- Kraft Foods Group Inc
- Danone
- DydoDrincoInc.
- Coca-Cola Company
- Dr. Pepper Snapple Group Inc.
- Unilever
- San Benedetto
- Nestlé S.A.
- Attitude Drinks Inc.
- PepsiCo Inc.
- Parle Agro Ltd
The Global Non-alcoholic Beverages and Soft Drinks Market is Segmented as Follows:
By Product Type
- Carbonated Soft Drinks
- Juice
- Bottled Water
- Functional Drinks
- Sports & Energy Drinks
- Ready-to-Drink Tea & Coffee
- Others
By Flavor
- Original
- Flavored
By Packaging
- Cans
- Bottles
- Cartons
- Others
By Distribution Channel
- Supermarkets/Hypermarkets
- Convenience Stores
- Online Retail
- Vending Machines
By Region
- North America
- The U.S.
- Canada
- Mexico
- Europe
- France
- The UK
- Spain
- Germany
- Italy
- Rest of Europe
- Asia Pacific
- China
- Japan
- India
- Australia
- South Korea
- Rest of Asia Pacific
- The Middle East & Africa
- Saudi Arabia
- UAE
- Egypt
- Kuwait
- South Africa
- Rest of the Middle East & Africa
- Latin America
- Brazil
- Argentina
- Rest of Latin America
Frequently Asked Questions
Table Of Content
Table of Content 1 Report Overview 1.1 Study Scope 1.2 Key Market Segments 1.3 Regulatory Scenario by Region/Country 1.4 Market Investment Scenario Strategic 1.5 Market Analysis by Type 1.5.1 Global Non-alcoholic Beverages and Soft Drinks Market Share by Type (2020-2026) 1.5.2 Soft Drinks 1.5.3 Bottled Water 1.5.4 Tea and Coffee 1.5.5 Juice 1.5.6 Dairy Drinks 1.5.7 Others 1.6 Market by Application 1.6.1 Global Non-alcoholic Beverages and Soft Drinks Market Share by Application (2020-2026) 1.6.2 Supermarkets and Hypermarkets 1.6.3 Convenience Stores 1.6.4 Online Stores 1.6.5 Others 1.7 Non-alcoholic Beverages and Soft Drinks Industry Development Trends under COVID-19 Outbreak 1.7.1 Global COVID-19 Status Overview 1.7.2 Influence of COVID-19 Outbreak on Non-alcoholic Beverages and Soft Drinks Industry Development 2. Global Market Growth Trends 2.1 Industry Trends 2.1.1 SWOT Analysis 2.1.2 Porter’s Five Forces Analysis 2.2 Potential Market and Growth Potential Analysis 2.3 Industry News and Policies by Regions 2.3.1 Industry News 2.3.2 Industry Policies 2.4 Industry Trends Under COVID-19 3 Value Chain of Non-alcoholic Beverages and Soft Drinks Market 3.1 Value Chain Status 3.2 Non-alcoholic Beverages and Soft Drinks Manufacturing Cost Structure Analysis 3.2.1 Production Process Analysis 3.2.2 Manufacturing Cost Structure of Non-alcoholic Beverages and Soft Drinks 3.2.3 Labor Cost of Non-alcoholic Beverages and Soft Drinks 3.2.3.1 Labor Cost of Non-alcoholic Beverages and Soft Drinks Under COVID-19 3.3 Sales and Marketing Model Analysis 3.4 Downstream Major Customer Analysis (by Region) 3.5 Value Chain Status Under COVID-19 4 Players Profiles 4.1 Kraft Foods Group Inc 4.1.1 Kraft Foods Group Inc Basic Information 4.1.2 Non-alcoholic Beverages and Soft Drinks Product Profiles, Application and Specification 4.1.3 Kraft Foods Group Inc Non-alcoholic Beverages and Soft Drinks Market Performance (2015-2020) 4.1.4 Kraft Foods Group Inc Business Overview 4.2 Danone 4.2.1 Danone Basic Information 4.2.2 Non-alcoholic Beverages and Soft Drinks Product Profiles, Application and Specification 4.2.3 Danone Non-alcoholic Beverages and Soft Drinks Market Performance (2015-2020) 4.2.4 Danone Business Overview 4.3 DydoDrincoInc. 4.3.1 DydoDrincoInc. Basic Information 4.3.2 Non-alcoholic Beverages and Soft Drinks Product Profiles, Application and Specification 4.3.3 DydoDrincoInc. Non-alcoholic Beverages and Soft Drinks Market Performance (2015-2020) 4.3.4 DydoDrincoInc. Business Overview 4.4 Coca-Cola Company 4.4.1 Coca-Cola Company Basic Information 4.4.2 Non-alcoholic Beverages and Soft Drinks Product Profiles, Application and Specification 4.4.3 Coca-Cola Company Non-alcoholic Beverages and Soft Drinks Market Performance (2015-2020) 4.4.4 Coca-Cola Company Business Overview 4.5 Dr. Pepper Snapple Group Inc. 4.5.1 Dr. Pepper Snapple Group Inc. Basic Information 4.5.2 Non-alcoholic Beverages and Soft Drinks Product Profiles, Application and Specification 4.5.3 Dr. Pepper Snapple Group Inc. Non-alcoholic Beverages and Soft Drinks Market Performance (2015-2020) 4.5.4 Dr. Pepper Snapple Group Inc. Business Overview 4.6 Unilever 4.6.1 Unilever Basic Information 4.6.2 Non-alcoholic Beverages and Soft Drinks Product Profiles, Application and Specification 4.6.3 Unilever Non-alcoholic Beverages and Soft Drinks Market Performance (2015-2020) 4.6.4 Unilever Business Overview 4.7 San Benedetto 4.7.1 San Benedetto Basic Information 4.7.2 Non-alcoholic Beverages and Soft Drinks Product Profiles, Application and Specification 4.7.3 San Benedetto Non-alcoholic Beverages and Soft Drinks Market Performance (2015-2020) 4.7.4 San Benedetto Business Overview 4.8 Nestlé S.A. 4.8.1 Nestlé S.A. Basic Information 4.8.2 Non-alcoholic Beverages and Soft Drinks Product Profiles, Application and Specification 4.8.3 Nestlé S.A. Non-alcoholic Beverages and Soft Drinks Market Performance (2015-2020) 4.8.4 Nestlé S.A. Business Overview 4.9 Attitude Drinks Inc. 4.9.1 Attitude Drinks Inc. Basic Information 4.9.2 Non-alcoholic Beverages and Soft Drinks Product Profiles, Application and Specification 4.9.3 Attitude Drinks Inc. Non-alcoholic Beverages and Soft Drinks Market Performance (2015-2020) 4.9.4 Attitude Drinks Inc. Business Overview 4.10 PepsiCo Inc. 4.10.1 PepsiCo Inc. Basic Information 4.10.2 Non-alcoholic Beverages and Soft Drinks Product Profiles, Application and Specification 4.10.3 PepsiCo Inc. Non-alcoholic Beverages and Soft Drinks Market Performance (2015-2020) 4.10.4 PepsiCo Inc. Business Overview 4.11 Parle Agro Ltd 4.11.1 Parle Agro Ltd Basic Information 4.11.2 Non-alcoholic Beverages and Soft Drinks Product Profiles, Application and Specification 4.11.3 Parle Agro Ltd Non-alcoholic Beverages and Soft Drinks Market Performance (2015-2020) 4.11.4 Parle Agro Ltd Business Overview 5 Global Non-alcoholic Beverages and Soft Drinks Market Analysis by Regions 5.1 Global Non-alcoholic Beverages and Soft Drinks Sales, Revenue and Market Share by Regions 5.1.1 Global Non-alcoholic Beverages and Soft Drinks Sales by Regions (2015-2020) 5.1.2 Global Non-alcoholic Beverages and Soft Drinks Revenue by Regions (2015-2020) 5.2 North America Non-alcoholic Beverages and Soft Drinks Sales and Growth Rate (2015-2020) 5.3 Europe Non-alcoholic Beverages and Soft Drinks Sales and Growth Rate (2015-2020) 5.4 Asia-Pacific Non-alcoholic Beverages and Soft Drinks Sales and Growth Rate (2015-2020) 5.5 Middle East and Africa Non-alcoholic Beverages and Soft Drinks Sales and Growth Rate (2015-2020) 5.6 South America Non-alcoholic Beverages and Soft Drinks Sales and Growth Rate (2015-2020) 6 North America Non-alcoholic Beverages and Soft Drinks Market Analysis by Countries 6.1 North America Non-alcoholic Beverages and Soft Drinks Sales, Revenue and Market Share by Countries 6.1.1 North America Non-alcoholic Beverages and Soft Drinks Sales by Countries (2015-2020) 6.1.2 North America Non-alcoholic Beverages and Soft Drinks Revenue by Countries (2015-2020) 6.1.3 North America Non-alcoholic Beverages and Soft Drinks Market Under COVID-19 6.2 United States Non-alcoholic Beverages and Soft Drinks Sales and Growth Rate (2015-2020) 6.2.1 United States Non-alcoholic Beverages and Soft Drinks Market Under COVID-19 6.3 Canada Non-alcoholic Beverages and Soft Drinks Sales and Growth Rate (2015-2020) 6.4 Mexico Non-alcoholic Beverages and Soft Drinks Sales and Growth Rate (2015-2020) 7 Europe Non-alcoholic Beverages and Soft Drinks Market Analysis by Countries 7.1 Europe Non-alcoholic Beverages and Soft Drinks Sales, Revenue and Market Share by Countries 7.1.1 Europe Non-alcoholic Beverages and Soft Drinks Sales by Countries (2015-2020) 7.1.2 Europe Non-alcoholic Beverages and Soft Drinks Revenue by Countries (2015-2020) 7.1.3 Europe Non-alcoholic Beverages and Soft Drinks Market Under COVID-19 7.2 Germany Non-alcoholic Beverages and Soft Drinks Sales and Growth Rate (2015-2020) 7.2.1 Germany Non-alcoholic Beverages and Soft Drinks Market Under COVID-19 7.3 UK Non-alcoholic Beverages and Soft Drinks Sales and Growth Rate (2015-2020) 7.3.1 UK Non-alcoholic Beverages and Soft Drinks Market Under COVID-19 7.4 France Non-alcoholic Beverages and Soft Drinks Sales and Growth Rate (2015-2020) 7.4.1 France Non-alcoholic Beverages and Soft Drinks Market Under COVID-19 7.5 Italy Non-alcoholic Beverages and Soft Drinks Sales and Growth Rate (2015-2020) 7.5.1 Italy Non-alcoholic Beverages and Soft Drinks Market Under COVID-19 7.6 Spain Non-alcoholic Beverages and Soft Drinks Sales and Growth Rate (2015-2020) 7.6.1 Spain Non-alcoholic Beverages and Soft Drinks Market Under COVID-19 7.7 Russia Non-alcoholic Beverages and Soft Drinks Sales and Growth Rate (2015-2020) 7.7.1 Russia Non-alcoholic Beverages and Soft Drinks Market Under COVID-19 8 Asia-Pacific Non-alcoholic Beverages and Soft Drinks Market Analysis by Countries 8.1 Asia-Pacific Non-alcoholic Beverages and Soft Drinks Sales, Revenue and Market Share by Countries 8.1.1 Asia-Pacific Non-alcoholic Beverages and Soft Drinks Sales by Countries (2015-2020) 8.1.2 Asia-Pacific Non-alcoholic Beverages and Soft Drinks Revenue by Countries (2015-2020) 8.1.3 Asia-Pacific Non-alcoholic Beverages and Soft Drinks Market Under COVID-19 8.2 China Non-alcoholic Beverages and Soft Drinks Sales and Growth Rate (2015-2020) 8.2.1 China Non-alcoholic Beverages and Soft Drinks Market Under COVID-19 8.3 Japan Non-alcoholic Beverages and Soft Drinks Sales and Growth Rate (2015-2020) 8.3.1 Japan Non-alcoholic Beverages and Soft Drinks Market Under COVID-19 8.4 South Korea Non-alcoholic Beverages and Soft Drinks Sales and Growth Rate (2015-2020) 8.4.1 South Korea Non-alcoholic Beverages and Soft Drinks Market Under COVID-19 8.5 Australia Non-alcoholic Beverages and Soft Drinks Sales and Growth Rate (2015-2020) 8.6 India Non-alcoholic Beverages and Soft Drinks Sales and Growth Rate (2015-2020) 8.6.1 India Non-alcoholic Beverages and Soft Drinks Market Under COVID-19 8.7 Southeast Asia Non-alcoholic Beverages and Soft Drinks Sales and Growth Rate (2015-2020) 8.7.1 Southeast Asia Non-alcoholic Beverages and Soft Drinks Market Under COVID-19 9 Middle East and Africa Non-alcoholic Beverages and Soft Drinks Market Analysis by Countries 9.1 Middle East and Africa Non-alcoholic Beverages and Soft Drinks Sales, Revenue and Market Share by Countries 9.1.1 Middle East and Africa Non-alcoholic Beverages and Soft Drinks Sales by Countries (2015-2020) 9.1.2 Middle East and Africa Non-alcoholic Beverages and Soft Drinks Revenue by Countries (2015-2020) 9.1.3 Middle East and Africa Non-alcoholic Beverages and Soft Drinks Market Under COVID-19 9.2 Saudi Arabia Non-alcoholic Beverages and Soft Drinks Sales and Growth Rate (2015-2020) 9.3 UAE Non-alcoholic Beverages and Soft Drinks Sales and Growth Rate (2015-2020) 9.4 Egypt Non-alcoholic Beverages and Soft Drinks Sales and Growth Rate (2015-2020) 9.5 Nigeria Non-alcoholic Beverages and Soft Drinks Sales and Growth Rate (2015-2020) 9.6 South Africa Non-alcoholic Beverages and Soft Drinks Sales and Growth Rate (2015-2020) 10 South America Non-alcoholic Beverages and Soft Drinks Market Analysis by Countries 10.1 South America Non-alcoholic Beverages and Soft Drinks Sales, Revenue and Market Share by Countries 10.1.1 South America Non-alcoholic Beverages and Soft Drinks Sales by Countries (2015-2020) 10.1.2 South America Non-alcoholic Beverages and Soft Drinks Revenue by Countries (2015-2020) 10.1.3 South America Non-alcoholic Beverages and Soft Drinks Market Under COVID-19 10.2 Brazil Non-alcoholic Beverages and Soft Drinks Sales and Growth Rate (2015-2020) 10.2.1 Brazil Non-alcoholic Beverages and Soft Drinks Market Under COVID-19 10.3 Argentina Non-alcoholic Beverages and Soft Drinks Sales and Growth Rate (2015-2020) 10.4 Columbia Non-alcoholic Beverages and Soft Drinks Sales and Growth Rate (2015-2020) 10.5 Chile Non-alcoholic Beverages and Soft Drinks Sales and Growth Rate (2015-2020) 11 Global Non-alcoholic Beverages and Soft Drinks Market Segment by Types 11.1 Global Non-alcoholic Beverages and Soft Drinks Sales, Revenue and Market Share by Types (2015-2020) 11.1.1 Global Non-alcoholic Beverages and Soft Drinks Sales and Market Share by Types (2015-2020) 11.1.2 Global Non-alcoholic Beverages and Soft Drinks Revenue and Market Share by Types (2015-2020) 11.2 Soft Drinks Sales and Price (2015-2020) 11.3 Bottled Water Sales and Price (2015-2020) 11.4 Tea and Coffee Sales and Price (2015-2020) 11.5 Juice Sales and Price (2015-2020) 11.6 Dairy Drinks Sales and Price (2015-2020) 11.7 Others Sales and Price (2015-2020) 12 Global Non-alcoholic Beverages and Soft Drinks Market Segment by Applications 12.1 Global Non-alcoholic Beverages and Soft Drinks Sales, Revenue and Market Share by Applications (2015-2020) 12.1.1 Global Non-alcoholic Beverages and Soft Drinks Sales and Market Share by Applications (2015-2020) 12.1.2 Global Non-alcoholic Beverages and Soft Drinks Revenue and Market Share by Applications (2015-2020) 12.2 Supermarkets and Hypermarkets Sales, Revenue and Growth Rate (2015-2020) 12.3 Convenience Stores Sales, Revenue and Growth Rate (2015-2020) 12.4 Online Stores Sales, Revenue and Growth Rate (2015-2020) 12.5 Others Sales, Revenue and Growth Rate (2015-2020) 13 Non-alcoholic Beverages and Soft Drinks Market Forecast by Regions (2020-2026) 13.1 Global Non-alcoholic Beverages and Soft Drinks Sales, Revenue and Growth Rate (2020-2026) 13.2 Non-alcoholic Beverages and Soft Drinks Market Forecast by Regions (2020-2026) 13.2.1 North America Non-alcoholic Beverages and Soft Drinks Market Forecast (2020-2026) 13.2.2 Europe Non-alcoholic Beverages and Soft Drinks Market Forecast (2020-2026) 13.2.3 Asia-Pacific Non-alcoholic Beverages and Soft Drinks Market Forecast (2020-2026) 13.2.4 Middle East and Africa Non-alcoholic Beverages and Soft Drinks Market Forecast (2020-2026) 13.2.5 South America Non-alcoholic Beverages and Soft Drinks Market Forecast (2020-2026) 13.3 Non-alcoholic Beverages and Soft Drinks Market Forecast by Types (2020-2026) 13.4 Non-alcoholic Beverages and Soft Drinks Market Forecast by Applications (2020-2026) 13.5 Non-alcoholic Beverages and Soft Drinks Market Forecast Under COVID-19 14 Appendix 14.1 Methodology 14.2 Research Data Source
Inquiry For Buying
Non-alcoholic Beverages and Soft Drinks
Request Sample
Non-alcoholic Beverages and Soft Drinks