Optical Food Sorting Machines Market Size, Share, and Trends Analysis Report
CAGR :

| Market Size 2023 (Base Year) | USD 200.36 Million |
| Market Size 2032 (Forecast Year) | USD 457.2 Million |
| CAGR | 8.6% |
| Forecast Period | 2024 - 2032 |
| Historical Period | 2018 - 2023 |
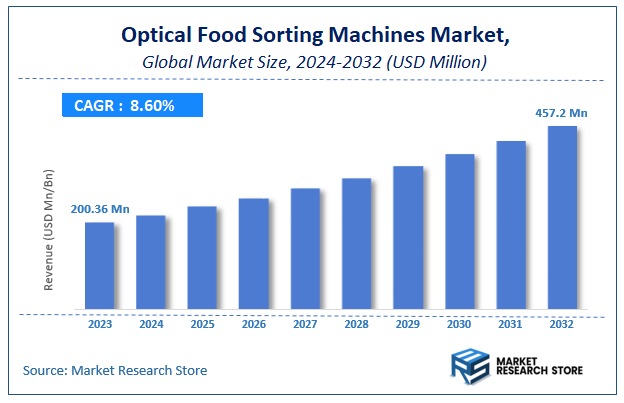
Market Research Store has published a report on the global optical food sorting machines market, estimating its value at USD 200.36 Million in 2023, with projections indicating it will reach USD 457.2 Million by the end of 2032. The market is expected to expand at a compound annual growth rate (CAGR) of around 8.6% over the forecast period. The report examines the factors driving market growth, the obstacles that could hinder this expansion, and the opportunities that may emerge in the optical food sorting machines industry. Additionally, it offers a detailed analysis of how these elements will affect demand dynamics and market performance throughout the forecast period.
To Get more Insights, Request a Free Sample
Optical Food Sorting Machines Market: Overview
The growth of the optical food sorting machines market is fueled by rising global demand across various industries and applications. The report highlights lucrative opportunities, analyzing cost structures, key segments, emerging trends, regional dynamics, and advancements by leading players to provide comprehensive market insights. The optical food sorting machines market report offers a detailed industry analysis from 2024 to 2032, combining quantitative and qualitative insights. It examines key factors such as pricing, market penetration, GDP impact, industry dynamics, major players, consumer behavior, and socio-economic conditions. Structured into multiple sections, the report provides a comprehensive perspective on the market from all angles.
Key sections of the optical food sorting machines market report include market segments, outlook, competitive landscape, and company profiles. Market Segments offer in-depth details based on Type, Technology, Application, End-User, and other relevant classifications to support strategic marketing initiatives. Market Outlook thoroughly analyzes market trends, growth drivers, restraints, opportunities, challenges, Porter’s Five Forces framework, macroeconomic factors, value chain analysis, and pricing trends shaping the market now and in the future. The Competitive Landscape and Company Profiles section highlights major players, their strategies, and market positioning to guide investment and business decisions. The report also identifies innovation trends, new business opportunities, and investment prospects for the forecast period.
Key Highlights:
- As per the analysis shared by our research analyst, the global optical food sorting machines market is estimated to grow annually at a CAGR of around 8.6% over the forecast period (2024-2032).
- In terms of revenue, the global optical food sorting machines market size was valued at around USD 200.36 Million in 2023 and is projected to reach USD 457.2 Million by 2032.
- The market is projected to grow at a significant rate due to Rising need for food safety, quality control, and automation drives adoption.
- Based on the Type, the Laser Sorting segment is growing at a high rate and will continue to dominate the global market as per industry projections.
- On the basis of Technology, the Near-Infrared (NIR) segment is anticipated to command the largest market share.
- In terms of Application, the Fruits & Vegetables segment is projected to lead the global market.
- By End-User, the Food Processing Companies segment is predicted to dominate the global market.
- Based on region, North America is projected to dominate the global market during the forecast period.
Optical Food Sorting Machines Market: Report Scope
This report thoroughly analyzes the optical food sorting machines market, exploring its historical trends, current state, and future projections. The market estimates presented result from a robust research methodology, incorporating primary research, secondary sources, and expert opinions. These estimates are influenced by the prevailing market dynamics as well as key economic, social, and political factors. Furthermore, the report considers the impact of regulations, government expenditures, and advancements in research and development on the market. Both positive and negative shifts are evaluated to ensure a comprehensive and accurate market outlook.
| Report Attributes | Report Details |
|---|---|
| Report Name | Optical Food Sorting Machines Market |
| Market Size in 2023 | USD 200.36 Million |
| Market Forecast in 2032 | USD 457.2 Million |
| Growth Rate | CAGR of 8.6% |
| Number of Pages | 201 |
| Key Companies Covered | TOMRA, Key Technology, Bühler Group, Satake USA, Cimbria, PELLEGRINI s.r.l., Meyer Optical Sorting, Raytec Vision, NRT, Best Sorting |
| Segments Covered | By Type, By Technology, By Application, By End-User, and By Region |
| Regions Covered | North America, Europe, Asia Pacific (APAC), Latin America, Middle East, and Africa (MEA) |
| Base Year | 2023 |
| Historical Year | 2018 to 2023 |
| Forecast Year | 2024 to 2032 |
| Customization Scope | Avail customized purchase options to meet your exact research needs. Request For Customization |
Optical Food Sorting Machines Market: Dynamics
Key Growth Drivers
The Optical Food Sorting Machines market is experiencing significant growth, primarily driven by the escalating global demand for enhanced food safety and quality, as consumers and regulatory bodies increasingly scrutinize food products for contaminants, defects, and foreign materials. The rising focus on automation in the food processing industry to boost productivity, reduce labor costs (especially with increasing wages for manual workers), and minimize human error is a major catalyst. Furthermore, the growing need to reduce processing and delivery times, coupled with the imperative to maximize yield and reduce waste in food production lines, fuels the adoption of these high-speed and precise sorting technologies. Technological advancements, including the integration of AI, machine learning, and hyperspectral imaging, enable superior detection capabilities and contribute to market expansion.
Restraints
Despite the robust growth drivers, the Optical Food Sorting Machines market faces certain restraints. The high initial capital investment required to purchase and install advanced optical sorting machines is a significant barrier, particularly for small and medium-sized enterprises (SMEs) in the food processing sector. These sophisticated machines often involve specialized sensors, cameras, and software, making them considerably expensive. Furthermore, ongoing operational costs, including energy consumption, regular cleaning, and maintenance requirements, contribute to the total cost of ownership. The complexity of integrating these advanced machines into existing production lines and the need for skilled personnel to operate and maintain them can also pose challenges for wider adoption.
Opportunities
The Optical Food Sorting Machines market presents numerous opportunities for innovation and expansion. The increasing global focus on sustainability and waste reduction in the food industry creates a significant avenue for these machines, as they efficiently minimize food waste by accurately separating defective or foreign materials, thereby contributing to a circular economy. Opportunities also exist in developing more versatile, multi-functional sorters capable of handling a wider range of food products and defects, enhancing their applicability across various processing lines. The rising demand for organic and specialty food products, which require stringent quality control, provides a niche for high-precision optical sorters. Furthermore, the integration of IoT for real-time performance monitoring, predictive maintenance, and remote diagnostics can enhance efficiency and offer new value propositions for end-users.
Challenges
The Optical Food Sorting Machines market faces several critical challenges that demand continuous research and development. Ensuring consistent and highly accurate detection of subtle defects or foreign materials that may resemble the good product in color or texture, especially at high throughputs, remains a technical hurdle. The industry must continuously innovate to reduce the capital and operational costs associated with these machines to make them more accessible to a broader range of food processors, including smaller players. Adapting to the diverse and ever-evolving types of food products and their unique sorting requirements (e.g., fresh produce vs. dried nuts vs. processed goods) necessitates flexible and adaptable machine designs. Moreover, managing customer expectations regarding performance guarantees and providing robust after-sales support and training are crucial for maintaining market trust and growth.
Optical Food Sorting Machines Market: Segmentation Insights
The global optical food sorting machines market is segmented based on Type, Technology, Application, End-User, and Region. All the segments of the optical food sorting machines market have been analyzed based on present & future trends and the market is estimated from 2024 to 2032.
Based on Type, the global optical food sorting machines market is divided into Laser Sorting, Camera Sorting, Combined Sorting.
On the basis of Technology, the global optical food sorting machines market is bifurcated into Near-Infrared (NIR), Hyperspectral Imaging, X-Ray, Others.
In terms of Application, the global optical food sorting machines market is categorized into Fruits & Vegetables, Meat & Poultry, Dairy Products, Grains, Confectionery, Others.
Based on End-User, the global optical food sorting machines market is split into Food Processing Companies, Farms, Packhouses, Others.
Optical Food Sorting Machines Market: Regional Insights
The Optical Food Sorting Machines Market is currently dominated by Europe, which holds the largest market share (over 35%), driven by stringent food safety regulations (e.g., EU Commission Regulations), high automation adoption, and the presence of leading manufacturers like TOMRA Systems and Bühler in Germany, France, and the Netherlands. The region’s focus on reducing food waste and enhancing quality control in processed foods solidifies its leadership. North America follows closely, with robust demand in the U.S. and Canada due to FDA standards and large-scale food processing industries. The Asia-Pacific (APAC) region is the fastest-growing market, propelled by increasing food exports, urbanization, and investments in smart agriculture across China, India, and Japan. Latin America and Africa show emerging potential, particularly in coffee and nut sorting, but face challenges due to high machinery costs. Europe’s dominance is reinforced by technological advancements in AI-powered sorting and sustainability initiatives.
Optical Food Sorting Machines Market: Competitive Landscape
The optical food sorting machines market report offers a thorough analysis of both established and emerging players within the market. It includes a detailed list of key companies, categorized based on the types of products they offer and other relevant factors. The report also highlights the market entry year for each player, providing further context for the research analysis.
The "Global Optical Food Sorting Machines Market" study offers valuable insights, focusing on the global market landscape, with an emphasis on major industry players such as;
- TOMRA
- Key Technology
- Bühler Group
- Satake USA
- Cimbria
- PELLEGRINI s.r.l.
- Meyer Optical Sorting
- Raytec Vision
- NRT
- Best Sorting
The Global Optical Food Sorting Machines Market is Segmented as Follows:
By Type
- Laser Sorting
- Camera Sorting
- Combined Sorting
By Technology
- Near-Infrared (NIR)
- Hyperspectral Imaging
- X-Ray
- Others
By Application
- Fruits & Vegetables
- Meat & Poultry
- Dairy Products
- Grains
- Confectionery
- Others
By End-User
- Food Processing Companies
- Farms
- Packhouses
- Others
By Region
- North America
- The U.S.
- Canada
- Mexico
- Europe
- France
- The UK
- Spain
- Germany
- Italy
- Rest of Europe
- Asia Pacific
- China
- Japan
- India
- Australia
- South Korea
- Rest of Asia Pacific
- The Middle East & Africa
- Saudi Arabia
- UAE
- Egypt
- Kuwait
- South Africa
- Rest of the Middle East & Africa
- Latin America
- Brazil
- Argentina
- Rest of Latin America
Market Evolution
This section evaluates the market position of the product or service by examining its development pathway and competitive dynamics. It provides a detailed overview of the product's growth stages, including the early (historical) phase, the mid-stage, and anticipated future advancements influenced by innovation and emerging technologies.
Porter’s Analysis
Porter’s Five Forces framework offers a strategic lens for assessing competitor behavior and the positioning of key players in the optical food sorting machines industry. This section explores the external factors shaping competitive dynamics and influencing market strategies in the years ahead. The analysis focuses on five critical forces:
- Competitive Rivalry
- Threat of New Entrants
- Threat of Substitutes
- Supplier Bargaining Power
- Buyer Bargaining Power
Value Chain & Market Attractiveness Analysis
The value chain analysis helps businesses optimize operations by mapping the product flow from suppliers to end consumers, identifying opportunities to streamline processes and gain a competitive edge. Segment-wise market attractiveness analysis evaluates key dimensions like product categories, demographics, and regions, assessing growth potential, market size, and profitability. This enables businesses to focus resources on high-potential segments for better ROI and long-term value.
PESTEL Analysis
PESTEL analysis is a powerful tool in market research reports that enhances market understanding by systematically examining the external macro-environmental factors influencing a business or industry. The acronym stands for Political, Economic, Social, Technological, Environmental, and Legal factors. By evaluating these dimensions, PESTEL analysis provides a comprehensive overview of the broader context within which a market operates, helping businesses identify potential opportunities and threats.
- Political factors assess government policies, stability, trade regulations, and political risks that could impact market operations.
- Economic factors examine variables like inflation, exchange rates, economic growth, and consumer spending power to determine market viability.
- Social factors explore cultural trends, demographics, and lifestyle changes that shape consumer behavior and preferences.
- Technological factors evaluate innovation, R&D, and technological advancements affecting product development and operational efficiencies.
- Environmental factors focus on sustainability, climate change impacts, and eco-friendly practices shaping market trends.
- Legal factors address compliance requirements, industry regulations, and intellectual property laws impacting market entry and operations.
Import-Export Analysis & Pricing Analysis
An import-export analysis is vital for market research, revealing global trade dynamics, trends, and opportunities. It examines trade volumes, product categories, and regional competitiveness, offering insights into supply chains and market demand. This section also analyzes past and future pricing trends, helping businesses optimize strategies and enabling consumers to assess product value effectively.
Optical Food Sorting Machines Market: Company Profiles
The report identifies key players in the optical food sorting machines market through a competitive landscape and company profiles, evaluating their offerings, financial performance, strategies, and market positioning. It includes a SWOT analysis of the top 3-5 companies, assessing strengths, weaknesses, opportunities, and threats. The competitive landscape highlights rankings, recent activities (mergers, acquisitions, partnerships, product launches), and regional footprints using the Ace matrix. Customization is available to meet client-specific needs.
Regional & Industry Footprint
This section details the geographic reach, sales networks, and market penetration of companies profiled in the optical food sorting machines report, showcasing their operations and distribution across regions. It analyzes the alignment of companies with specific industry verticals, highlighting the industries they serve and the scope of their products and services within those sectors.
Ace Matrix
This section categorizes companies into four distinct groups—Active, Cutting Edge, Innovator, and Emerging—based on their product and business strategies. The evaluation of product strategy focuses on aspects such as the range and depth of offerings, commitment to innovation, product functionalities, and scalability. Key elements like global reach, sector coverage, strategic acquisitions, and long-term growth plans are considered for business strategy. This analysis provides a detailed view of companies' position within the market and highlights their potential for future growth and development.
Research Methodology
The qualitative and quantitative insights for the optical food sorting machines market are derived through a multi-faceted research approach, combining input from subject matter experts, primary research, and secondary data sources. Primary research includes gathering critical information via face-to-face or telephonic interviews, surveys, questionnaires, and feedback from industry professionals, key opinion leaders (KOLs), and customers. Regular interviews with industry experts are conducted to deepen the analysis and reinforce the existing data, ensuring a robust and well-rounded market understanding.
Secondary research for this report was carried out by the Market Research Store team, drawing on a variety of authoritative sources, such as:
- Official company websites, annual reports, financial statements, investor presentations, and SEC filings
- Internal and external proprietary databases, as well as relevant patent and regulatory databases
- Government publications, national statistical databases, and industry-specific market reports
- Media coverage, including news articles, press releases, and webcasts about market participants
- Paid industry databases for detailed market insights
Market Research Store conducted in-depth consultations with various key opinion leaders in the industry, including senior executives from top companies and regional leaders from end-user organizations. This effort aimed to gather critical insights on factors such as the market share of dominant brands in specific countries and regions, along with pricing strategies for products and services.
To determine total sales data, the research team conducted primary interviews across multiple countries with influential stakeholders, including:
- Distributors
- Marketing, Brand, and Product Managers
- Procurement and Production Managers
- Sales and Regional Sales Managers, Country Managers
- Technical Specialists
- C-Level Executives
These subject matter experts, with their extensive industry experience, helped validate and refine the findings. For secondary research, data were sourced from a wide range of materials, including online resources, company annual reports, industry publications, research papers, association reports, and government websites. These various sources provide a comprehensive and well-rounded perspective on the market.
Frequently Asked Questions
Table Of Content
List of Tables and Figures Figure Product Picture of Optical Food Sorting Machines Table Product Specification of Optical Food Sorting Machines Figure Market Concentration Ratio and Market Maturity Analysis of Optical Food Sorting Machines Figure Global Optical Food Sorting Machines Value ($) and Growth Rate from 2014-2024 Table Different Types of Optical Food Sorting Machines Figure Global Optical Food Sorting Machines Value ($) Segment by Type from 2014-2019 Figure x-ray Sorting Systems Picture Figure Color Sorting Systems Picture Figure NIR Sorting Systems Picture Table Different Applications of Optical Food Sorting Machines Figure Global Optical Food Sorting Machines Value ($) Segment by Applications from 2014-2019 Figure Agricultural Seeds Picture Figure Fruit and Vegetable Picture Figure Coffee and Tea Picture Figure Nut Picture Figure Other Picture Table Research Regions of Optical Food Sorting Machines Figure North America Optical Food Sorting Machines Production Value ($) and Growth Rate (2014-2019) Figure Europe Optical Food Sorting Machines Production Value ($) and Growth Rate (2014-2019) Table China Optical Food Sorting Machines Production Value ($) and Growth Rate (2014-2019) Table Japan Optical Food Sorting Machines Production Value ($) and Growth Rate (2014-2019) Table Middle East & Africa Optical Food Sorting Machines Production Value ($) and Growth Rate (2014-2019) Table India Optical Food Sorting Machines Production Value ($) and Growth Rate (2014-2019) Table South America Optical Food Sorting Machines Production Value ($) and Growth Rate (2014-2019) Table Emerging Countries of Optical Food Sorting Machines Table Growing Market of Optical Food Sorting Machines Figure Industry Chain Analysis of Optical Food Sorting Machines Table Upstream Raw Material Suppliers of Optical Food Sorting Machines with Contact Information Table Major Players Manufacturing Base and Market Share ($) of Optical Food Sorting Machines in 2018 Table Major Players Optical Food Sorting Machines Product Types in 2018 Figure Production Process of Optical Food Sorting Machines Figure Manufacturing Cost Structure of Optical Food Sorting Machines Figure Channel Status of Optical Food Sorting Machines Table Major Distributors of Optical Food Sorting Machines with Contact Information Table Major Downstream Buyers of Optical Food Sorting Machines with Contact Information Table Global Optical Food Sorting Machines Value ($) by Type (2014-2019) Table Global Optical Food Sorting Machines Value ($) Share by Type (2014-2019) Figure Global Optical Food Sorting Machines Value ($) Share by Type (2014-2019) Table Global Optical Food Sorting Machines Production by Type (2014-2019) Table Global Optical Food Sorting Machines Production Share by Type (2014-2019) Figure Global Optical Food Sorting Machines Production Share by Type (2014-2019) Figure Global Optical Food Sorting Machines Value ($) and Growth Rate of x-ray Sorting Systems Figure Global Optical Food Sorting Machines Value ($) and Growth Rate of Color Sorting Systems Figure Global Optical Food Sorting Machines Value ($) and Growth Rate of NIR Sorting Systems Figure Global Optical Food Sorting Machines Price by Type (2014-2019) Table Global Optical Food Sorting Machines Consumption by Application (2014-2019) Table Global Optical Food Sorting Machines Consumption Market Share by Application (2014-2019) Figure Global Optical Food Sorting Machines Consumption Market Share by Application (2014-2019) Table Downstream Buyers Introduction by Application Figure Global Optical Food Sorting Machines Consumption and Growth Rate of Agricultural Seeds (2014-2019) Figure Global Optical Food Sorting Machines Consumption and Growth Rate of Fruit and Vegetable (2014-2019) Figure Global Optical Food Sorting Machines Consumption and Growth Rate of Coffee and Tea (2014-2019) Figure Global Optical Food Sorting Machines Consumption and Growth Rate of Nut (2014-2019) Figure Global Optical Food Sorting Machines Consumption and Growth Rate of Other (2014-2019) Table Global Optical Food Sorting Machines Value ($) by Region (2014-2019) Table Global Optical Food Sorting Machines Value ($) Market Share by Region (2014-2019) Figure Global Optical Food Sorting Machines Value ($) Market Share by Region (2014-2019) Table Global Optical Food Sorting Machines Production by Region (2014-2019) Table Global Optical Food Sorting Machines Production Market Share by Region (2014-2019) Figure Global Optical Food Sorting Machines Production Market Share by Region (2014-2019) Table Global Optical Food Sorting Machines Production, Value ($), Price and Gross Margin (2014-2019) Table North America Optical Food Sorting Machines Production, Value ($), Price and Gross Margin (2014-2019) Table Europe Optical Food Sorting Machines Production, Value ($), Price and Gross Margin (2014-2019) Table China Optical Food Sorting Machines Production, Value ($), Price and Gross Margin (2014-2019) Table Japan Optical Food Sorting Machines Production, Value ($), Price and Gross Margin (2014-2019) Table Middle East & Africa Optical Food Sorting Machines Production, Value ($), Price and Gross Margin (2014-2019) Table India Optical Food Sorting Machines Production, Value ($), Price and Gross Margin (2014-2019) Table South America Optical Food Sorting Machines Production, Value ($), Price and Gross Margin (2014-2019) Table Global Optical Food Sorting Machines Consumption by Regions (2014-2019) Figure Global Optical Food Sorting Machines Consumption Share by Regions (2014-2019) Table North America Optical Food Sorting Machines Production, Consumption, Export, Import (2014-2019) Table Europe Optical Food Sorting Machines Production, Consumption, Export, Import (2014-2019) Table China Optical Food Sorting Machines Production, Consumption, Export, Import (2014-2019) Table Japan Optical Food Sorting Machines Production, Consumption, Export, Import (2014-2019) Table Middle East & Africa Optical Food Sorting Machines Production, Consumption, Export, Import (2014-2019) Table India Optical Food Sorting Machines Production, Consumption, Export, Import (2014-2019) Table South America Optical Food Sorting Machines Production, Consumption, Export, Import (2014-2019) Figure North America Optical Food Sorting Machines Production and Growth Rate Analysis Figure North America Optical Food Sorting Machines Consumption and Growth Rate Analysis Figure North America Optical Food Sorting Machines SWOT Analysis Figure Europe Optical Food Sorting Machines Production and Growth Rate Analysis Figure Europe Optical Food Sorting Machines Consumption and Growth Rate Analysis Figure Europe Optical Food Sorting Machines SWOT Analysis Figure China Optical Food Sorting Machines Production and Growth Rate Analysis Figure China Optical Food Sorting Machines Consumption and Growth Rate Analysis Figure China Optical Food Sorting Machines SWOT Analysis Figure Japan Optical Food Sorting Machines Production and Growth Rate Analysis Figure Japan Optical Food Sorting Machines Consumption and Growth Rate Analysis Figure Japan Optical Food Sorting Machines SWOT Analysis Figure Middle East & Africa Optical Food Sorting Machines Production and Growth Rate Analysis Figure Middle East & Africa Optical Food Sorting Machines Consumption and Growth Rate Analysis Figure Middle East & Africa Optical Food Sorting Machines SWOT Analysis Figure India Optical Food Sorting Machines Production and Growth Rate Analysis Figure India Optical Food Sorting Machines Consumption and Growth Rate Analysis Figure India Optical Food Sorting Machines SWOT Analysis Figure South America Optical Food Sorting Machines Production and Growth Rate Analysis Figure South America Optical Food Sorting Machines Consumption and Growth Rate Analysis Figure South America Optical Food Sorting Machines SWOT Analysis Figure Top 3 Market Share of Optical Food Sorting Machines Companies Figure Top 6 Market Share of Optical Food Sorting Machines Companies Table Mergers, Acquisitions and Expansion Analysis Table Company Profiles Table Product Introduction Table CP Manufacturing Production, Value ($), Price, Gross Margin 2014-2019 Figure CP Manufacturing Production and Growth Rate Figure CP Manufacturing Value ($) Market Share 2014-2019 Figure CP Manufacturing Market Share of Optical Food Sorting Machines Segmented by Region in 2018 Table Company Profiles Table Product Introduction Table Satake Production, Value ($), Price, Gross Margin 2014-2019 Figure Satake Production and Growth Rate Figure Satake Value ($) Market Share 2014-2019 Figure Satake Market Share of Optical Food Sorting Machines Segmented by Region in 2018 Table Company Profiles Table Product Introduction Table Tomra Production, Value ($), Price, Gross Margin 2014-2019 Figure Tomra Production and Growth Rate Figure Tomra Value ($) Market Share 2014-2019 Figure Tomra Market Share of Optical Food Sorting Machines Segmented by Region in 2018 Table Company Profiles Table Product Introduction Table Sesotec Production, Value ($), Price, Gross Margin 2014-2019 Figure Sesotec Production and Growth Rate Figure Sesotec Value ($) Market Share 2014-2019 Figure Sesotec Market Share of Optical Food Sorting Machines Segmented by Region in 2018 Table Company Profiles Table Product Introduction Table National Recovery Technologies Production, Value ($), Price, Gross Margin 2014-2019 Figure National Recovery Technologies Production and Growth Rate Figure National Recovery Technologies Value ($) Market Share 2014-2019 Figure National Recovery Technologies Market Share of Optical Food Sorting Machines Segmented by Region in 2018 Table Company Profiles Table Product Introduction Table Cimbria Production, Value ($), Price, Gross Margin 2014-2019 Figure Cimbria Production and Growth Rate Figure Cimbria Value ($) Market Share 2014-2019 Figure Cimbria Market Share of Optical Food Sorting Machines Segmented by Region in 2018 Table Company Profiles Table Product Introduction Table Key Technology Production, Value ($), Price, Gross Margin 2014-2019 Figure Key Technology Production and Growth Rate Figure Key Technology Value ($) Market Share 2014-2019 Figure Key Technology Market Share of Optical Food Sorting Machines Segmented by Region in 2018 Table Company Profiles Table Product Introduction Table Meyer Optoelectronic Technology Production, Value ($), Price, Gross Margin 2014-2019 Figure Meyer Optoelectronic Technology Production and Growth Rate Figure Meyer Optoelectronic Technology Value ($) Market Share 2014-2019 Figure Meyer Optoelectronic Technology Market Share of Optical Food Sorting Machines Segmented by Region in 2018 Table Company Profiles Table Product Introduction Table Pellenc ST Production, Value ($), Price, Gross Margin 2014-2019 Figure Pellenc ST Production and Growth Rate Figure Pellenc ST Value ($) Market Share 2014-2019 Figure Pellenc ST Market Share of Optical Food Sorting Machines Segmented by Region in 2018 Table Company Profiles Table Product Introduction Table Steinert Production, Value ($), Price, Gross Margin 2014-2019 Figure Steinert Production and Growth Rate Figure Steinert Value ($) Market Share 2014-2019 Figure Steinert Market Share of Optical Food Sorting Machines Segmented by Region in 2018 Table Company Profiles Table Product Introduction Table Allgaier Werke Production, Value ($), Price, Gross Margin 2014-2019 Figure Allgaier Werke Production and Growth Rate Figure Allgaier Werke Value ($) Market Share 2014-2019 Figure Allgaier Werke Market Share of Optical Food Sorting Machines Segmented by Region in 2018 Table Company Profiles Table Product Introduction Table Binder Production, Value ($), Price, Gross Margin 2014-2019 Figure Binder Production and Growth Rate Figure Binder Value ($) Market Share 2014-2019 Figure Binder Market Share of Optical Food Sorting Machines Segmented by Region in 2018 Table Company Profiles Table Product Introduction Table Greefa Production, Value ($), Price, Gross Margin 2014-2019 Figure Greefa Production and Growth Rate Figure Greefa Value ($) Market Share 2014-2019 Figure Greefa Market Share of Optical Food Sorting Machines Segmented by Region in 2018 Table Company Profiles Table Product Introduction Table Buhler Production, Value ($), Price, Gross Margin 2014-2019 Figure Buhler Production and Growth Rate Figure Buhler Value ($) Market Share 2014-2019 Figure Buhler Market Share of Optical Food Sorting Machines Segmented by Region in 2018 Table Company Profiles Table Product Introduction Table Newtec Production, Value ($), Price, Gross Margin 2014-2019 Figure Newtec Production and Growth Rate Figure Newtec Value ($) Market Share 2014-2019 Figure Newtec Market Share of Optical Food Sorting Machines Segmented by Region in 2018 Table Company Profiles Table Product Introduction Table Raytec Vision Production, Value ($), Price, Gross Margin 2014-2019 Figure Raytec Vision Production and Growth Rate Figure Raytec Vision Value ($) Market Share 2014-2019 Figure Raytec Vision Market Share of Optical Food Sorting Machines Segmented by Region in 2018 Table Global Optical Food Sorting Machines Market Value ($) Forecast, by Type Table Global Optical Food Sorting Machines Market Volume Forecast, by Type Figure Global Optical Food Sorting Machines Market Value ($) and Growth Rate Forecast of x-ray Sorting Systems (2019-2024) Figure Global Optical Food Sorting Machines Market Volume and Growth Rate Forecast of x-ray Sorting Systems (2019-2024) Figure Global Optical Food Sorting Machines Market Value ($) and Growth Rate Forecast of Color Sorting Systems (2019-2024) Figure Global Optical Food Sorting Machines Market Volume and Growth Rate Forecast of Color Sorting Systems (2019-2024) Figure Global Optical Food Sorting Machines Market Value ($) and Growth Rate Forecast of NIR Sorting Systems (2019-2024) Figure Global Optical Food Sorting Machines Market Volume and Growth Rate Forecast of NIR Sorting Systems (2019-2024) Table Global Market Value ($) Forecast by Application (2019-2024) Table Global Market Volume Forecast by Application (2019-2024) Figure Global Optical Food Sorting Machines Consumption and Growth Rate of Agricultural Seeds (2014-2019) Figure Global Optical Food Sorting Machines Consumption and Growth Rate of Fruit and Vegetable (2014-2019) Figure Global Optical Food Sorting Machines Consumption and Growth Rate of Coffee and Tea (2014-2019) Figure Global Optical Food Sorting Machines Consumption and Growth Rate of Nut (2014-2019) Figure Global Optical Food Sorting Machines Consumption and Growth Rate of Other (2014-2019) Figure Market Value ($) and Growth Rate Forecast of Other (2019-2024) Figure Market Volume and Growth Rate Forecast of Other (2019-2024) Figure North America Market Value ($) and Growth Rate Forecast (2019-2024) Table North America Consumption and Growth Rate Forecast (2019-2024) Figure Europe Market Value ($) and Growth Rate Forecast (2019-2024) Table Europe Consumption and Growth Rate Forecast (2019-2024) Figure China Market Value ($) and Growth Rate Forecast (2019-2024) Table China Consumption and Growth Rate Forecast (2019-2024) Figure Japan Market Value ($) and Growth Rate Forecast (2019-2024) Table Japan Consumption and Growth Rate Forecast (2019-2024) Figure Middle East & Africa Market Value ($) and Growth Rate Forecast (2019-2024) Table Middle East & Africa Consumption and Growth Rate Forecast (2019-2024) Figure India Market Value ($) and Growth Rate Forecast (2019-2024) Table India Consumption and Growth Rate Forecast (2019-2024) Figure South America Market Value ($) and Growth Rate Forecast (2019-2024) Table South America Consumption and Growth Rate Forecast (2019-2024) Figure Industry Resource/Technology/Labor Importance Analysis Table New Entrants SWOT Analysis Table New Project Analysis of Investment Recovery
Inquiry For Buying
Optical Food Sorting Machines
Request Sample
Optical Food Sorting Machines