Out-of-home Food and Beverage Market Size, Share, and Trends Analysis Report
CAGR :

| Market Size 2023 (Base Year) | USD 1609.03 Billion |
| Market Size 2032 (Forecast Year) | USD 2636.45 Billion |
| CAGR | 5.6% |
| Forecast Period | 2024 - 2032 |
| Historical Period | 2018 - 2023 |
Out-of-home Food and Beverage Market Insights
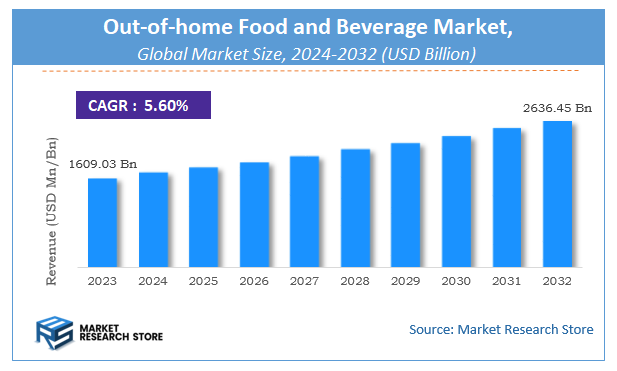
A latest report by Market Research Store estimates that the Global Out-of-home Food and Beverage Market was valued at USD 1609.03 Billion in 2023 and is expected to reach USD 2636.45 Billion by 2032, with a CAGR of 5.6% during the forecast period 2024-2032. The report Out-of-home Food and Beverage Market overview, growth factors, restraints, opportunities, segmentation, key developments, competitive landscape, consumer insights, and market growth forecast in terms of value or volume. These structured details offer an all-inclusive market overview, providing valuable insights for investment decisions, business decisions, strategic planning, and competitive analysis.
To Get more Insights, Request a Free Sample
Out-of-home Food and Beverage Market: Overview
The growth of the out-of-home food and beverage market is fueled by rising global demand across various industries and applications. The report highlights lucrative opportunities, analyzing cost structures, key segments, emerging trends, regional dynamics, and advancements by leading players to provide comprehensive market insights. The out-of-home food and beverage market report offers a detailed industry analysis from 2024 to 2032, combining quantitative and qualitative insights. It examines key factors such as pricing, market penetration, GDP impact, industry dynamics, major players, consumer behavior, and socio-economic conditions. Structured into multiple sections, the report provides a comprehensive perspective on the market from all angles.
Key sections of the out-of-home food and beverage market report include market segments, outlook, competitive landscape, and company profiles. Market Segments offer in-depth details based on Type, Application, and other relevant classifications to support strategic marketing initiatives. Market Outlook thoroughly analyzes market trends, growth drivers, restraints, opportunities, challenges, Porter’s Five Forces framework, macroeconomic factors, value chain analysis, and pricing trends shaping the market now and in the future. The Competitive Landscape and Company Profiles section highlights major players, their strategies, and market positioning to guide investment and business decisions. The report also identifies innovation trends, new business opportunities, and investment prospects for the forecast period.
Key Highlights:
- As per the analysis shared by our research analyst, the global out-of-home food and beverage market is estimated to grow annually at a CAGR of around 5.6% over the forecast period (2024-2032).
- In terms of revenue, the global out-of-home food and beverage market size was valued at around USD 1609.03 Billion in 2023 and is projected to reach USD 2636.45 Billion by 2032.
- The market is projected to grow at a significant rate due to rising consumer preference for convenience dining, urbanization, and food delivery service expansion.
- Based on the Type, the Food segment is growing at a high rate and will continue to dominate the global market as per industry projections.
- On the basis of Application, the Retail channel segment is anticipated to command the largest market share.
- Based on region, North America is projected to dominate the global market during the forecast period.
Out-of-home Food and Beverage Market: Report Scope
This report thoroughly analyzes the out-of-home food and beverage market, exploring its historical trends, current state, and future projections. The market estimates presented result from a robust research methodology, incorporating primary research, secondary sources, and expert opinions. These estimates are influenced by the prevailing market dynamics as well as key economic, social, and political factors. Furthermore, the report considers the impact of regulations, government expenditures, and advancements in research and development on the market. Both positive and negative shifts are evaluated to ensure a comprehensive and accurate market outlook.
| Report Attributes | Report Details |
|---|---|
| Report Name | Out-of-home Food and Beverage Market |
| Market Size in 2023 | USD 1609.03 Billion |
| Market Forecast in 2032 | USD 2636.45 Billion |
| Growth Rate | CAGR of 5.6% |
| Number of Pages | 191 |
| Key Companies Covered | Imperial Tobacco, Philip Morris International Inc., Tyson Foods Inc, Anheuser Busch InBev, Kraft Heinz Compan, Dunkin’Brand Group, Mondelez International Inc, Constellation Brands, Nestle SA, Mars Inc., Anheuser Busch InBev, JBS S.A., Diageo, Coca cola, |
| Segments Covered | By Type, By Application, and By Region |
| Regions Covered | North America, Europe, Asia Pacific (APAC), Latin America, Middle East, and Africa (MEA) |
| Base Year | 2023 |
| Historical Year | 2018 to 2023 |
| Forecast Year | 2024 to 2032 |
| Customization Scope | Avail customized purchase options to meet your exact research needs. Request For Customization |
Out-of-home Food and Beverage Market: Dynamics
Key Growth Drivers
The Out-of-Home (OOH) Food and Beverage market in Pune, Maharashtra, India, is experiencing robust growth driven by the increasing disposable incomes and changing lifestyles of a young and urbanized population that frequently dines out or purchases food and drinks on the go. The proliferation of food service establishments, including restaurants, cafes, quick-service restaurants (QSRs), food trucks, and street food vendors, provides consumers with a wide array of choices and accessibility. Furthermore, the growing influence of social media and food culture, encouraging exploration and sharing of dining experiences, fuels demand. The convenience offered by OOH options, particularly for busy professionals and students, makes it an attractive alternative to home-cooked meals. The expansion of organized retail and entertainment spaces, such as malls and multiplexes, which house numerous F&B outlets, also contributes significantly.
Restraints
Despite the strong growth drivers, the OOH Food and Beverage market in Pune and India faces certain restraints. Economic downturns and inflationary pressures can lead to consumers reducing discretionary spending on dining out. Health concerns and a growing awareness of food safety and hygiene, particularly regarding street food vendors and less regulated establishments, can deter some consumers. Furthermore, the high competition within the OOH sector can make it challenging for individual businesses to maintain profitability. Traffic congestion and parking issues in urban areas like Pune can sometimes discourage consumers from traveling to specific F&B destinations. The increasing popularity of food delivery platforms offers a convenient alternative to physically going out, potentially impacting dine-in traffic.
Opportunities
The OOH Food and Beverage market in Pune and India presents numerous opportunities for innovation and growth. The increasing focus on healthier and more nutritious OOH options, catering to health-conscious consumers, represents a significant market segment. The growing demand for regional and ethnic cuisines, as well as fusion and innovative food concepts, allows for differentiation and unique offerings. Furthermore, the integration of technology, such as online ordering, digital menus, and loyalty programs, can enhance customer experience and drive sales. The expansion of organized street food initiatives with better hygiene standards can tap into a large consumer base. The increasing popularity of experiential dining, combining food with entertainment or unique ambiance, can attract customers seeking more than just a meal.
Challenges
The OOH Food and Beverage market in Pune and India faces challenges related to maintaining consistent quality and hygiene standards across a diverse range of establishments, especially in the unorganized sector. Managing rising operational costs, including rent, ingredients, and labor, while remaining price-competitive is a constant struggle. Adapting to evolving consumer preferences and dietary trends requires continuous menu innovation and responsiveness. Furthermore, navigating the complex regulatory landscape related to food safety, licensing, and taxation can be demanding. Attracting and retaining skilled staff in the hospitality industry is an ongoing challenge. Finally, competing with the convenience and affordability of home-cooked meals and the growing popularity of food delivery services requires OOH establishments to offer unique value propositions in terms of experience, quality, and social interaction.
Out-of-home Food and Beverage Market: Segmentation Insights
The global out-of-home food and beverage market is segmented based on Type, Application, and Region. All the segments of the out-of-home food and beverage market have been analyzed based on present & future trends and the market is estimated from 2024 to 2032.
Based on Type, the global out-of-home food and beverage market is divided into Food, Beverage.
On the basis of Application, the global out-of-home food and beverage market is bifurcated into Retail channel, OOH Channel.
Out-of-home Food and Beverage Market: Regional Insights
The out-of-home (OOH) food and beverage market is dominated by the Asia-Pacific (APAC) region, which holds the largest market share due to rapid urbanization, rising disposable incomes, and a growing middle-class population. According to recent industry reports, APAC accounted for over 40% of the global OOH food and beverage market revenue in 2023, driven by high demand in countries like China, India, and Japan. China remains the largest contributor, fueled by a booming food delivery sector and increasing dining-out culture.
North America and Europe follow, with strong growth in convenience dining and fast-casual restaurants. However, APAC's dominance is expected to strengthen further, with a projected CAGR of 8-10% through 2030, outpacing other regions due to expanding quick-service restaurant (QSR) chains and digital food service platforms.
Out-of-home Food and Beverage Market: Competitive Landscape
The out-of-home food and beverage market report offers a thorough analysis of both established and emerging players within the market. It includes a detailed list of key companies, categorized based on the types of products they offer and other relevant factors. The report also highlights the market entry year for each player, providing further context for the research analysis.
The "Global Out-of-home Food and Beverage Market" study offers valuable insights, focusing on the global market landscape, with an emphasis on major industry players such as;
- Imperial Tobacco
- Philip Morris International Inc.
- Tyson Foods Inc
- Anheuser Busch InBev
- Kraft Heinz Compan
- Dunkin’Brand Group
- Mondelez International Inc
- Constellation Brands
- Nestle SA
- Mars Inc.
- Anheuser Busch InBev
- JBS S.A.
- Diageo
- Coca cola
- PepsiCo
- General Mills
The Global Out-of-home Food and Beverage Market is Segmented as Follows:
By Type
- Food
- Beverage
By Application
- Retail channel
- OOH Channel
By Region
- North America
- The U.S.
- Canada
- Mexico
- Europe
- France
- The UK
- Spain
- Germany
- Italy
- Rest of Europe
- Asia Pacific
- China
- Japan
- India
- Australia
- South Korea
- Rest of Asia Pacific
- The Middle East & Africa
- Saudi Arabia
- UAE
- Egypt
- Kuwait
- South Africa
- Rest of the Middle East & Africa
- Latin America
- Brazil
- Argentina
- Rest of Latin America
Market Evolution
This section evaluates the market position of the product or service by examining its development pathway and competitive dynamics. It provides a detailed overview of the product's growth stages, including the early (historical) phase, the mid-stage, and anticipated future advancements influenced by innovation and emerging technologies.
Porter’s Analysis
Porter’s Five Forces framework offers a strategic lens for assessing competitor behavior and the positioning of key players in the out-of-home food and beverage industry. This section explores the external factors shaping competitive dynamics and influencing market strategies in the years ahead. The analysis focuses on five critical forces:
- Competitive Rivalry
- Threat of New Entrants
- Threat of Substitutes
- Supplier Bargaining Power
- Buyer Bargaining Power
Value Chain & Market Attractiveness Analysis
The value chain analysis helps businesses optimize operations by mapping the product flow from suppliers to end consumers, identifying opportunities to streamline processes and gain a competitive edge. Segment-wise market attractiveness analysis evaluates key dimensions like product categories, demographics, and regions, assessing growth potential, market size, and profitability. This enables businesses to focus resources on high-potential segments for better ROI and long-term value.
PESTEL Analysis
PESTEL analysis is a powerful tool in market research reports that enhances market understanding by systematically examining the external macro-environmental factors influencing a business or industry. The acronym stands for Political, Economic, Social, Technological, Environmental, and Legal factors. By evaluating these dimensions, PESTEL analysis provides a comprehensive overview of the broader context within which a market operates, helping businesses identify potential opportunities and threats.
- Political factors assess government policies, stability, trade regulations, and political risks that could impact market operations.
- Economic factors examine variables like inflation, exchange rates, economic growth, and consumer spending power to determine market viability.
- Social factors explore cultural trends, demographics, and lifestyle changes that shape consumer behavior and preferences.
- Technological factors evaluate innovation, R&D, and technological advancements affecting product development and operational efficiencies.
- Environmental factors focus on sustainability, climate change impacts, and eco-friendly practices shaping market trends.
- Legal factors address compliance requirements, industry regulations, and intellectual property laws impacting market entry and operations.
Import-Export Analysis & Pricing Analysis
An import-export analysis is vital for market research, revealing global trade dynamics, trends, and opportunities. It examines trade volumes, product categories, and regional competitiveness, offering insights into supply chains and market demand. This section also analyzes past and future pricing trends, helping businesses optimize strategies and enabling consumers to assess product value effectively.
Out-of-home Food and Beverage Market: Company Profiles
The report identifies key players in the out-of-home food and beverage market through competitive landscape and company profiles, evaluating their offerings, financial performance, strategies, and market positioning. It includes a SWOT analysis of the top 3-5 companies, assessing strengths, weaknesses, opportunities, and threats. The competitive landscape highlights rankings, recent activities (mergers, acquisitions, partnerships, product launches), and regional footprints using the Ace matrix. Customization is available to meet client-specific needs.
Regional & Industry Footprint
This section details the geographic reach, sales networks, and market penetration of companies profiled in the out-of-home food and beverage report, showcasing their operations and distribution across regions. It analyzes the alignment of companies with specific industry verticals, highlighting the industries they serve and the scope of their products and services within those sectors.
Ace Matrix
This section categorizes companies into four distinct groups—Active, Cutting Edge, Innovator, and Emerging—based on their product and business strategies. The evaluation of product strategy focuses on aspects such as the range and depth of offerings, commitment to innovation, product functionalities, and scalability. Key elements like global reach, sector coverage, strategic acquisitions, and long-term growth plans are considered for business strategy. This analysis provides a detailed view of companies' position within the market and highlights their potential for future growth and development.
Research Methodology
The qualitative and quantitative insights for the out-of-home food and beverage market are derived through a multi-faceted research approach, combining input from subject matter experts, primary research, and secondary data sources. Primary research includes gathering critical information via face-to-face or telephonic interviews, surveys, questionnaires, and feedback from industry professionals, key opinion leaders (KOLs), and customers. Regular interviews with industry experts are conducted to deepen the analysis and reinforce the existing data, ensuring a robust and well-rounded market understanding.
Secondary research for this report was carried out by the Market Research Store team, drawing on a variety of authoritative sources, such as:
- Official company websites, annual reports, financial statements, investor presentations, and SEC filings
- Internal and external proprietary databases, as well as relevant patent and regulatory databases
- Government publications, national statistical databases, and industry-specific market reports
- Media coverage, including news articles, press releases, and webcasts about market participants
- Paid industry databases for detailed market insights
Market Research Store conducted in-depth consultations with various key opinion leaders in the industry, including senior executives from top companies and regional leaders from end-user organizations. This effort aimed to gather critical insights on factors such as the market share of dominant brands in specific countries and regions, along with pricing strategies for products and services.
To determine total sales data, the research team conducted primary interviews across multiple countries with influential stakeholders, including:
- Distributors
- Marketing, Brand, and Product Managers
- Procurement and Production Managers
- Sales and Regional Sales Managers, Country Managers
- Technical Specialists
- C-Level Executives
These subject matter experts, with their extensive industry experience, helped validate and refine the findings. For secondary research, data was sourced from a wide range of materials, including online resources, company annual reports, industry publications, research papers, association reports, and government websites. These various sources provide a comprehensive and well-rounded perspective on the market.
Frequently Asked Questions
Table Of Content
List of Tables and Figures Figure Product Picture of Out-of-home Food and Beverage Table Product Specification of Out-of-home Food and Beverage Figure Market Concentration Ratio and Market Maturity Analysis of Out-of-home Food and Beverage Figure Global Out-of-home Food and Beverage Value ($) and Growth Rate from 2014-2024 Table Different Types of Out-of-home Food and Beverage Figure Global Out-of-home Food and Beverage Value ($) Segment by Type from 2014-2019 Figure Food Picture Figure Beverage Picture Table Different Applications of Out-of-home Food and Beverage Figure Global Out-of-home Food and Beverage Value ($) Segment by Applications from 2014-2019 Figure Retail channel Picture Figure OOH Channel Picture Table Research Regions of Out-of-home Food and Beverage Figure North America Out-of-home Food and Beverage Production Value ($) and Growth Rate (2014-2019) Figure Europe Out-of-home Food and Beverage Production Value ($) and Growth Rate (2014-2019) Table China Out-of-home Food and Beverage Production Value ($) and Growth Rate (2014-2019) Table Japan Out-of-home Food and Beverage Production Value ($) and Growth Rate (2014-2019) Table Middle East & Africa Out-of-home Food and Beverage Production Value ($) and Growth Rate (2014-2019) Table India Out-of-home Food and Beverage Production Value ($) and Growth Rate (2014-2019) Table South America Out-of-home Food and Beverage Production Value ($) and Growth Rate (2014-2019) Table Emerging Countries of Out-of-home Food and Beverage Table Growing Market of Out-of-home Food and Beverage Figure Industry Chain Analysis of Out-of-home Food and Beverage Table Upstream Raw Material Suppliers of Out-of-home Food and Beverage with Contact Information Table Major Players Manufacturing Base and Market Share ($) of Out-of-home Food and Beverage in 2018 Table Major Players Out-of-home Food and Beverage Product Types in 2018 Figure Production Process of Out-of-home Food and Beverage Figure Manufacturing Cost Structure of Out-of-home Food and Beverage Figure Channel Status of Out-of-home Food and Beverage Table Major Distributors of Out-of-home Food and Beverage with Contact Information Table Major Downstream Buyers of Out-of-home Food and Beverage with Contact Information Table Global Out-of-home Food and Beverage Value ($) by Type (2014-2019) Table Global Out-of-home Food and Beverage Value ($) Share by Type (2014-2019) Figure Global Out-of-home Food and Beverage Value ($) Share by Type (2014-2019) Table Global Out-of-home Food and Beverage Production by Type (2014-2019) Table Global Out-of-home Food and Beverage Production Share by Type (2014-2019) Figure Global Out-of-home Food and Beverage Production Share by Type (2014-2019) Figure Global Out-of-home Food and Beverage Value ($) and Growth Rate of Food Figure Global Out-of-home Food and Beverage Value ($) and Growth Rate of Beverage Figure Global Out-of-home Food and Beverage Price by Type (2014-2019) Table Global Out-of-home Food and Beverage Consumption by Application (2014-2019) Table Global Out-of-home Food and Beverage Consumption Market Share by Application (2014-2019) Figure Global Out-of-home Food and Beverage Consumption Market Share by Application (2014-2019) Table Downstream Buyers Introduction by Application Figure Global Out-of-home Food and Beverage Consumption and Growth Rate of Retail channel (2014-2019) Figure Global Out-of-home Food and Beverage Consumption and Growth Rate of OOH Channel (2014-2019) Table Global Out-of-home Food and Beverage Value ($) by Region (2014-2019) Table Global Out-of-home Food and Beverage Value ($) Market Share by Region (2014-2019) Figure Global Out-of-home Food and Beverage Value ($) Market Share by Region (2014-2019) Table Global Out-of-home Food and Beverage Production by Region (2014-2019) Table Global Out-of-home Food and Beverage Production Market Share by Region (2014-2019) Figure Global Out-of-home Food and Beverage Production Market Share by Region (2014-2019) Table Global Out-of-home Food and Beverage Production, Value ($), Price and Gross Margin (2014-2019) Table North America Out-of-home Food and Beverage Production, Value ($), Price and Gross Margin (2014-2019) Table Europe Out-of-home Food and Beverage Production, Value ($), Price and Gross Margin (2014-2019) Table China Out-of-home Food and Beverage Production, Value ($), Price and Gross Margin (2014-2019) Table Japan Out-of-home Food and Beverage Production, Value ($), Price and Gross Margin (2014-2019) Table Middle East & Africa Out-of-home Food and Beverage Production, Value ($), Price and Gross Margin (2014-2019) Table India Out-of-home Food and Beverage Production, Value ($), Price and Gross Margin (2014-2019) Table South America Out-of-home Food and Beverage Production, Value ($), Price and Gross Margin (2014-2019) Table Global Out-of-home Food and Beverage Consumption by Regions (2014-2019) Figure Global Out-of-home Food and Beverage Consumption Share by Regions (2014-2019) Table North America Out-of-home Food and Beverage Production, Consumption, Export, Import (2014-2019) Table Europe Out-of-home Food and Beverage Production, Consumption, Export, Import (2014-2019) Table China Out-of-home Food and Beverage Production, Consumption, Export, Import (2014-2019) Table Japan Out-of-home Food and Beverage Production, Consumption, Export, Import (2014-2019) Table Middle East & Africa Out-of-home Food and Beverage Production, Consumption, Export, Import (2014-2019) Table India Out-of-home Food and Beverage Production, Consumption, Export, Import (2014-2019) Table South America Out-of-home Food and Beverage Production, Consumption, Export, Import (2014-2019) Figure North America Out-of-home Food and Beverage Production and Growth Rate Analysis Figure North America Out-of-home Food and Beverage Consumption and Growth Rate Analysis Figure North America Out-of-home Food and Beverage SWOT Analysis Figure Europe Out-of-home Food and Beverage Production and Growth Rate Analysis Figure Europe Out-of-home Food and Beverage Consumption and Growth Rate Analysis Figure Europe Out-of-home Food and Beverage SWOT Analysis Figure China Out-of-home Food and Beverage Production and Growth Rate Analysis Figure China Out-of-home Food and Beverage Consumption and Growth Rate Analysis Figure China Out-of-home Food and Beverage SWOT Analysis Figure Japan Out-of-home Food and Beverage Production and Growth Rate Analysis Figure Japan Out-of-home Food and Beverage Consumption and Growth Rate Analysis Figure Japan Out-of-home Food and Beverage SWOT Analysis Figure Middle East & Africa Out-of-home Food and Beverage Production and Growth Rate Analysis Figure Middle East & Africa Out-of-home Food and Beverage Consumption and Growth Rate Analysis Figure Middle East & Africa Out-of-home Food and Beverage SWOT Analysis Figure India Out-of-home Food and Beverage Production and Growth Rate Analysis Figure India Out-of-home Food and Beverage Consumption and Growth Rate Analysis Figure India Out-of-home Food and Beverage SWOT Analysis Figure South America Out-of-home Food and Beverage Production and Growth Rate Analysis Figure South America Out-of-home Food and Beverage Consumption and Growth Rate Analysis Figure South America Out-of-home Food and Beverage SWOT Analysis Figure Top 3 Market Share of Out-of-home Food and Beverage Companies Figure Top 6 Market Share of Out-of-home Food and Beverage Companies Table Mergers, Acquisitions and Expansion Analysis Table Company Profiles Table Product Introduction Table Imperial Tobacco Production, Value ($), Price, Gross Margin 2014-2019 Figure Imperial Tobacco Production and Growth Rate Figure Imperial Tobacco Value ($) Market Share 2014-2019 Figure Imperial Tobacco Market Share of Out-of-home Food and Beverage Segmented by Region in 2018 Table Company Profiles Table Product Introduction Table Philip Morris International Inc. Production, Value ($), Price, Gross Margin 2014-2019 Figure Philip Morris International Inc. Production and Growth Rate Figure Philip Morris International Inc. Value ($) Market Share 2014-2019 Figure Philip Morris International Inc. Market Share of Out-of-home Food and Beverage Segmented by Region in 2018 Table Company Profiles Table Product Introduction Table Tyson Foods Inc Production, Value ($), Price, Gross Margin 2014-2019 Figure Tyson Foods Inc Production and Growth Rate Figure Tyson Foods Inc Value ($) Market Share 2014-2019 Figure Tyson Foods Inc Market Share of Out-of-home Food and Beverage Segmented by Region in 2018 Table Company Profiles Table Product Introduction Table Anheuser Busch InBev Production, Value ($), Price, Gross Margin 2014-2019 Figure Anheuser Busch InBev Production and Growth Rate Figure Anheuser Busch InBev Value ($) Market Share 2014-2019 Figure Anheuser Busch InBev Market Share of Out-of-home Food and Beverage Segmented by Region in 2018 Table Company Profiles Table Product Introduction Table Kraft Heinz Compan Production, Value ($), Price, Gross Margin 2014-2019 Figure Kraft Heinz Compan Production and Growth Rate Figure Kraft Heinz Compan Value ($) Market Share 2014-2019 Figure Kraft Heinz Compan Market Share of Out-of-home Food and Beverage Segmented by Region in 2018 Table Company Profiles Table Product Introduction Table Dunkin’Brand Group Production, Value ($), Price, Gross Margin 2014-2019 Figure Dunkin’Brand Group Production and Growth Rate Figure Dunkin’Brand Group Value ($) Market Share 2014-2019 Figure Dunkin’Brand Group Market Share of Out-of-home Food and Beverage Segmented by Region in 2018 Table Company Profiles Table Product Introduction Table Mondelez International Inc Production, Value ($), Price, Gross Margin 2014-2019 Figure Mondelez International Inc Production and Growth Rate Figure Mondelez International Inc Value ($) Market Share 2014-2019 Figure Mondelez International Inc Market Share of Out-of-home Food and Beverage Segmented by Region in 2018 Table Company Profiles Table Product Introduction Table Constellation Brands Production, Value ($), Price, Gross Margin 2014-2019 Figure Constellation Brands Production and Growth Rate Figure Constellation Brands Value ($) Market Share 2014-2019 Figure Constellation Brands Market Share of Out-of-home Food and Beverage Segmented by Region in 2018 Table Company Profiles Table Product Introduction Table Nestle SA Production, Value ($), Price, Gross Margin 2014-2019 Figure Nestle SA Production and Growth Rate Figure Nestle SA Value ($) Market Share 2014-2019 Figure Nestle SA Market Share of Out-of-home Food and Beverage Segmented by Region in 2018 Table Company Profiles Table Product Introduction Table Mars Inc. Production, Value ($), Price, Gross Margin 2014-2019 Figure Mars Inc. Production and Growth Rate Figure Mars Inc. Value ($) Market Share 2014-2019 Figure Mars Inc. Market Share of Out-of-home Food and Beverage Segmented by Region in 2018 Table Company Profiles Table Product Introduction Table Anheuser Busch InBev Production, Value ($), Price, Gross Margin 2014-2019 Figure Anheuser Busch InBev Production and Growth Rate Figure Anheuser Busch InBev Value ($) Market Share 2014-2019 Figure Anheuser Busch InBev Market Share of Out-of-home Food and Beverage Segmented by Region in 2018 Table Company Profiles Table Product Introduction Table JBS S.A. Production, Value ($), Price, Gross Margin 2014-2019 Figure JBS S.A. Production and Growth Rate Figure JBS S.A. Value ($) Market Share 2014-2019 Figure JBS S.A. Market Share of Out-of-home Food and Beverage Segmented by Region in 2018 Table Company Profiles Table Product Introduction Table Diageo Production, Value ($), Price, Gross Margin 2014-2019 Figure Diageo Production and Growth Rate Figure Diageo Value ($) Market Share 2014-2019 Figure Diageo Market Share of Out-of-home Food and Beverage Segmented by Region in 2018 Table Company Profiles Table Product Introduction Table Coca cola Production, Value ($), Price, Gross Margin 2014-2019 Figure Coca cola Production and Growth Rate Figure Coca cola Value ($) Market Share 2014-2019 Figure Coca cola Market Share of Out-of-home Food and Beverage Segmented by Region in 2018 Table Company Profiles Table Product Introduction Table PepsiCo Production, Value ($), Price, Gross Margin 2014-2019 Figure PepsiCo Production and Growth Rate Figure PepsiCo Value ($) Market Share 2014-2019 Figure PepsiCo Market Share of Out-of-home Food and Beverage Segmented by Region in 2018 Table Company Profiles Table Product Introduction Table General Mills Production, Value ($), Price, Gross Margin 2014-2019 Figure General Mills Production and Growth Rate Figure General Mills Value ($) Market Share 2014-2019 Figure General Mills Market Share of Out-of-home Food and Beverage Segmented by Region in 2018 Table Global Out-of-home Food and Beverage Market Value ($) Forecast, by Type Table Global Out-of-home Food and Beverage Market Volume Forecast, by Type Figure Global Out-of-home Food and Beverage Market Value ($) and Growth Rate Forecast of Food (2019-2024) Figure Global Out-of-home Food and Beverage Market Volume and Growth Rate Forecast of Food (2019-2024) Figure Global Out-of-home Food and Beverage Market Value ($) and Growth Rate Forecast of Beverage (2019-2024) Figure Global Out-of-home Food and Beverage Market Volume and Growth Rate Forecast of Beverage (2019-2024) Table Global Market Value ($) Forecast by Application (2019-2024) Table Global Market Volume Forecast by Application (2019-2024) Figure Global Out-of-home Food and Beverage Consumption and Growth Rate of Retail channel (2014-2019) Figure Global Out-of-home Food and Beverage Consumption and Growth Rate of OOH Channel (2014-2019) Figure Market Value ($) and Growth Rate Forecast of OOH Channel (2019-2024) Figure Market Volume and Growth Rate Forecast of OOH Channel (2019-2024) Figure North America Market Value ($) and Growth Rate Forecast (2019-2024) Table North America Consumption and Growth Rate Forecast (2019-2024) Figure Europe Market Value ($) and Growth Rate Forecast (2019-2024) Table Europe Consumption and Growth Rate Forecast (2019-2024) Figure China Market Value ($) and Growth Rate Forecast (2019-2024) Table China Consumption and Growth Rate Forecast (2019-2024) Figure Japan Market Value ($) and Growth Rate Forecast (2019-2024) Table Japan Consumption and Growth Rate Forecast (2019-2024) Figure Middle East & Africa Market Value ($) and Growth Rate Forecast (2019-2024) Table Middle East & Africa Consumption and Growth Rate Forecast (2019-2024) Figure India Market Value ($) and Growth Rate Forecast (2019-2024) Table India Consumption and Growth Rate Forecast (2019-2024) Figure South America Market Value ($) and Growth Rate Forecast (2019-2024) Table South America Consumption and Growth Rate Forecast (2019-2024) Figure Industry Resource/Technology/Labor Importance Analysis Table New Entrants SWOT Analysis Table New Project Analysis of Investment Recovery
Inquiry For Buying
Out-of-home Food and Beverage
Request Sample
Out-of-home Food and Beverage