Passive And Interconnecting Electronic Market Size, Share, and Trends Analysis Report
CAGR :

| Market Size 2023 (Base Year) | USD 180.54 Billion |
| Market Size 2032 (Forecast Year) | USD 275.06 Billion |
| CAGR | 4.3% |
| Forecast Period | 2024 - 2032 |
| Historical Period | 2018 - 2023 |
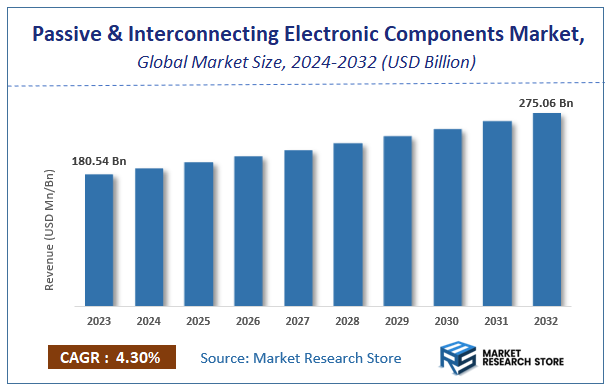
Market Research Store has published a report on the global passive and interconnecting electronic components market, estimating its value at USD 180.54 Billion in 2023, with projections indicating it will reach USD 275.06 Billion by the end of 2032. The market is expected to expand at a compound annual growth rate (CAGR) of around 4.3% over the forecast period. The report examines the factors driving market growth, the obstacles that could hinder this expansion, and the opportunities that may emerge in the passive and interconnecting electronic components industry. Additionally, it offers a detailed analysis of how these elements will affect demand dynamics and market performance throughout the forecast period.
To Get more Insights, Request a Free Sample
Passive And Interconnecting Electronic Components Market: Overview
The growth of the passive and interconnecting electronic components market is fueled by rising global demand across various industries and applications. The report highlights lucrative opportunities, analyzing cost structures, key segments, emerging trends, regional dynamics, and advancements by leading players to provide comprehensive market insights. The passive and interconnecting electronic components market report offers a detailed industry analysis from 2024 to 2032, combining quantitative and qualitative insights. It examines key factors such as pricing, market penetration, GDP impact, industry dynamics, major players, consumer behavior, and socio-economic conditions. Structured into multiple sections, the report provides a comprehensive perspective on the market from all angles.
Key sections of the passive and interconnecting electronic components market report include market segments, outlook, competitive landscape, and company profiles. Market Segments offer in-depth details based on Component Type, Material, Application, End-User, and other relevant classifications to support strategic marketing initiatives. Market Outlook thoroughly analyzes market trends, growth drivers, restraints, opportunities, challenges, Porter’s Five Forces framework, macroeconomic factors, value chain analysis, and pricing trends shaping the market now and in the future. The Competitive Landscape and Company Profiles section highlights major players, their strategies, and market positioning to guide investment and business decisions. The report also identifies innovation trends, new business opportunities, and investment prospects for the forecast period.
Key Highlights:
- As per the analysis shared by our research analyst, the global passive and interconnecting electronic components market is estimated to grow annually at a CAGR of around 4.3% over the forecast period (2024-2032).
- In terms of revenue, the global passive and interconnecting electronic components market size was valued at around USD 180.54 Billion in 2023 and is projected to reach USD 275.06 Billion by 2032.
- The market is projected to grow at a significant rate due to Growing electronics and telecom industries boost component demand.
- Based on the Component Type, the Resistors segment is growing at a high rate and will continue to dominate the global market as per industry projections.
- On the basis of Material, the Ceramic segment is anticipated to command the largest market share.
- In terms of Application, the Consumer Electronics segment is projected to lead the global market.
- By End-User, the OEMs segment is predicted to dominate the global market.
- Based on region, Asia-Pacific is projected to dominate the global market during the forecast period.
Passive And Interconnecting Electronic Components Market: Report Scope
This report thoroughly analyzes the passive and interconnecting electronic components market, exploring its historical trends, current state, and future projections. The market estimates presented result from a robust research methodology, incorporating primary research, secondary sources, and expert opinions. These estimates are influenced by the prevailing market dynamics as well as key economic, social, and political factors. Furthermore, the report considers the impact of regulations, government expenditures, and advancements in research and development on the market. Both positive and negative shifts are evaluated to ensure a comprehensive and accurate market outlook.
| Report Attributes | Report Details |
|---|---|
| Report Name | Passive And Interconnecting Electronic Components Market |
| Market Size in 2023 | USD 180.54 Billion |
| Market Forecast in 2032 | USD 275.06 Billion |
| Growth Rate | CAGR of 4.3% |
| Number of Pages | 237 |
| Key Companies Covered | Murata Manufacturing, AVX Corporation, TDK Corporation, Vishay Intertechnology, TE Connectivity, Yageo Corporation, Panasonic, KYOCERA AVX, Molex, Littelfuse |
| Segments Covered | By Component Type, By Material, By Application, By End-User, and By Region |
| Regions Covered | North America, Europe, Asia Pacific (APAC), Latin America, Middle East, and Africa (MEA) |
| Base Year | 2023 |
| Historical Year | 2018 to 2023 |
| Forecast Year | 2024 to 2032 |
| Customization Scope | Avail customized purchase options to meet your exact research needs. Request For Customization |
Passive And Interconnecting Electronic Components Market: Dynamics
The Passive and Interconnecting Electronic Components market forms the fundamental building blocks of virtually all electronic devices and systems, from consumer electronics to complex industrial and aerospace applications. This market, encompassing components like resistors, capacitors, inductors, connectors, and PCBs, is perpetually in flux due to rapid technological advancements and evolving end-user demands.
Key Growth Drivers:
The most significant driver is the explosive growth and increasing sophistication of the Internet of Things (IoT) devices, across consumer, industrial, and automotive sectors. Every connected device, from smart home appliances to industrial sensors, relies heavily on a multitude of passive and interconnecting components. The widespread adoption of 5G technology is also a major catalyst, demanding high-frequency, high-performance components for network infrastructure, base stations, and 5G-enabled mobile devices. Furthermore, the accelerating trend of vehicle electrification and the integration of advanced infotainment, safety, and driver-assistance systems (ADAS) in automobiles significantly boosts the demand for reliable and miniaturized electronic components capable of operating in harsh environments.
Restraints:
The market faces significant restraints primarily due to the intense pricing pressure and declining profit margins experienced by manufacturers, largely driven by aggressive competition from numerous global players and the proliferation of counterfeit products. The volatile prices of key raw materials such as copper, aluminum, palladium, and rare earth elements directly impact production costs, leading to instability in pricing and profit erosion. Additionally, the industry is highly susceptible to global supply chain disruptions, as evidenced by recent events like the COVID-19 pandemic and geopolitical tensions, which can lead to component shortages, extended lead times, and increased costs, severely impacting overall market stability and growth.
Opportunities:
Significant opportunities lie in the continuous innovation towards miniaturization and higher performance, allowing more functionality to be packed into smaller electronic devices, wearables, and medical implants. The development of advanced materials and manufacturing techniques is enabling components to operate reliably in more extreme temperatures and harsh environments, opening up new applications in industrial, automotive under-the-hood, and aerospace sectors. The increasing focus on energy efficiency across all electronic systems drives demand for high-efficiency passive components that reduce power loss and improve heat management, particularly in electric vehicles, data centers, and renewable energy systems. Furthermore, the integration of passive components with active systems and the development of multi-component modules offer compact, efficient, and cost-saving solutions, streamlining design and enhancing system performance.
Challenges:
A key challenge is keeping pace with the rapid technological obsolescence, as the relentless pace of innovation in end-user industries means that components can quickly become outdated. Manufacturers must continuously invest heavily in research and development to update their product offerings and stay competitive. Ensuring robust quality control and reliability for components, especially as they shrink in size and are exposed to increasingly demanding operating conditions, remains a critical engineering and manufacturing challenge. Additionally, navigating the complex and evolving landscape of environmental and regulatory compliance, such as restrictions on hazardous substances, and managing waste disposal, adds significant cost and complexity for manufacturers operating globally.
Passive And Interconnecting Electronic Components Market: Segmentation Insights
The global passive and interconnecting electronic components market is segmented based on Component Type, Material, Application, End-User, and Region. All the segments of the passive and interconnecting electronic components market have been analyzed based on present & future trends and the market is estimated from 2024 to 2032.
Based on Component Type, the global passive and interconnecting electronic components market is divided into Resistors, Capacitors, Inductors, Transformers, Connectors, Switches, Others.
On the basis of Material, the global passive and interconnecting electronic components market is bifurcated into Ceramic, Tantalum, Aluminum, Film, Others.
In terms of Application, the global passive and interconnecting electronic components market is categorized into Consumer Electronics, Automotive, Aerospace & Defense, Industrial, Telecommunication, Healthcare.
Based on End-User, the global passive and interconnecting electronic components market is split into OEMs, ODMs, Distributors, EMS Providers.
Passive And Interconnecting Electronic Components Market: Regional Insights
The Asia-Pacific (APAC) region dominates the global passive and interconnecting electronic components market, accounting for the largest revenue share due to rapid industrialization, booming consumer electronics production, and expanding telecommunications infrastructure. China is the primary driver, supported by its massive electronics manufacturing sector, strong presence of component suppliers like Yageo and Murata, and government initiatives like "Made in China 2025." North America follows closely, with demand fueled by advanced automotive electronics, 5G deployments, and aerospace applications in the U.S., where companies like TE Connectivity and AVX Corporation operate.
Europe shows steady growth, driven by automotive electrification and industrial automation in Germany, France, and Italy. The Middle East & Africa and Latin America exhibit emerging demand, linked to growing IoT adoption and infrastructure development. APAC’s dominance is expected to grow further, supported by EV production, AI hardware demand, and semiconductor industry expansion.
Passive And Interconnecting Electronic Components Market: Competitive Landscape
The passive and interconnecting electronic components market report offers a thorough analysis of both established and emerging players within the market. It includes a detailed list of key companies, categorized based on the types of products they offer and other relevant factors. The report also highlights the market entry year for each player, providing further context for the research analysis.
The "Global Passive And Interconnecting Electronic Components Market" study offers valuable insights, focusing on the global market landscape, with an emphasis on major industry players such as;
- Murata Manufacturing
- AVX Corporation
- TDK Corporation
- Vishay Intertechnology
- TE Connectivity
- Yageo Corporation
- Panasonic
- KYOCERA AVX
- Molex
- Littelfuse
The Global Passive And Interconnecting Electronic Components Market is Segmented as Follows:
By Component Type
- Resistors
- Capacitors
- Inductors
- Transformers
- Connectors
- Switches
- Others
By Material
- Ceramic
- Tantalum
- Aluminum
- Film
- Others
By Application
- Consumer Electronics
- Automotive
- Aerospace & Defense
- Industrial
- Telecommunication
- Healthcare
By End-User
- OEMs
- ODMs
- Distributors
- EMS Providers
By Region
- North America
- The U.S.
- Canada
- Mexico
- Europe
- France
- The UK
- Spain
- Germany
- Italy
- Rest of Europe
- Asia Pacific
- China
- Japan
- India
- Australia
- South Korea
- Rest of Asia Pacific
- The Middle East & Africa
- Saudi Arabia
- UAE
- Egypt
- Kuwait
- South Africa
- Rest of the Middle East & Africa
- Latin America
- Brazil
- Argentina
- Rest of Latin America
Market Evolution
This section evaluates the market position of the product or service by examining its development pathway and competitive dynamics. It provides a detailed overview of the product's growth stages, including the early (historical) phase, the mid-stage, and anticipated future advancements influenced by innovation and emerging technologies.
Porter’s Analysis
Porter’s Five Forces framework offers a strategic lens for assessing competitor behavior and the positioning of key players in the passive and interconnecting electronic components industry. This section explores the external factors shaping competitive dynamics and influencing market strategies in the years ahead. The analysis focuses on five critical forces:
- Competitive Rivalry
- Threat of New Entrants
- Threat of Substitutes
- Supplier Bargaining Power
- Buyer Bargaining Power
Value Chain & Market Attractiveness Analysis
The value chain analysis helps businesses optimize operations by mapping the product flow from suppliers to end consumers, identifying opportunities to streamline processes and gain a competitive edge. Segment-wise market attractiveness analysis evaluates key dimensions like product categories, demographics, and regions, assessing growth potential, market size, and profitability. This enables businesses to focus resources on high-potential segments for better ROI and long-term value.
PESTEL Analysis
PESTEL analysis is a powerful tool in market research reports that enhances market understanding by systematically examining the external macro-environmental factors influencing a business or industry. The acronym stands for Political, Economic, Social, Technological, Environmental, and Legal factors. By evaluating these dimensions, PESTEL analysis provides a comprehensive overview of the broader context within which a market operates, helping businesses identify potential opportunities and threats.
- Political factors assess government policies, stability, trade regulations, and political risks that could impact market operations.
- Economic factors examine variables like inflation, exchange rates, economic growth, and consumer spending power to determine market viability.
- Social factors explore cultural trends, demographics, and lifestyle changes that shape consumer behavior and preferences.
- Technological factors evaluate innovation, R&D, and technological advancements affecting product development and operational efficiencies.
- Environmental factors focus on sustainability, climate change impacts, and eco-friendly practices shaping market trends.
- Legal factors address compliance requirements, industry regulations, and intellectual property laws impacting market entry and operations.
Import-Export Analysis & Pricing Analysis
An import-export analysis is vital for market research, revealing global trade dynamics, trends, and opportunities. It examines trade volumes, product categories, and regional competitiveness, offering insights into supply chains and market demand. This section also analyzes past and future pricing trends, helping businesses optimize strategies and enabling consumers to assess product value effectively.
Passive And Interconnecting Electronic Components Market: Company Profiles
The report identifies key players in the passive and interconnecting electronic components market through a competitive landscape and company profiles, evaluating their offerings, financial performance, strategies, and market positioning. It includes a SWOT analysis of the top 3-5 companies, assessing strengths, weaknesses, opportunities, and threats. The competitive landscape highlights rankings, recent activities (mergers, acquisitions, partnerships, product launches), and regional footprints using the Ace matrix. Customization is available to meet client-specific needs.
Regional & Industry Footprint
This section details the geographic reach, sales networks, and market penetration of companies profiled in the passive and interconnecting electronic components report, showcasing their operations and distribution across regions. It analyzes the alignment of companies with specific industry verticals, highlighting the industries they serve and the scope of their products and services within those sectors.
Ace Matrix
This section categorizes companies into four distinct groups—Active, Cutting Edge, Innovator, and Emerging—based on their product and business strategies. The evaluation of product strategy focuses on aspects such as the range and depth of offerings, commitment to innovation, product functionalities, and scalability. Key elements like global reach, sector coverage, strategic acquisitions, and long-term growth plans are considered for business strategy. This analysis provides a detailed view of companies' position within the market and highlights their potential for future growth and development.
Research Methodology
The qualitative and quantitative insights for the passive and interconnecting electronic components market are derived through a multi-faceted research approach, combining input from subject matter experts, primary research, and secondary data sources. Primary research includes gathering critical information via face-to-face or telephonic interviews, surveys, questionnaires, and feedback from industry professionals, key opinion leaders (KOLs), and customers. Regular interviews with industry experts are conducted to deepen the analysis and reinforce the existing data, ensuring a robust and well-rounded market understanding.
Secondary research for this report was carried out by the Market Research Store team, drawing on a variety of authoritative sources, such as:
- Official company websites, annual reports, financial statements, investor presentations, and SEC filings
- Internal and external proprietary databases, as well as relevant patent and regulatory databases
- Government publications, national statistical databases, and industry-specific market reports
- Media coverage, including news articles, press releases, and webcasts about market participants
- Paid industry databases for detailed market insights
Market Research Store conducted in-depth consultations with various key opinion leaders in the industry, including senior executives from top companies and regional leaders from end-user organizations. This effort aimed to gather critical insights on factors such as the market share of dominant brands in specific countries and regions, along with pricing strategies for products and services.
To determine total sales data, the research team conducted primary interviews across multiple countries with influential stakeholders, including:
- Distributors
- Marketing, Brand, and Product Managers
- Procurement and Production Managers
- Sales and Regional Sales Managers, Country Managers
- Technical Specialists
- C-Level Executives
These subject matter experts, with their extensive industry experience, helped validate and refine the findings. For secondary research, data were sourced from a wide range of materials, including online resources, company annual reports, industry publications, research papers, association reports, and government websites. These various sources provide a comprehensive and well-rounded perspective on the market.
Frequently Asked Questions
Table Of Content
List of Tables and Figures Figure Product Picture of Passive And Interconnecting Electronic Components Table Product Specification of Passive And Interconnecting Electronic Components Figure Market Concentration Ratio and Market Maturity Analysis of Passive And Interconnecting Electronic Components Figure Global Passive And Interconnecting Electronic Components Value ($) and Growth Rate from 2014-2024 Table Different Types of Passive And Interconnecting Electronic Components Figure Global Passive And Interconnecting Electronic Components Value ($) Segment by Type from 2014-2019 Figure Passive Electronic Components Picture Figure Interconnecting Electronic Components Picture Table Different Applications of Passive And Interconnecting Electronic Components Figure Global Passive And Interconnecting Electronic Components Value ($) Segment by Applications from 2014-2019 Figure Consumer Electronics Picture Figure Automotive Picture Figure Healthcare Picture Figure Telecommunication & Information Technology (IT) Picture Figure Defense Services Picture Figure Industrial Picture Table Research Regions of Passive And Interconnecting Electronic Components Figure North America Passive And Interconnecting Electronic Components Production Value ($) and Growth Rate (2014-2019) Figure Europe Passive And Interconnecting Electronic Components Production Value ($) and Growth Rate (2014-2019) Table China Passive And Interconnecting Electronic Components Production Value ($) and Growth Rate (2014-2019) Table Japan Passive And Interconnecting Electronic Components Production Value ($) and Growth Rate (2014-2019) Table Middle East & Africa Passive And Interconnecting Electronic Components Production Value ($) and Growth Rate (2014-2019) Table India Passive And Interconnecting Electronic Components Production Value ($) and Growth Rate (2014-2019) Table South America Passive And Interconnecting Electronic Components Production Value ($) and Growth Rate (2014-2019) Table Emerging Countries of Passive And Interconnecting Electronic Components Table Growing Market of Passive And Interconnecting Electronic Components Figure Industry Chain Analysis of Passive And Interconnecting Electronic Components Table Upstream Raw Material Suppliers of Passive And Interconnecting Electronic Components with Contact Information Table Major Players Manufacturing Base and Market Share ($) of Passive And Interconnecting Electronic Components in 2018 Table Major Players Passive And Interconnecting Electronic Components Product Types in 2018 Figure Production Process of Passive And Interconnecting Electronic Components Figure Manufacturing Cost Structure of Passive And Interconnecting Electronic Components Figure Channel Status of Passive And Interconnecting Electronic Components Table Major Distributors of Passive And Interconnecting Electronic Components with Contact Information Table Major Downstream Buyers of Passive And Interconnecting Electronic Components with Contact Information Table Global Passive And Interconnecting Electronic Components Value ($) by Type (2014-2019) Table Global Passive And Interconnecting Electronic Components Value ($) Share by Type (2014-2019) Figure Global Passive And Interconnecting Electronic Components Value ($) Share by Type (2014-2019) Table Global Passive And Interconnecting Electronic Components Production by Type (2014-2019) Table Global Passive And Interconnecting Electronic Components Production Share by Type (2014-2019) Figure Global Passive And Interconnecting Electronic Components Production Share by Type (2014-2019) Figure Global Passive And Interconnecting Electronic Components Value ($) and Growth Rate of Passive Electronic Components Figure Global Passive And Interconnecting Electronic Components Value ($) and Growth Rate of Interconnecting Electronic Components Figure Global Passive And Interconnecting Electronic Components Price by Type (2014-2019) Table Global Passive And Interconnecting Electronic Components Consumption by Application (2014-2019) Table Global Passive And Interconnecting Electronic Components Consumption Market Share by Application (2014-2019) Figure Global Passive And Interconnecting Electronic Components Consumption Market Share by Application (2014-2019) Table Downstream Buyers Introduction by Application Figure Global Passive And Interconnecting Electronic Components Consumption and Growth Rate of Consumer Electronics (2014-2019) Figure Global Passive And Interconnecting Electronic Components Consumption and Growth Rate of Automotive (2014-2019) Figure Global Passive And Interconnecting Electronic Components Consumption and Growth Rate of Healthcare (2014-2019) Figure Global Passive And Interconnecting Electronic Components Consumption and Growth Rate of Telecommunication & Information Technology (IT) (2014-2019) Figure Global Passive And Interconnecting Electronic Components Consumption and Growth Rate of Defense Services (2014-2019) Figure Global Passive And Interconnecting Electronic Components Consumption and Growth Rate of Industrial (2014-2019) Table Global Passive And Interconnecting Electronic Components Value ($) by Region (2014-2019) Table Global Passive And Interconnecting Electronic Components Value ($) Market Share by Region (2014-2019) Figure Global Passive And Interconnecting Electronic Components Value ($) Market Share by Region (2014-2019) Table Global Passive And Interconnecting Electronic Components Production by Region (2014-2019) Table Global Passive And Interconnecting Electronic Components Production Market Share by Region (2014-2019) Figure Global Passive And Interconnecting Electronic Components Production Market Share by Region (2014-2019) Table Global Passive And Interconnecting Electronic Components Production, Value ($), Price and Gross Margin (2014-2019) Table North America Passive And Interconnecting Electronic Components Production, Value ($), Price and Gross Margin (2014-2019) Table Europe Passive And Interconnecting Electronic Components Production, Value ($), Price and Gross Margin (2014-2019) Table China Passive And Interconnecting Electronic Components Production, Value ($), Price and Gross Margin (2014-2019) Table Japan Passive And Interconnecting Electronic Components Production, Value ($), Price and Gross Margin (2014-2019) Table Middle East & Africa Passive And Interconnecting Electronic Components Production, Value ($), Price and Gross Margin (2014-2019) Table India Passive And Interconnecting Electronic Components Production, Value ($), Price and Gross Margin (2014-2019) Table South America Passive And Interconnecting Electronic Components Production, Value ($), Price and Gross Margin (2014-2019) Table Global Passive And Interconnecting Electronic Components Consumption by Regions (2014-2019) Figure Global Passive And Interconnecting Electronic Components Consumption Share by Regions (2014-2019) Table North America Passive And Interconnecting Electronic Components Production, Consumption, Export, Import (2014-2019) Table Europe Passive And Interconnecting Electronic Components Production, Consumption, Export, Import (2014-2019) Table China Passive And Interconnecting Electronic Components Production, Consumption, Export, Import (2014-2019) Table Japan Passive And Interconnecting Electronic Components Production, Consumption, Export, Import (2014-2019) Table Middle East & Africa Passive And Interconnecting Electronic Components Production, Consumption, Export, Import (2014-2019) Table India Passive And Interconnecting Electronic Components Production, Consumption, Export, Import (2014-2019) Table South America Passive And Interconnecting Electronic Components Production, Consumption, Export, Import (2014-2019) Figure North America Passive And Interconnecting Electronic Components Production and Growth Rate Analysis Figure North America Passive And Interconnecting Electronic Components Consumption and Growth Rate Analysis Figure North America Passive And Interconnecting Electronic Components SWOT Analysis Figure Europe Passive And Interconnecting Electronic Components Production and Growth Rate Analysis Figure Europe Passive And Interconnecting Electronic Components Consumption and Growth Rate Analysis Figure Europe Passive And Interconnecting Electronic Components SWOT Analysis Figure China Passive And Interconnecting Electronic Components Production and Growth Rate Analysis Figure China Passive And Interconnecting Electronic Components Consumption and Growth Rate Analysis Figure China Passive And Interconnecting Electronic Components SWOT Analysis Figure Japan Passive And Interconnecting Electronic Components Production and Growth Rate Analysis Figure Japan Passive And Interconnecting Electronic Components Consumption and Growth Rate Analysis Figure Japan Passive And Interconnecting Electronic Components SWOT Analysis Figure Middle East & Africa Passive And Interconnecting Electronic Components Production and Growth Rate Analysis Figure Middle East & Africa Passive And Interconnecting Electronic Components Consumption and Growth Rate Analysis Figure Middle East & Africa Passive And Interconnecting Electronic Components SWOT Analysis Figure India Passive And Interconnecting Electronic Components Production and Growth Rate Analysis Figure India Passive And Interconnecting Electronic Components Consumption and Growth Rate Analysis Figure India Passive And Interconnecting Electronic Components SWOT Analysis Figure South America Passive And Interconnecting Electronic Components Production and Growth Rate Analysis Figure South America Passive And Interconnecting Electronic Components Consumption and Growth Rate Analysis Figure South America Passive And Interconnecting Electronic Components SWOT Analysis Figure Top 3 Market Share of Passive And Interconnecting Electronic Components Companies Figure Top 6 Market Share of Passive And Interconnecting Electronic Components Companies Table Mergers, Acquisitions and Expansion Analysis Table Company Profiles Table Product Introduction Table Delphi Connection Systems Production, Value ($), Price, Gross Margin 2014-2019 Figure Delphi Connection Systems Production and Growth Rate Figure Delphi Connection Systems Value ($) Market Share 2014-2019 Figure Delphi Connection Systems Market Share of Passive And Interconnecting Electronic Components Segmented by Region in 2018 Table Company Profiles Table Product Introduction Table Eaton Production, Value ($), Price, Gross Margin 2014-2019 Figure Eaton Production and Growth Rate Figure Eaton Value ($) Market Share 2014-2019 Figure Eaton Market Share of Passive And Interconnecting Electronic Components Segmented by Region in 2018 Table Company Profiles Table Product Introduction Table Panasonic Electronic Production, Value ($), Price, Gross Margin 2014-2019 Figure Panasonic Electronic Production and Growth Rate Figure Panasonic Electronic Value ($) Market Share 2014-2019 Figure Panasonic Electronic Market Share of Passive And Interconnecting Electronic Components Segmented by Region in 2018 Table Company Profiles Table Product Introduction Table 3M Electronics Production, Value ($), Price, Gross Margin 2014-2019 Figure 3M Electronics Production and Growth Rate Figure 3M Electronics Value ($) Market Share 2014-2019 Figure 3M Electronics Market Share of Passive And Interconnecting Electronic Components Segmented by Region in 2018 Table Company Profiles Table Product Introduction Table Philips Electronics Production, Value ($), Price, Gross Margin 2014-2019 Figure Philips Electronics Production and Growth Rate Figure Philips Electronics Value ($) Market Share 2014-2019 Figure Philips Electronics Market Share of Passive And Interconnecting Electronic Components Segmented by Region in 2018 Table Company Profiles Table Product Introduction Table ABB Production, Value ($), Price, Gross Margin 2014-2019 Figure ABB Production and Growth Rate Figure ABB Value ($) Market Share 2014-2019 Figure ABB Market Share of Passive And Interconnecting Electronic Components Segmented by Region in 2018 Table Company Profiles Table Product Introduction Table STMicroelectronics Production, Value ($), Price, Gross Margin 2014-2019 Figure STMicroelectronics Production and Growth Rate Figure STMicroelectronics Value ($) Market Share 2014-2019 Figure STMicroelectronics Market Share of Passive And Interconnecting Electronic Components Segmented by Region in 2018 Table Company Profiles Table Product Introduction Table Yageo Production, Value ($), Price, Gross Margin 2014-2019 Figure Yageo Production and Growth Rate Figure Yageo Value ($) Market Share 2014-2019 Figure Yageo Market Share of Passive And Interconnecting Electronic Components Segmented by Region in 2018 Table Company Profiles Table Product Introduction Table Hosiden Production, Value ($), Price, Gross Margin 2014-2019 Figure Hosiden Production and Growth Rate Figure Hosiden Value ($) Market Share 2014-2019 Figure Hosiden Market Share of Passive And Interconnecting Electronic Components Segmented by Region in 2018 Table Company Profiles Table Product Introduction Table EDAC Production, Value ($), Price, Gross Margin 2014-2019 Figure EDAC Production and Growth Rate Figure EDAC Value ($) Market Share 2014-2019 Figure EDAC Market Share of Passive And Interconnecting Electronic Components Segmented by Region in 2018 Table Company Profiles Table Product Introduction Table Datronix Holdings Production, Value ($), Price, Gross Margin 2014-2019 Figure Datronix Holdings Production and Growth Rate Figure Datronix Holdings Value ($) Market Share 2014-2019 Figure Datronix Holdings Market Share of Passive And Interconnecting Electronic Components Segmented by Region in 2018 Table Company Profiles Table Product Introduction Table AVX Production, Value ($), Price, Gross Margin 2014-2019 Figure AVX Production and Growth Rate Figure AVX Value ($) Market Share 2014-2019 Figure AVX Market Share of Passive And Interconnecting Electronic Components Segmented by Region in 2018 Table Company Profiles Table Product Introduction Table Hamlin Production, Value ($), Price, Gross Margin 2014-2019 Figure Hamlin Production and Growth Rate Figure Hamlin Value ($) Market Share 2014-2019 Figure Hamlin Market Share of Passive And Interconnecting Electronic Components Segmented by Region in 2018 Table Company Profiles Table Product Introduction Table Hirose Electric Production, Value ($), Price, Gross Margin 2014-2019 Figure Hirose Electric Production and Growth Rate Figure Hirose Electric Value ($) Market Share 2014-2019 Figure Hirose Electric Market Share of Passive And Interconnecting Electronic Components Segmented by Region in 2018 Table Company Profiles Table Product Introduction Table Fujitsu Component Production, Value ($), Price, Gross Margin 2014-2019 Figure Fujitsu Component Production and Growth Rate Figure Fujitsu Component Value ($) Market Share 2014-2019 Figure Fujitsu Component Market Share of Passive And Interconnecting Electronic Components Segmented by Region in 2018 Table Company Profiles Table Product Introduction Table API Technologies Production, Value ($), Price, Gross Margin 2014-2019 Figure API Technologies Production and Growth Rate Figure API Technologies Value ($) Market Share 2014-2019 Figure API Technologies Market Share of Passive And Interconnecting Electronic Components Segmented by Region in 2018 Table Company Profiles Table Product Introduction Table American Electronic Components Production, Value ($), Price, Gross Margin 2014-2019 Figure American Electronic Components Production and Growth Rate Figure American Electronic Components Value ($) Market Share 2014-2019 Figure American Electronic Components Market Share of Passive And Interconnecting Electronic Components Segmented by Region in 2018 Table Company Profiles Table Product Introduction Table Gilard Electronics Production, Value ($), Price, Gross Margin 2014-2019 Figure Gilard Electronics Production and Growth Rate Figure Gilard Electronics Value ($) Market Share 2014-2019 Figure Gilard Electronics Market Share of Passive And Interconnecting Electronic Components Segmented by Region in 2018 Table Global Passive And Interconnecting Electronic Components Market Value ($) Forecast, by Type Table Global Passive And Interconnecting Electronic Components Market Volume Forecast, by Type Figure Global Passive And Interconnecting Electronic Components Market Value ($) and Growth Rate Forecast of Passive Electronic Components (2019-2024) Figure Global Passive And Interconnecting Electronic Components Market Volume and Growth Rate Forecast of Passive Electronic Components (2019-2024) Figure Global Passive And Interconnecting Electronic Components Market Value ($) and Growth Rate Forecast of Interconnecting Electronic Components (2019-2024) Figure Global Passive And Interconnecting Electronic Components Market Volume and Growth Rate Forecast of Interconnecting Electronic Components (2019-2024) Table Global Market Value ($) Forecast by Application (2019-2024) Table Global Market Volume Forecast by Application (2019-2024) Figure Global Passive And Interconnecting Electronic Components Consumption and Growth Rate of Consumer Electronics (2014-2019) Figure Global Passive And Interconnecting Electronic Components Consumption and Growth Rate of Automotive (2014-2019) Figure Global Passive And Interconnecting Electronic Components Consumption and Growth Rate of Healthcare (2014-2019) Figure Global Passive And Interconnecting Electronic Components Consumption and Growth Rate of Telecommunication & Information Technology (IT) (2014-2019) Figure Global Passive And Interconnecting Electronic Components Consumption and Growth Rate of Defense Services (2014-2019) Figure Global Passive And Interconnecting Electronic Components Consumption and Growth Rate of Industrial (2014-2019) Figure Market Value ($) and Growth Rate Forecast of Industrial (2019-2024) Figure Market Volume and Growth Rate Forecast of Industrial (2019-2024) Figure North America Market Value ($) and Growth Rate Forecast (2019-2024) Table North America Consumption and Growth Rate Forecast (2019-2024) Figure Europe Market Value ($) and Growth Rate Forecast (2019-2024) Table Europe Consumption and Growth Rate Forecast (2019-2024) Figure China Market Value ($) and Growth Rate Forecast (2019-2024) Table China Consumption and Growth Rate Forecast (2019-2024) Figure Japan Market Value ($) and Growth Rate Forecast (2019-2024) Table Japan Consumption and Growth Rate Forecast (2019-2024) Figure Middle East & Africa Market Value ($) and Growth Rate Forecast (2019-2024) Table Middle East & Africa Consumption and Growth Rate Forecast (2019-2024) Figure India Market Value ($) and Growth Rate Forecast (2019-2024) Table India Consumption and Growth Rate Forecast (2019-2024) Figure South America Market Value ($) and Growth Rate Forecast (2019-2024) Table South America Consumption and Growth Rate Forecast (2019-2024) Figure Industry Resource/Technology/Labor Importance Analysis Table New Entrants SWOT Analysis Table New Project Analysis of Investment Recovery
Inquiry For Buying
Passive And Interconnecting Electronic Components
Request Sample
Passive And Interconnecting Electronic Components