Passive Components Market Size, Share, and Trends Analysis Report
CAGR :

| Market Size 2024 (Base Year) | USD 30.26 Billion |
| Market Size 2032 (Forecast Year) | USD 44.37 Billion |
| CAGR | 4.9% |
| Forecast Period | 2025 - 2032 |
| Historical Period | 2020 - 2024 |
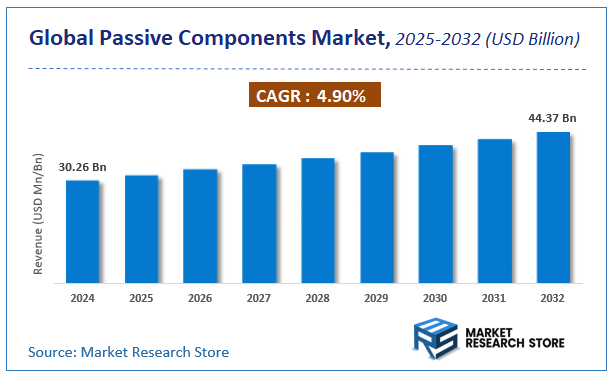
According to a recent study by Market Research Store, the global passive components market size was valued at approximately USD 30.26 Billion in 2024. The market is projected to grow significantly, reaching USD 44.37 Billion by 2032, growing at a compound annual growth rate (CAGR) of 4.9% during the forecast period from 2024 to 2032. The report highlights key growth drivers such as rising demand, technological advancements, and expanding applications. It also outlines potential challenges like regulatory changes and market competition, while emphasizing emerging opportunities for innovation and investment in the passive components industry.
To Get more Insights, Request a Free Sample
Passive Components Market: Overview
The growth of the passive components market is fueled by rising global demand across various industries and applications. The report highlights lucrative opportunities, analyzing cost structures, key segments, emerging trends, regional dynamics, and advancements by leading players to provide comprehensive market insights. The passive components market report offers a detailed industry analysis from 2024 to 2032, combining quantitative and qualitative insights. It examines key factors such as pricing, market penetration, GDP impact, industry dynamics, major players, consumer behavior, and socio-economic conditions. Structured into multiple sections, the report provides a comprehensive perspective on the market from all angles.
Key sections of the passive components market report include market segments, outlook, competitive landscape, and company profiles. Market Segments offer in-depth details based on Products, Applications, and other relevant classifications to support strategic marketing initiatives. Market Outlook thoroughly analyzes market trends, growth drivers, restraints, opportunities, challenges, Porter’s Five Forces framework, macroeconomic factors, value chain analysis, and pricing trends shaping the market now and in the future. The Competitive Landscape and Company Profiles section highlights major players, their strategies, and market positioning to guide investment and business decisions. The report also identifies innovation trends, new business opportunities, and investment prospects for the forecast period.
Key Highlights:
- As per the analysis shared by our research analyst, the global passive components market is estimated to grow annually at a CAGR of around 4.9% over the forecast period (2025-2032).
- In terms of revenue, the global passive components market size was valued at around USD 30.26 Billion in 2024 and is projected to reach USD 44.37 Billion by 2032.
- The market is projected to grow at a significant rate due to Rising demand for electronic devices, increasing adoption of IoT and automotive electronics, and growing need for high-reliability components are driving the Passive Components market.
- Based on the Products, the Capacitor segment is growing at a high rate and will continue to dominate the global market as per industry projections.
- On the basis of Applications, the Telecom segment is anticipated to command the largest market share.
- Based on region, Asia Pacific is projected to dominate the global market during the forecast period.
Passive Components Market: Report Scope
This report thoroughly analyzes the passive components market, exploring its historical trends, current state, and future projections. The market estimates presented result from a robust research methodology, incorporating primary research, secondary sources, and expert opinions. These estimates are influenced by the prevailing market dynamics as well as key economic, social, and political factors. Furthermore, the report considers the impact of regulations, government expenditures, and advancements in research and development on the market. Both positive and negative shifts are evaluated to ensure a comprehensive and accurate market outlook.
| Report Attributes | Report Details |
|---|---|
| Report Name | Passive Components Market |
| Market Size in 2024 | USD 30.26 Billion |
| Market Forecast in 2032 | USD 44.37 Billion |
| Growth Rate | CAGR of 4.9% |
| Number of Pages | 230 |
| Key Companies Covered | Yageo Corp., Murata Manufacturing Co. Ltd., KEMET Corp., KOA Corp., Panasonic Corp., FENGHUA (H.K.) Electronics Ltd., Nichicon Corp., Vishay Intertechnology Inc., Samsung Electro-Mechanics Co. Ltd., Taiyo Yuden Co. Ltd., Kyocera Corp., Nippon Chemi-Con Corp., TDK Corp., Rubycon Corp., AVX, Lelon Electronics Corp |
| Segments Covered | By Products, By Applications, and By Region |
| Regions Covered | North America, Europe, Asia Pacific (APAC), Latin America, The Middle East and Africa (MEA) |
| Base Year | 2024 |
| Historical Year | 2020 to 2024 |
| Forecast Year | 2025 to 2032 |
| Customization Scope | Avail customized purchase options to meet your exact research needs. Request For Customization |
Passive Components Market: Dynamics
Key Growth Drivers :
The Passive Components market is experiencing robust growth driven by the pervasive expansion of the electronics industry across virtually all sectors. A primary driver is the relentless demand for electronic devices, including smartphones, laptops, wearables, and IoT devices, all of which heavily rely on capacitors, resistors, inductors, and other passive components for their fundamental operation. The global rollout of 5G technology, which requires a massive deployment of infrastructure and new consumer devices, significantly boosts the demand for high-performance and miniaturized passive components. Furthermore, the burgeoning automotive electronics market, fueled by advancements in electric vehicles (EVs), autonomous driving systems (ADAS), and in-car infotainment, necessitates a vast array of reliable and robust passive components capable of operating in demanding environments. The increasing adoption of cloud computing, data centers, and advanced industrial automation also contributes to market growth by driving the need for efficient power management and signal integrity.
Restraints :
Despite the strong growth drivers, the Passive Components market faces several notable restraints. Intense price competition, particularly in the commoditized segments of standard resistors and capacitors, exerts downward pressure on profit margins for manufacturers. This makes differentiation challenging and often leads to an emphasis on cost efficiency rather than innovation for basic components. The cyclical nature of the electronics industry, characterized by periods of rapid growth followed by inventory corrections and market slowdowns, can lead to volatility in demand and revenue for passive component manufacturers. Furthermore, the increasing miniaturization trend, while driving innovation, also presents manufacturing challenges. Producing ultra-small components with high precision and consistent quality requires advanced fabrication techniques and significant capital investment, which can be a barrier for some players. Supply chain disruptions, as evidenced by recent global events, can also severely impact the availability of raw materials and finished components, leading to shortages and price fluctuations.
Opportunities :
The Passive Components market presents numerous opportunities for innovation and expansion. The continuous development of advanced materials, such as high-k dielectrics for capacitors or novel magnetic materials for inductors, enables the creation of components with improved performance characteristics, higher power densities, and smaller form factors. Opportunities exist in developing specialized passive components for emerging high-growth applications, including medical implants, space electronics, and high-frequency communication systems, where standard components may not suffice. The growing demand for robust and reliable passive components in harsh environments, such as industrial control systems, military applications, and renewable energy infrastructure (e.g., solar inverters, wind turbine controls), drives innovation in component design and packaging. Furthermore, the integration of passive components into integrated modules or systems-in-package (SiP) solutions offers opportunities for higher functionality, reduced board space, and simplified assembly for end-users. The increasing focus on energy efficiency also drives demand for low-loss and high-efficiency passive components.
Challenges :
The Passive Components market is confronted with several critical challenges that require strategic navigation. Managing complex global supply chains, from sourcing raw materials to manufacturing and distribution, is a continuous challenge, particularly given geopolitical tensions and potential trade disputes. Ensuring consistent quality and reliability across billions of components, often produced in high volumes, is paramount, as even minor defects can impact the performance of end electronic devices. The rapid pace of technological obsolescence in the electronics industry means that passive component manufacturers must constantly innovate and adapt their product portfolios to meet evolving design requirements and standards, which demands significant R&D investment. Furthermore, the need for environmental compliance, including regulations on hazardous substances (e.g., RoHS, REACH), and increasing pressure for sustainable manufacturing practices, adds complexity and cost to production processes. Counterfeit components also pose a threat, impacting product reliability and brand reputation.
Passive Components Market: Segmentation Insights
The global passive components market is segmented based on Products, Applications, and Region. All the segments of the passive components market have been analyzed based on present & future trends and the market is estimated from 2024 to 2032.
Based on Products, the global passive components market is divided into Capacitor, Resistor, Inductor.
On the basis of Applications, the global passive components market is bifurcated into Telecom, Consumer Electronics, Industrial Machinery, Automotive, Others.
Passive Components Market: Regional Insights
The Asia-Pacific region dominates the global passive components market, accounting for the largest revenue share, estimated at over 60% as of 2023. This commanding position is fueled by the region's status as the world's electronics manufacturing hub, led by China, Japan, South Korea, and Taiwan. Key drivers include massive production volumes for consumer electronics, automotive electronics, and telecommunications infrastructure, coupled with the presence of leading component manufacturers and robust supply chain networks. While North America and Europe remain critical markets for high-reliability components in aerospace and defense, the growth and scale of Asia-Pacific's manufacturing sector solidify its position as the central force in this market.
Passive Components Market: Competitive Landscape
The passive components market report offers a thorough analysis of both established and emerging players within the market. It includes a detailed list of key companies, categorized based on the types of products they offer and other relevant factors. The report also highlights the market entry year for each player, providing further context for the research analysis.
The "Global Passive Components Market" study offers valuable insights, focusing on the global market landscape, with an emphasis on major industry players such as;
- Yageo Corp.
- Murata Manufacturing Co. Ltd.
- KEMET Corp.
- KOA Corp.
- Panasonic Corp.
- FENGHUA (H.K.) Electronics Ltd.
- Nichicon Corp.
- Vishay Intertechnology Inc.
- Samsung Electro-Mechanics Co. Ltd.
- Taiyo Yuden Co. Ltd.
- Kyocera Corp.
- Nippon Chemi-Con Corp.
- TDK Corp.
- Rubycon Corp.
- AVX
- Lelon Electronics Corp
The Global Passive Components Market is Segmented as Follows:
By Products
- Capacitor
- Resistor
- Inductor
By Applications
- Telecom
- Consumer Electronics
- Industrial Machinery
- Automotive
- Others
By Region
- North America
- The U.S.
- Canada
- Mexico
- Europe
- France
- The UK
- Spain
- Germany
- Italy
- Rest of Europe
- Asia Pacific
- China
- Japan
- India
- Australia
- South Korea
- Rest of Asia Pacific
- The Middle East & Africa
- Saudi Arabia
- UAE
- Egypt
- Kuwait
- South Africa
- Rest of the Middle East & Africa
- Latin America
- Brazil
- Argentina
- Rest of Latin America
Frequently Asked Questions
Table Of Content
Global Passive Components Industry Market Research Report 1 Passive Components Introduction and Market Overview 1.1 Objectives of the Study 1.2 Definition of Passive Components 1.3 Passive Components Market Scope and Market Size Estimation 1.3.1 Market Concentration Ratio and Market Maturity Analysis 1.3.2 Global Passive Components Value ($) and Growth Rate from 2014-2024 1.4 Market Segmentation 1.4.1 Types of Passive Components 1.4.2 Applications of Passive Components 1.4.3 Research Regions 1.4.3.1 North America Passive Components Production Value ($) and Growth Rate (2014-2019) 1.4.3.2 Europe Passive Components Production Value ($) and Growth Rate (2014-2019) 1.4.3.3 China Passive Components Production Value ($) and Growth Rate (2014-2019) 1.4.3.4 Japan Passive Components Production Value ($) and Growth Rate (2014-2019) 1.4.3.5 Middle East & Africa Passive Components Production Value ($) and Growth Rate (2014-2019) 1.4.3.6 India Passive Components Production Value ($) and Growth Rate (2014-2019) 1.4.3.7 South America Passive Components Production Value ($) and Growth Rate (2014-2019) 1.5 Market Dynamics 1.5.1 Drivers 1.5.1.1 Emerging Countries of Passive Components 1.5.1.2 Growing Market of Passive Components 1.5.2 Limitations 1.5.3 Opportunities 1.6 Industry News and Policies by Regions 1.6.1 Industry News 1.6.2 Industry Policies 2 Industry Chain Analysis 2.1 Upstream Raw Material Suppliers of Passive Components Analysis 2.2 Major Players of Passive Components 2.2.1 Major Players Manufacturing Base and Market Share of Passive Components in 2018 2.2.2 Major Players Product Types in 2018 2.3 Passive Components Manufacturing Cost Structure Analysis 2.3.1 Production Process Analysis 2.3.2 Manufacturing Cost Structure of Passive Components 2.3.3 Raw Material Cost of Passive Components 2.3.4 Labor Cost of Passive Components 2.4 Market Channel Analysis of Passive Components 2.5 Major Downstream Buyers of Passive Components Analysis 3 Global Passive Components Market, by Type 3.1 Global Passive Components Value ($) and Market Share by Type (2014-2019) 3.2 Global Passive Components Production and Market Share by Type (2014-2019) 3.3 Global Passive Components Value ($) and Growth Rate by Type (2014-2019) 3.4 Global Passive Components Price Analysis by Type (2014-2019) 4 Passive Components Market, by Application 4.1 Global Passive Components Consumption and Market Share by Application (2014-2019) 4.2 Downstream Buyers by Application 4.3 Global Passive Components Consumption and Growth Rate by Application (2014-2019) 5 Global Passive Components Production, Value ($) by Region (2014-2019) 5.1 Global Passive Components Value ($) and Market Share by Region (2014-2019) 5.2 Global Passive Components Production and Market Share by Region (2014-2019) 5.3 Global Passive Components Production, Value ($), Price and Gross Margin (2014-2019) 5.4 North America Passive Components Production, Value ($), Price and Gross Margin (2014-2019) 5.5 Europe Passive Components Production, Value ($), Price and Gross Margin (2014-2019) 5.6 China Passive Components Production, Value ($), Price and Gross Margin (2014-2019) 5.7 Japan Passive Components Production, Value ($), Price and Gross Margin (2014-2019) 5.8 Middle East & Africa Passive Components Production, Value ($), Price and Gross Margin (2014-2019) 5.9 India Passive Components Production, Value ($), Price and Gross Margin (2014-2019) 5.10 South America Passive Components Production, Value ($), Price and Gross Margin (2014-2019) 6 Global Passive Components Production, Consumption, Export, Import by Regions (2014-2019) 6.1 Global Passive Components Consumption by Regions (2014-2019) 6.2 North America Passive Components Production, Consumption, Export, Import (2014-2019) 6.3 Europe Passive Components Production, Consumption, Export, Import (2014-2019) 6.4 China Passive Components Production, Consumption, Export, Import (2014-2019) 6.5 Japan Passive Components Production, Consumption, Export, Import (2014-2019) 6.6 Middle East & Africa Passive Components Production, Consumption, Export, Import (2014-2019) 6.7 India Passive Components Production, Consumption, Export, Import (2014-2019) 6.8 South America Passive Components Production, Consumption, Export, Import (2014-2019) 7 Global Passive Components Market Status and SWOT Analysis by Regions 7.1 North America Passive Components Market Status and SWOT Analysis 7.2 Europe Passive Components Market Status and SWOT Analysis 7.3 China Passive Components Market Status and SWOT Analysis 7.4 Japan Passive Components Market Status and SWOT Analysis 7.5 Middle East & Africa Passive Components Market Status and SWOT Analysis 7.6 India Passive Components Market Status and SWOT Analysis 7.7 South America Passive Components Market Status and SWOT Analysis 8 Competitive Landscape 8.1 Competitive Profile 8.2 Yageo Corp. 8.2.1 Company Profiles 8.2.2 Passive Components Product Introduction 8.2.3 Yageo Corp. Production, Value ($), Price, Gross Margin 2014-2019 8.2.4 Yageo Corp. Market Share of Passive Components Segmented by Region in 2018 8.3 Murata Manufacturing Co. Ltd. 8.3.1 Company Profiles 8.3.2 Passive Components Product Introduction 8.3.3 Murata Manufacturing Co. Ltd. Production, Value ($), Price, Gross Margin 2014-2019 8.3.4 Murata Manufacturing Co. Ltd. Market Share of Passive Components Segmented by Region in 2018 8.4 KEMET Corp. 8.4.1 Company Profiles 8.4.2 Passive Components Product Introduction 8.4.3 KEMET Corp. Production, Value ($), Price, Gross Margin 2014-2019 8.4.4 KEMET Corp. Market Share of Passive Components Segmented by Region in 2018 8.5 KOA Corp. 8.5.1 Company Profiles 8.5.2 Passive Components Product Introduction 8.5.3 KOA Corp. Production, Value ($), Price, Gross Margin 2014-2019 8.5.4 KOA Corp. Market Share of Passive Components Segmented by Region in 2018 8.6 Panasonic Corp. 8.6.1 Company Profiles 8.6.2 Passive Components Product Introduction 8.6.3 Panasonic Corp. Production, Value ($), Price, Gross Margin 2014-2019 8.6.4 Panasonic Corp. Market Share of Passive Components Segmented by Region in 2018 8.7 FENGHUA (H.K.) Electronics Ltd. 8.7.1 Company Profiles 8.7.2 Passive Components Product Introduction 8.7.3 FENGHUA (H.K.) Electronics Ltd. Production, Value ($), Price, Gross Margin 2014-2019 8.7.4 FENGHUA (H.K.) Electronics Ltd. Market Share of Passive Components Segmented by Region in 2018 8.8 Nichicon Corp. 8.8.1 Company Profiles 8.8.2 Passive Components Product Introduction 8.8.3 Nichicon Corp. Production, Value ($), Price, Gross Margin 2014-2019 8.8.4 Nichicon Corp. Market Share of Passive Components Segmented by Region in 2018 8.9 Vishay Intertechnology Inc. 8.9.1 Company Profiles 8.9.2 Passive Components Product Introduction 8.9.3 Vishay Intertechnology Inc. Production, Value ($), Price, Gross Margin 2014-2019 8.9.4 Vishay Intertechnology Inc. Market Share of Passive Components Segmented by Region in 2018 8.10 Samsung Electro-Mechanics Co. Ltd. 8.10.1 Company Profiles 8.10.2 Passive Components Product Introduction 8.10.3 Samsung Electro-Mechanics Co. Ltd. Production, Value ($), Price, Gross Margin 2014-2019 8.10.4 Samsung Electro-Mechanics Co. Ltd. Market Share of Passive Components Segmented by Region in 2018 8.11 Taiyo Yuden Co. Ltd. 8.11.1 Company Profiles 8.11.2 Passive Components Product Introduction 8.11.3 Taiyo Yuden Co. Ltd. Production, Value ($), Price, Gross Margin 2014-2019 8.11.4 Taiyo Yuden Co. Ltd. Market Share of Passive Components Segmented by Region in 2018 8.12 Kyocera Corp. 8.12.1 Company Profiles 8.12.2 Passive Components Product Introduction 8.12.3 Kyocera Corp. Production, Value ($), Price, Gross Margin 2014-2019 8.12.4 Kyocera Corp. Market Share of Passive Components Segmented by Region in 2018 8.13 Nippon Chemi-Con Corp. 8.13.1 Company Profiles 8.13.2 Passive Components Product Introduction 8.13.3 Nippon Chemi-Con Corp. Production, Value ($), Price, Gross Margin 2014-2019 8.13.4 Nippon Chemi-Con Corp. Market Share of Passive Components Segmented by Region in 2018 8.14 TDK Corp. 8.14.1 Company Profiles 8.14.2 Passive Components Product Introduction 8.14.3 TDK Corp. Production, Value ($), Price, Gross Margin 2014-2019 8.14.4 TDK Corp. Market Share of Passive Components Segmented by Region in 2018 8.15 Rubycon Corp. 8.15.1 Company Profiles 8.15.2 Passive Components Product Introduction 8.15.3 Rubycon Corp. Production, Value ($), Price, Gross Margin 2014-2019 8.15.4 Rubycon Corp. Market Share of Passive Components Segmented by Region in 2018 8.16 AVX 8.16.1 Company Profiles 8.16.2 Passive Components Product Introduction 8.16.3 AVX Production, Value ($), Price, Gross Margin 2014-2019 8.16.4 AVX Market Share of Passive Components Segmented by Region in 2018 8.17 Lelon Electronics Corp. 9 Global Passive Components Market Analysis and Forecast by Type and Application 9.1 Global Passive Components Market Value ($) & Volume Forecast, by Type (2019-2024) 9.1.1 Capacitor Market Value ($) and Volume Forecast (2019-2024) 9.1.2 Resistor Market Value ($) and Volume Forecast (2019-2024) 9.1.3 Inductor Market Value ($) and Volume Forecast (2019-2024) 9.2 Global Passive Components Market Value ($) & Volume Forecast, by Application (2019-2024) 9.2.1 Telecom Market Value ($) and Volume Forecast (2019-2024) 9.2.2 Consumer Electronics Market Value ($) and Volume Forecast (2019-2024) 9.2.3 Industrial Machinery Market Value ($) and Volume Forecast (2019-2024) 9.2.4 Automotive Market Value ($) and Volume Forecast (2019-2024) 9.2.5 Others Market Value ($) and Volume Forecast (2019-2024) 10 Passive Components Market Analysis and Forecast by Region 10.1 North America Market Value ($) and Consumption Forecast (2019-2024) 10.2 Europe Market Value ($) and Consumption Forecast (2019-2024) 10.3 China Market Value ($) and Consumption Forecast (2019-2024) 10.4 Japan Market Value ($) and Consumption Forecast (2019-2024) 10.5 Middle East & Africa Market Value ($) and Consumption Forecast (2019-2024) 10.6 India Market Value ($) and Consumption Forecast (2019-2024) 10.7 South America Market Value ($) and Consumption Forecast (2019-2024) 11 New Project Feasibility Analysis 11.1 Industry Barriers and New Entrants SWOT Analysis 11.2 Analysis and Suggestions on New Project Investment 12 Research Finding and Conclusion 13 Appendix 13.1 Discussion Guide 13.2 Knowledge Store: Maia Subscription Portal 13.3 Research Data Source 13.4 Research Assumptions and Acronyms Used
Inquiry For Buying
Passive Components
Request Sample
Passive Components