Peanut Seed Market Size, Share, and Trends Analysis Report
CAGR :

| Market Size 2023 (Base Year) | USD 3.32 Billion |
| Market Size 2032 (Forecast Year) | USD 5.42 Billion |
| CAGR | 5.6% |
| Forecast Period | 2024 - 2032 |
| Historical Period | 2018 - 2023 |
Peanut Seed Market Insights
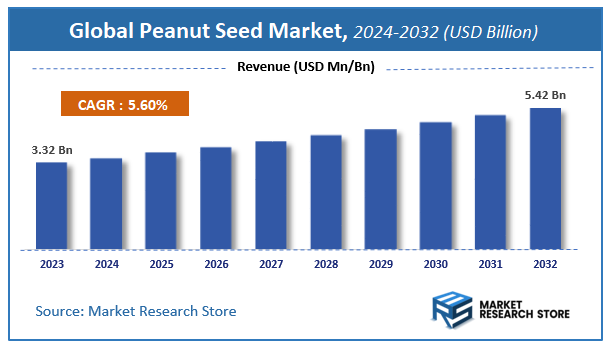
A latest report by Market Research Store estimates that the Global Peanut Seed Market was valued at USD 3.32 Billion in 2023 and is expected to reach USD 5.42 Billion by 2032, with a CAGR of 5.6% during the forecast period 2024-2032. The report Peanut Seed Market overview, growth factors, restraints, opportunities, segmentation, key developments, competitive landscape, consumer insights, and market growth forecast in terms of value or volume. These structured details offer an all-inclusive market overview, providing valuable insights for investment decisions, business decisions, strategic planning, and competitive analysis.
To Get more Insights, Request a Free Sample
Peanut Seed Market: Overview
The growth of the peanut seed market is fueled by rising global demand across various industries and applications. The report highlights lucrative opportunities, analyzing cost structures, key segments, emerging trends, regional dynamics, and advancements by leading players to provide comprehensive market insights. The peanut seed market report offers a detailed industry analysis from 2024 to 2032, combining quantitative and qualitative insights. It examines key factors such as pricing, market penetration, GDP impact, industry dynamics, major players, consumer behavior, and socio-economic conditions. Structured into multiple sections, the report provides a comprehensive perspective on the market from all angles.
Key sections of the peanut seed market report include market segments, outlook, competitive landscape, and company profiles. Market Segments offer in-depth details based on Product Type, Technology, Application, End-User, Distribution Channel, and other relevant classifications to support strategic marketing initiatives. Market Outlook thoroughly analyzes market trends, growth drivers, restraints, opportunities, challenges, Porter’s Five Forces framework, macroeconomic factors, value chain analysis, and pricing trends shaping the market now and in the future. The Competitive Landscape and Company Profiles section highlights major players, their strategies, and market positioning to guide investment and business decisions. The report also identifies innovation trends, new business opportunities, and investment prospects for the forecast period.
Key Highlights:
- As per the analysis shared by our research analyst, the global peanut seed market is estimated to grow annually at a CAGR of around 5.6% over the forecast period (2024-2032).
- In terms of revenue, the global peanut seed market size was valued at around USD 3.32 Billion in 2023 and is projected to reach USD 5.42 Billion by 2032.
- The market is projected to grow at a significant rate due to rising peanut consumption in food and oil industries, increasing demand for high-yield and disease-resistant varieties, expanding agricultural practices, and government support for oilseed crop production.
- Based on the Product Type, the Activated Carbon Filters segment is growing at a high rate and will continue to dominate the global market as per industry projections.
- On the basis of Technology, the Membrane Filtration segment is anticipated to command the largest market share.
- In terms of Application, the Residential segment is projected to lead the global market.
- By End-User, the Households segment is predicted to dominate the global market.
- Based on the Distribution Channel, the Online Retail segment is expected to swipe the largest market share.
- Based on region, Asia-Pacific is projected to dominate the global market during the forecast period.
Peanut Seed Market: Report Scope
This report thoroughly analyzes the peanut seed market, exploring its historical trends, current state, and future projections. The market estimates presented result from a robust research methodology, incorporating primary research, secondary sources, and expert opinions. These estimates are influenced by the prevailing market dynamics as well as key economic, social, and political factors. Furthermore, the report considers the impact of regulations, government expenditures, and advancements in research and development on the market. Both positive and negative shifts are evaluated to ensure a comprehensive and accurate market outlook.
| Report Attributes | Report Details |
|---|---|
| Report Name | Peanut Seed Market |
| Market Size in 2023 | USD 3.32 Billion |
| Market Forecast in 2032 | USD 5.42 Billion |
| Growth Rate | CAGR of 5.6% |
| Number of Pages | 189 |
| Key Companies Covered | Syngenta, Monsanto, Yuyan Seed, OSC Seeds |
| Segments Covered | By Product Type, By Technology, By Application, By End-User, By Distribution Channel, and By Region |
| Regions Covered | North America, Europe, Asia Pacific (APAC), Latin America, Middle East, and Africa (MEA) |
| Base Year | 2023 |
| Historical Year | 2018 to 2023 |
| Forecast Year | 2024 to 2032 |
| Customization Scope | Avail customized purchase options to meet your exact research needs. Request For Customization |
Peanut Seed Market: Dynamics
Key Growth Drivers:
The peanut seed market is experiencing steady growth, primarily driven by the increasing global demand for peanut-based products, including edible oils, snacks, and food ingredients. The growing awareness of the nutritional benefits of peanuts, rich in protein, healthy fats, and vitamins, further fuels market expansion. The rising popularity of plant-based diets and the use of peanut-based alternatives in food processing contributes to increased seed demand. Additionally, government initiatives supporting agricultural diversification and promoting oilseed cultivation in various regions are boosting market growth.
Restraints:
Despite the market's positive trajectory, several restraints impede its full potential. The susceptibility of peanut crops to various diseases and pests, such as aflatoxin contamination and soilborne pathogens, poses significant challenges. The dependence on favorable weather conditions and the vulnerability of peanut crops to drought and extreme temperatures can lead to yield fluctuations. The limited availability of high-quality peanut seeds, particularly in developing countries, restricts production and market expansion. Furthermore, the high cost of certified seeds and advanced farming inputs can deter small-scale farmers. The competition from other oilseed crops and the volatility of peanut prices can also impact market stability.
Opportunities:
The peanut seed market presents numerous opportunities for innovation and expansion. The development of disease-resistant and high-yielding peanut seed varieties, utilizing advanced breeding technologies, can enhance crop productivity. The integration of precision agriculture techniques, such as soil mapping and remote sensing, can optimize seed planting and crop management. The growing demand for organic and non-GMO peanut seeds offers niche market segments. The expansion of peanut seed applications in emerging markets, where peanut consumption and processing are rapidly increasing, provides new market opportunities. Furthermore, the development of value-added peanut seed products, such as pre-treated seeds and seed coatings, can enhance seed performance and reduce input costs.
Challenges:
The peanut seed market faces several challenges that require strategic solutions. Ensuring the quality and purity of peanut seeds, particularly in the face of diverse seed sources and growing conditions, is crucial. Maintaining consistent seed availability and affordability for farmers, especially smallholders, is essential. Adapting to the evolving needs and preferences of peanut processors and consumers, including the demand for specific seed varieties and oil profiles, necessitates continuous seed breeding and development. Managing the environmental impact of peanut seed production and ensuring sustainable farming practices is critical. Additionally, navigating the fragmented regulatory landscape and ensuring compliance with seed certification and trade regulations across different regions can be challenging.
Peanut Seed Market: Segmentation Insights
The global peanut seed market is segmented based on Product Type, Technology, Application, End-User, Distribution Channel, and Region. All the segments of the peanut seed market have been analyzed based on present & future trends and the market is estimated from 2024 to 2032.
Based on Product Type, the global peanut seed market is divided into Activated Carbon Filters, UV Water Purifiers, Reverse Osmosis Systems, Combination Systems, Gravity-Based Water Purifiers, Others.
On the basis of Technology, the global peanut seed market is bifurcated into Membrane Filtration, Ultraviolet (UV) Radiation, Electrodeionization, Filtration Systems, Nanofiltration, Others.
In terms of Application, the global peanut seed market is categorized into Residential, Commercial, Industrial, Agricultural, Municipal, Emergency and Disaster Relief.
Based on End-User, the global peanut seed market is split into Households, Schools and Educational Institutes, Healthcare Facilities, Food and Beverage Industry, Hotels and Restaurants, Others.
By Distribution Channel, the global peanut seed market is divided into Online Retail, Offline Retail, Direct Sales, Distributors and Wholesalers, Third-Party E-commerce Platforms, Others.
Peanut Seed Market: Regional Insights
The global peanut seed market is dominated by the Asia-Pacific region, which holds the largest market share due to high production and consumption in countries like China, India, and Indonesia. China is the world's leading peanut producer, accounting for over 35% of global output, driven by favorable climatic conditions and extensive agricultural land. India follows closely, with increasing demand for peanut oil and snacks boosting seed market growth.
North America and Africa are also significant players, with the U.S. and Nigeria being key producers. However, Asia-Pacific's dominance is reinforced by rising food demand, population growth, and government support for agricultural advancements. The region is expected to maintain its lead due to expanding cultivation and technological improvements in seed quality.
Peanut Seed Market: Competitive Landscape
The peanut seed market Report offers a thorough analysis of both established and emerging players within the market. It includes a detailed list of key companies, categorized based on the types of products they offer and other relevant factors. The report also highlights the market entry year for each player, providing further context for the research analysis.
The "Global Peanut Seed Market" study offers valuable insights, focusing on the global market landscape, with an emphasis on major industry players such as;
- Syngenta
- Monsanto
- Yuyan Seed
- OSC Seeds
The Global Peanut Seed Market is Segmented as Follows:
By Product Type
- Activated Carbon Filters
- UV Water Purifiers
- Reverse Osmosis Systems
- Combination Systems
- Gravity-Based Water Purifiers
- Others
By Technology
- Membrane Filtration
- Ultraviolet (UV) Radiation
- Electrodeionization
- Filtration Systems
- Nanofiltration
- Others
By Application
- Residential
- Commercial
- Industrial
- Agricultural
- Municipal
- Emergency and Disaster Relief
By End-User
- Households
- Schools and Educational Institutes
- Healthcare Facilities
- Food and Beverage Industry
- Hotels and Restaurants
- Others
By Distribution Channel
- Online Retail
- Offline Retail
- Direct Sales
- Distributors and Wholesalers
- Third-Party E-commerce Platforms
- Others
By Region
- North America
- The U.S.
- Canada
- Mexico
- Europe
- France
- The UK
- Spain
- Germany
- Italy
- Rest of Europe
- Asia Pacific
- China
- Japan
- India
- Australia
- South Korea
- Rest of Asia Pacific
- The Middle East & Africa
- Saudi Arabia
- UAE
- Egypt
- Kuwait
- South Africa
- Rest of the Middle East & Africa
- Latin America
- Brazil
- Argentina
- Rest of Latin America
Market Evolution
This section evaluates the market position of the product or service by examining its development pathway and competitive dynamics. It provides a detailed overview of the product's growth stages, including the early (historical) phase, the mid-stage, and anticipated future advancements influenced by innovation and emerging technologies.
Porter’s Analysis
Porter’s Five Forces framework offers a strategic lens for assessing competitor behavior and the positioning of key players in the peanut seed industry. This section explores the external factors shaping competitive dynamics and influencing market strategies in the years ahead. The analysis focuses on five critical forces:
- Competitive Rivalry
- Threat of New Entrants
- Threat of Substitutes
- Supplier Bargaining Power
- Buyer Bargaining Power
Value Chain & Market Attractiveness Analysis
The value chain analysis helps businesses optimize operations by mapping the product flow from suppliers to end consumers, identifying opportunities to streamline processes and gain a competitive edge. Segment-wise market attractiveness analysis evaluates key dimensions like product categories, demographics, and regions, assessing growth potential, market size, and profitability. This enables businesses to focus resources on high-potential segments for better ROI and long-term value.
PESTEL Analysis
PESTEL analysis is a powerful tool in market research reports that enhances market understanding by systematically examining the external macro-environmental factors influencing a business or industry. The acronym stands for Political, Economic, Social, Technological, Environmental, and Legal factors. By evaluating these dimensions, PESTEL analysis provides a comprehensive overview of the broader context within which a market operates, helping businesses identify potential opportunities and threats.
- Political factors assess government policies, stability, trade regulations, and political risks that could impact market operations.
- Economic factors examine variables like inflation, exchange rates, economic growth, and consumer spending power to determine market viability.
- Social factors explore cultural trends, demographics, and lifestyle changes that shape consumer behavior and preferences.
- Technological factors evaluate innovation, R&D, and technological advancements affecting product development and operational efficiencies.
- Environmental factors focus on sustainability, climate change impacts, and eco-friendly practices shaping market trends.
- Legal factors address compliance requirements, industry regulations, and intellectual property laws impacting market entry and operations.
Import-Export Analysis & Pricing Analysis
An import-export analysis is vital for market research, revealing global trade dynamics, trends, and opportunities. It examines trade volumes, product categories, and regional competitiveness, offering insights into supply chains and market demand. This section also analyzes past and future pricing trends, helping businesses optimize strategies and enabling consumers to assess product value effectively.
Peanut Seed Market: Company Profiles
The report identifies key players in the peanut seed market through a competitive landscape and company profiles, evaluating their offerings, financial performance, strategies, and market positioning. It includes a SWOT analysis of the top 3-5 companies, assessing strengths, weaknesses, opportunities, and threats. The competitive landscape highlights rankings, recent activities (mergers, acquisitions, partnerships, product launches), and regional footprints using the Ace matrix. Customization is available to meet client-specific needs.
Regional & Industry Footprint
This section details the geographic reach, sales networks, and market penetration of companies profiled in the peanut seed report, showcasing their operations and distribution across regions. It analyzes the alignment of companies with specific industry verticals, highlighting the industries they serve and the scope of their products and services within those sectors.
Ace Matrix
This section categorizes companies into four distinct groups—Active, Cutting Edge, Innovator, and Emerging—based on their product and business strategies. The evaluation of product strategy focuses on aspects such as the range and depth of offerings, commitment to innovation, product functionalities, and scalability. Key elements like global reach, sector coverage, strategic acquisitions, and long-term growth plans are considered for business strategy. This analysis provides a detailed view of companies' position within the market and highlights their potential for future growth and development.
Research Methodology
The qualitative and quantitative insights for the peanut seed market are derived through a multi-faceted research approach, combining input from subject matter experts, primary research, and secondary data sources. Primary research includes gathering critical information via face-to-face or telephonic interviews, surveys, questionnaires, and feedback from industry professionals, key opinion leaders (KOLs), and customers. Regular interviews with industry experts are conducted to deepen the analysis and reinforce the existing data, ensuring a robust and well-rounded market understanding.
Secondary research for this report was carried out by the Market Research Store team, drawing on a variety of authoritative sources, such as:
- Official company websites, annual reports, financial statements, investor presentations, and SEC filings
- Internal and external proprietary databases, as well as relevant patent and regulatory databases
- Government publications, national statistical databases, and industry-specific market reports
- Media coverage, including news articles, press releases, and webcasts about market participants
- Paid industry databases for detailed market insights
Market Research Store conducted in-depth consultations with various key opinion leaders in the industry, including senior executives from top companies and regional leaders from end-user organizations. This effort aimed to gather critical insights on factors such as the market share of dominant brands in specific countries and regions, along with pricing strategies for products and services.
To determine total sales data, the research team conducted primary interviews across multiple countries with influential stakeholders, including:
- Distributors
- Marketing, Brand, and Product Managers
- Procurement and Production Managers
- Sales and Regional Sales Managers, Country Managers
- Technical Specialists
- C-Level Executives
These subject matter experts, with their extensive industry experience, helped validate and refine the findings. For secondary research, data were sourced from a wide range of materials, including online resources, company annual reports, industry publications, research papers, association reports, and government websites. These various sources provide a comprehensive and well-rounded perspective on the market.
Frequently Asked Questions
Table Of Content
List of Tables and Figures Figure Product Picture of Peanut Seed Table Product Specification of Peanut Seed Figure Market Concentration Ratio and Market Maturity Analysis of Peanut Seed Figure Global Peanut Seed Value ($) and Growth Rate from 2014-2024 Table Different Types of Peanut Seed Figure Global Peanut Seed Value ($) Segment by Type from 2014-2019 Figure GMO Picture Figure non-GMO Picture Table Different Applications of Peanut Seed Figure Global Peanut Seed Value ($) Segment by Applications from 2014-2019 Figure Santific Research Picture Figure Farm Picture Figure Other Picture Table Research Regions of Peanut Seed Figure North America Peanut Seed Production Value ($) and Growth Rate (2014-2019) Figure Europe Peanut Seed Production Value ($) and Growth Rate (2014-2019) Table China Peanut Seed Production Value ($) and Growth Rate (2014-2019) Table Japan Peanut Seed Production Value ($) and Growth Rate (2014-2019) Table Middle East & Africa Peanut Seed Production Value ($) and Growth Rate (2014-2019) Table India Peanut Seed Production Value ($) and Growth Rate (2014-2019) Table South America Peanut Seed Production Value ($) and Growth Rate (2014-2019) Table Emerging Countries of Peanut Seed Table Growing Market of Peanut Seed Figure Industry Chain Analysis of Peanut Seed Table Upstream Raw Material Suppliers of Peanut Seed with Contact Information Table Major Players Manufacturing Base and Market Share ($) of Peanut Seed in 2018 Table Major Players Peanut Seed Product Types in 2018 Figure Production Process of Peanut Seed Figure Manufacturing Cost Structure of Peanut Seed Figure Channel Status of Peanut Seed Table Major Distributors of Peanut Seed with Contact Information Table Major Downstream Buyers of Peanut Seed with Contact Information Table Global Peanut Seed Value ($) by Type (2014-2019) Table Global Peanut Seed Value ($) Share by Type (2014-2019) Figure Global Peanut Seed Value ($) Share by Type (2014-2019) Table Global Peanut Seed Production by Type (2014-2019) Table Global Peanut Seed Production Share by Type (2014-2019) Figure Global Peanut Seed Production Share by Type (2014-2019) Figure Global Peanut Seed Value ($) and Growth Rate of GMO Figure Global Peanut Seed Value ($) and Growth Rate of non-GMO Figure Global Peanut Seed Price by Type (2014-2019) Table Global Peanut Seed Consumption by Application (2014-2019) Table Global Peanut Seed Consumption Market Share by Application (2014-2019) Figure Global Peanut Seed Consumption Market Share by Application (2014-2019) Table Downstream Buyers Introduction by Application Figure Global Peanut Seed Consumption and Growth Rate of Santific Research (2014-2019) Figure Global Peanut Seed Consumption and Growth Rate of Farm (2014-2019) Figure Global Peanut Seed Consumption and Growth Rate of Other (2014-2019) Table Global Peanut Seed Value ($) by Region (2014-2019) Table Global Peanut Seed Value ($) Market Share by Region (2014-2019) Figure Global Peanut Seed Value ($) Market Share by Region (2014-2019) Table Global Peanut Seed Production by Region (2014-2019) Table Global Peanut Seed Production Market Share by Region (2014-2019) Figure Global Peanut Seed Production Market Share by Region (2014-2019) Table Global Peanut Seed Production, Value ($), Price and Gross Margin (2014-2019) Table North America Peanut Seed Production, Value ($), Price and Gross Margin (2014-2019) Table Europe Peanut Seed Production, Value ($), Price and Gross Margin (2014-2019) Table China Peanut Seed Production, Value ($), Price and Gross Margin (2014-2019) Table Japan Peanut Seed Production, Value ($), Price and Gross Margin (2014-2019) Table Middle East & Africa Peanut Seed Production, Value ($), Price and Gross Margin (2014-2019) Table India Peanut Seed Production, Value ($), Price and Gross Margin (2014-2019) Table South America Peanut Seed Production, Value ($), Price and Gross Margin (2014-2019) Table Global Peanut Seed Consumption by Regions (2014-2019) Figure Global Peanut Seed Consumption Share by Regions (2014-2019) Table North America Peanut Seed Production, Consumption, Export, Import (2014-2019) Table Europe Peanut Seed Production, Consumption, Export, Import (2014-2019) Table China Peanut Seed Production, Consumption, Export, Import (2014-2019) Table Japan Peanut Seed Production, Consumption, Export, Import (2014-2019) Table Middle East & Africa Peanut Seed Production, Consumption, Export, Import (2014-2019) Table India Peanut Seed Production, Consumption, Export, Import (2014-2019) Table South America Peanut Seed Production, Consumption, Export, Import (2014-2019) Figure North America Peanut Seed Production and Growth Rate Analysis Figure North America Peanut Seed Consumption and Growth Rate Analysis Figure North America Peanut Seed SWOT Analysis Figure Europe Peanut Seed Production and Growth Rate Analysis Figure Europe Peanut Seed Consumption and Growth Rate Analysis Figure Europe Peanut Seed SWOT Analysis Figure China Peanut Seed Production and Growth Rate Analysis Figure China Peanut Seed Consumption and Growth Rate Analysis Figure China Peanut Seed SWOT Analysis Figure Japan Peanut Seed Production and Growth Rate Analysis Figure Japan Peanut Seed Consumption and Growth Rate Analysis Figure Japan Peanut Seed SWOT Analysis Figure Middle East & Africa Peanut Seed Production and Growth Rate Analysis Figure Middle East & Africa Peanut Seed Consumption and Growth Rate Analysis Figure Middle East & Africa Peanut Seed SWOT Analysis Figure India Peanut Seed Production and Growth Rate Analysis Figure India Peanut Seed Consumption and Growth Rate Analysis Figure India Peanut Seed SWOT Analysis Figure South America Peanut Seed Production and Growth Rate Analysis Figure South America Peanut Seed Consumption and Growth Rate Analysis Figure South America Peanut Seed SWOT Analysis Figure Top 3 Market Share of Peanut Seed Companies Figure Top 6 Market Share of Peanut Seed Companies Table Mergers, Acquisitions and Expansion Analysis Table Company Profiles Table Product Introduction Table Syngenta Production, Value ($), Price, Gross Margin 2014-2019 Figure Syngenta Production and Growth Rate Figure Syngenta Value ($) Market Share 2014-2019 Figure Syngenta Market Share of Peanut Seed Segmented by Region in 2018 Table Company Profiles Table Product Introduction Table OSC Seeds Production, Value ($), Price, Gross Margin 2014-2019 Figure OSC Seeds Production and Growth Rate Figure OSC Seeds Value ($) Market Share 2014-2019 Figure OSC Seeds Market Share of Peanut Seed Segmented by Region in 2018 Table Company Profiles Table Product Introduction Table Monsanto Production, Value ($), Price, Gross Margin 2014-2019 Figure Monsanto Production and Growth Rate Figure Monsanto Value ($) Market Share 2014-2019 Figure Monsanto Market Share of Peanut Seed Segmented by Region in 2018 Table Company Profiles Table Product Introduction Table Yuyan Seed Production, Value ($), Price, Gross Margin 2014-2019 Figure Yuyan Seed Production and Growth Rate Figure Yuyan Seed Value ($) Market Share 2014-2019 Figure Yuyan Seed Market Share of Peanut Seed Segmented by Region in 2018 Table Global Peanut Seed Market Value ($) Forecast, by Type Table Global Peanut Seed Market Volume Forecast, by Type Figure Global Peanut Seed Market Value ($) and Growth Rate Forecast of GMO (2019-2024) Figure Global Peanut Seed Market Volume and Growth Rate Forecast of GMO (2019-2024) Figure Global Peanut Seed Market Value ($) and Growth Rate Forecast of non-GMO (2019-2024) Figure Global Peanut Seed Market Volume and Growth Rate Forecast of non-GMO (2019-2024) Table Global Market Value ($) Forecast by Application (2019-2024) Table Global Market Volume Forecast by Application (2019-2024) Figure Global Peanut Seed Consumption and Growth Rate of Santific Research (2014-2019) Figure Global Peanut Seed Consumption and Growth Rate of Farm (2014-2019) Figure Global Peanut Seed Consumption and Growth Rate of Other (2014-2019) Figure Market Value ($) and Growth Rate Forecast of Other (2019-2024) Figure Market Volume and Growth Rate Forecast of Other (2019-2024) Figure North America Market Value ($) and Growth Rate Forecast (2019-2024) Table North America Consumption and Growth Rate Forecast (2019-2024) Figure Europe Market Value ($) and Growth Rate Forecast (2019-2024) Table Europe Consumption and Growth Rate Forecast (2019-2024) Figure China Market Value ($) and Growth Rate Forecast (2019-2024) Table China Consumption and Growth Rate Forecast (2019-2024) Figure Japan Market Value ($) and Growth Rate Forecast (2019-2024) Table Japan Consumption and Growth Rate Forecast (2019-2024) Figure Middle East & Africa Market Value ($) and Growth Rate Forecast (2019-2024) Table Middle East & Africa Consumption and Growth Rate Forecast (2019-2024) Figure India Market Value ($) and Growth Rate Forecast (2019-2024) Table India Consumption and Growth Rate Forecast (2019-2024) Figure South America Market Value ($) and Growth Rate Forecast (2019-2024) Table South America Consumption and Growth Rate Forecast (2019-2024) Figure Industry Resource/Technology/Labor Importance Analysis Table New Entrants SWOT Analysis Table New Project Analysis of Investment Recovery
Inquiry For Buying
Peanut Seed
Request Sample
Peanut Seed