Photographic Services Market Size, Share, and Trends Analysis Report
CAGR :

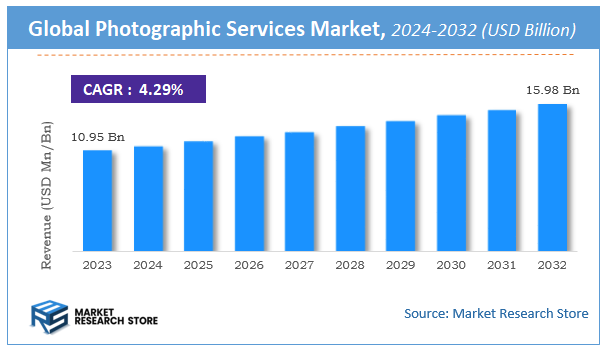
| Market Size 2023 (Base Year) | USD 10.95 Billion |
| Market Size 2032 (Forecast Year) | USD 15.98 Billion |
| CAGR | 4.29% |
| Forecast Period | 2024 - 2032 |
| Historical Period | 2018 - 2023 |
Photographic Services Market Insights
As per the published report by Market Research Store, the Global Photographic Services Market size was estimated at USD 10.95 Billion in 2023 and is anticipated to reach reach USD 15.98 Billion by 2032, growing at a projected CAGR of 4.29% during the forecast period 2024-2032. The report provides a detailed analysis of the global Photographic Services Market, including market trends, market dynamics, and market opportunities during the forecast period (2024-2032). It delves deeper into several market facets, such as market definition, size, growth, forecast, segmentation, competitive analysis, growth drivers, restraints, financial analysis, SWOT analysis, PORTER’s five force analysis, PESTEL analysis, market share analysis, cost-benefit analysis, challenges, restraints, strategic recommendations, and market players.
To Get more Insights, Request a Free Sample
Photographic Services Market: Overview
The growth of the photographic services market is fueled by rising global demand across various industries and applications. The report highlights lucrative opportunities, analyzing cost structures, key segments, emerging trends, regional dynamics, and advancements by leading players to provide comprehensive market insights. The photographic services market report offers a detailed industry analysis from 2024 to 2032, combining quantitative and qualitative insights. It examines key factors such as pricing, market penetration, GDP impact, industry dynamics, major players, consumer behavior, and socio-economic conditions. Structured into multiple sections, the report provides a comprehensive perspective on the market from all angles.
Key sections of the photographic services market report include market segments, outlook, competitive landscape, and company profiles. Market Segments offer in-depth details based on Service Type, Platform, End-User, and other relevant classifications to support strategic marketing initiatives. Market Outlook thoroughly analyzes market trends, growth drivers, restraints, opportunities, challenges, Porter’s Five Forces framework, macroeconomic factors, value chain analysis, and pricing trends shaping the market now and in the future. The Competitive Landscape and Company Profiles section highlights major players, their strategies, and market positioning to guide investment and business decisions. The report also identifies innovation trends, new business opportunities, and investment prospects for the forecast period.
Key Highlights:
- As per the analysis shared by our research analyst, the global photographic services market is estimated to grow annually at a CAGR of around 4.29% over the forecast period (2024-2032).
- In terms of revenue, the global photographic services market size was valued at around USD 10.95 Billion in 2023 and is projected to reach USD 15.98 Billion by 2032.
- The market is projected to grow at a significant rate due to rising digital content creation, increasing demand for commercial photography, and expanding social media influence.
- Based on the Service Type, the Portrait Photography segment is growing at a high rate and will continue to dominate the global market as per industry projections.
- On the basis of Platform, the Online Services segment is anticipated to command the largest market share.
- In terms of End-User, the Individuals segment is projected to lead the global market.
- Based on region, North America is projected to dominate the global market during the forecast period.
Photographic Services Market: Report Scope
This report thoroughly analyzes the photographic services market, exploring its historical trends, current state, and future projections. The market estimates presented result from a robust research methodology, incorporating primary research, secondary sources, and expert opinions. These estimates are influenced by the prevailing market dynamics as well as key economic, social, and political factors. Furthermore, the report considers the impact of regulations, government expenditures, and advancements in research and development on the market. Both positive and negative shifts are evaluated to ensure a comprehensive and accurate market outlook.
| Report Attributes | Report Details |
|---|---|
| Report Name | Photographic Services Market |
| Market Size in 2023 | USD 10.95 Billion |
| Market Forecast in 2032 | USD 15.98 Billion |
| Growth Rate | CAGR of 4.29% |
| Number of Pages | 174 |
| Key Companies Covered | Studio Alice Co Ltd, Raygun, Getty Images, Portrait Innovations, Visual China Group, Pace Photography, Photo Studio, Studio Alice, Snappr Photography, Vital, Lifetouch Inc. |
| Segments Covered | By Service Type, By Platform, By End-User, and By Region |
| Regions Covered | North America, Europe, Asia Pacific (APAC), Latin America, Middle East, and Africa (MEA) |
| Base Year | 2023 |
| Historical Year | 2018 to 2023 |
| Forecast Year | 2024 to 2032 |
| Customization Scope | Avail customized purchase options to meet your exact research needs. Request For Customization |
Photographic Services Market: Dynamics
Key Growth Drivers
The Photographic Services market in India is experiencing a dynamic evolution, primarily driven by the increasing penetration of smartphones with high-quality cameras, empowering individuals to capture everyday moments and special occasions. The growing popularity of social media platforms fuels the demand for visually appealing content, leading individuals and businesses to seek professional photography for enhanced online presence. Furthermore, the expanding e-commerce sector necessitates high-quality product photography for online listings, driving demand from retailers and businesses. The continuing tradition of capturing significant life events like weddings, birthdays, and graduations through professional photography remains a strong driver. The rising disposable incomes among a segment of the population allow for greater spending on professional photographic services for personal and commercial purposes.
Restraints
Despite the strong growth drivers, the Photographic Services market in India faces certain restraints. The accessibility and increasing quality of smartphone cameras have led to a rise in amateur photography, potentially reducing the demand for professional services for routine documentation. Price sensitivity among a significant portion of the population can make professional photography seem like an unnecessary expense, especially for smaller events or personal use. Furthermore, the proliferation of freelance photographers and the ease of setting up a small-scale photography business can lead to intense competition and price undercutting. Concerns about copyright and usage rights of professionally captured images can sometimes deter clients. The need for specialized equipment and studio spaces can represent a significant upfront investment for professional photographers.
Opportunities
The Photographic Services market in India presents numerous opportunities for photographers and businesses to innovate and expand. The growing demand for specialized photography services, such as food photography for restaurants and online platforms, real estate photography for property listings, and corporate headshots for professional branding, offers niche markets. The increasing popularity of visual storytelling for brands and businesses creates opportunities for commercial photographers to develop engaging content for marketing and advertising. Furthermore, the rise of experiential photography, such as photo booths and on-location event photography, provides new avenues for revenue generation. The integration of digital technologies, including online booking platforms, digital image delivery, and virtual photo shoots, can enhance efficiency and reach. The growing demand for stock photography from businesses and individuals also presents an opportunity for photographers to monetize their existing image libraries.
Challenges
The Photographic Services market in India faces challenges related to differentiating professional services from amateur photography and justifying the higher cost. Building a strong brand and reputation in a crowded marketplace is crucial for attracting clients. Furthermore, adapting to the rapidly evolving digital landscape and mastering new technologies for image capture, editing, and delivery is essential for staying competitive. Managing client expectations regarding pricing, turnaround time, and the final product can be demanding. Protecting intellectual property and ensuring proper compensation for image usage remains a significant challenge in the digital age. Finally, staying updated with the latest trends and styles in photography to cater to changing consumer preferences requires continuous learning and adaptation.
Photographic Services Market: Segmentation Insights
The global photographic services market is segmented based on Service Type, Platform, End-User, and Region. All the segments of the photographic services market have been analyzed based on present & future trends and the market is estimated from 2024 to 2032.
Based on Service Type, the global photographic services market is divided into Portrait Photography, Commercial Photography, Event Photography, Aerial Photography, Industrial Photography, Stock Photography.
On the basis of Platform, the global photographic services market is bifurcated into Online Services, Offline Services.
In terms of End-User, the global photographic services market is categorized into Individuals, Businesses, Government Organizations.
Photographic Services Market: Regional Insights
The Asia-Pacific (APAC) region, led by China, Japan, and India, dominates the Photographic Services Market, accounting for the largest revenue share due to rapid digitalization, booming e-commerce platforms, and increasing demand for professional photography in events, advertising, and social media. In 2023, APAC held over 38% of the global market share, driven by a growing middle class, rising disposable incomes, and the proliferation of smartphone photography. North America follows as the second-largest market, with the U.S. leading in high-value segments like wedding, commercial, and portrait photography, supported by advanced technological adoption and high spending on creative services.
Europe, particularly Germany, the UK, and France, shows steady growth, fueled by cultural events and tourism. APAC’s dominance is further reinforced by surging influencer marketing, expansion of online photo-sharing platforms, and local studios embracing AI and drone photography. The region is projected to maintain the fastest growth, driven by urbanization and digital content creation trends.
Photographic Services Market: Competitive Landscape
The photographic services market report offers a thorough analysis of both established and emerging players within the market. It includes a detailed list of key companies, categorized based on the types of products they offer and other relevant factors. The report also highlights the market entry year for each player, providing further context for the research analysis.
The "Global Photographic Services Market" study offers valuable insights, focusing on the global market landscape, with an emphasis on major industry players such as;
- Studio Alice Co Ltd
- Raygun
- Getty Images
- Portrait Innovations
- Visual China Group
- Pace Photography
- Photo Studio
- Studio Alice
- Snappr Photography
- Vital
- Lifetouch Inc.
The Global Photographic Services Market is Segmented as Follows:
By Service Type
- Portrait Photography
- Commercial Photography
- Event Photography
- Aerial Photography
- Industrial Photography
- Stock Photography
By Platform
- Online Services
- Offline Services
By End-User
- Individuals
- Businesses
- Government Organizations
By Region
- North America
- The U.S.
- Canada
- Mexico
- Europe
- France
- The UK
- Spain
- Germany
- Italy
- Rest of Europe
- Asia Pacific
- China
- Japan
- India
- Australia
- South Korea
- Rest of Asia Pacific
- The Middle East & Africa
- Saudi Arabia
- UAE
- Egypt
- Kuwait
- South Africa
- Rest of the Middle East & Africa
- Latin America
- Brazil
- Argentina
- Rest of Latin America
Market Evolution
This section evaluates the market position of the product or service by examining its development pathway and competitive dynamics. It provides a detailed overview of the product's growth stages, including the early (historical) phase, the mid-stage, and anticipated future advancements influenced by innovation and emerging technologies.
Porter’s Analysis
Porter’s Five Forces framework offers a strategic lens for assessing competitor behavior and the positioning of key players in the photographic services industry. This section explores the external factors shaping competitive dynamics and influencing market strategies in the years ahead. The analysis focuses on five critical forces:
- Competitive Rivalry
- Threat of New Entrants
- Threat of Substitutes
- Supplier Bargaining Power
- Buyer Bargaining Power
Value Chain & Market Attractiveness Analysis
The value chain analysis helps businesses optimize operations by mapping the product flow from suppliers to end consumers, identifying opportunities to streamline processes and gain a competitive edge. Segment-wise market attractiveness analysis evaluates key dimensions like product categories, demographics, and regions, assessing growth potential, market size, and profitability. This enables businesses to focus resources on high-potential segments for better ROI and long-term value.
PESTEL Analysis
PESTEL analysis is a powerful tool in market research reports that enhances market understanding by systematically examining the external macro-environmental factors influencing a business or industry. The acronym stands for Political, Economic, Social, Technological, Environmental, and Legal factors. By evaluating these dimensions, PESTEL analysis provides a comprehensive overview of the broader context within which a market operates, helping businesses identify potential opportunities and threats.
- Political factors assess government policies, stability, trade regulations, and political risks that could impact market operations.
- Economic factors examine variables like inflation, exchange rates, economic growth, and consumer spending power to determine market viability.
- Social factors explore cultural trends, demographics, and lifestyle changes that shape consumer behavior and preferences.
- Technological factors evaluate innovation, R&D, and technological advancements affecting product development and operational efficiencies.
- Environmental factors focus on sustainability, climate change impacts, and eco-friendly practices shaping market trends.
- Legal factors address compliance requirements, industry regulations, and intellectual property laws impacting market entry and operations.
Import-export Analysis & Pricing Analysis
An import-export analysis is vital for market research, revealing global trade dynamics, trends, and opportunities. It examines trade volumes, product categories, and regional competitiveness, offering insights into supply chains and market demand. This section also analyzes past and future pricing trends, helping businesses optimize strategies and enabling consumers to assess product value effectively.
Photographic Services Market: Company Profiles
The report identifies key players in the photographic services market through a competitive landscape and company profiles, evaluating their offerings, financial performance, strategies, and market positioning. It includes a SWOT analysis of the top 3-5 companies, assessing strengths, weaknesses, opportunities, and threats. The competitive landscape highlights rankings, recent activities (mergers, acquisitions, partnerships, product launches), and regional footprints using the Ace matrix. Customization is available to meet client-specific needs.
Regional & Industry Footprint
This section details the geographic reach, sales networks, and market penetration of companies profiled in the photographic services report, showcasing their operations and distribution across regions. It analyzes the alignment of companies with specific industry verticals, highlighting the industries they serve and the scope of their products and services within those sectors.
Ace Matrix
This section categorizes companies into four distinct groups—Active, Cutting Edge, Innovator, and Emerging—based on their product and business strategies. The evaluation of product strategy focuses on aspects such as the range and depth of offerings, commitment to innovation, product functionalities, and scalability. Key elements like global reach, sector coverage, strategic acquisitions, and long-term growth plans are considered for business strategy. This analysis provides a detailed view of companies' position within the market and highlights their potential for future growth and development.
Research Methodology
The qualitative and quantitative insights for the photographic services market are derived through a multi-faceted research approach, combining input from subject matter experts, primary research, and secondary data sources. Primary research includes gathering critical information via face-to-face or telephonic interviews, surveys, questionnaires, and feedback from industry professionals, key opinion leaders (KOLs), and customers. Regular interviews with industry experts are conducted to deepen the analysis and reinforce the existing data, ensuring a robust and well-rounded market understanding.
Secondary research for this report was carried out by the Market Research Store team, drawing on a variety of authoritative sources, such as:
- Official company websites, annual reports, financial statements, investor presentations, and SEC filings
- Internal and external proprietary databases, as well as relevant patent and regulatory databases
- Government publications, national statistical databases, and industry-specific market reports
- Media coverage, including news articles, press releases, and webcasts about market participants
- Paid industry databases for detailed market insights
Market Research Store conducted in-depth consultations with various key opinion leaders in the industry, including senior executives from top companies and regional leaders from end-user organizations. This effort aimed to gather critical insights on factors such as the market share of dominant brands in specific countries and regions, along with pricing strategies for products and services.
To determine total sales data, the research team conducted primary interviews across multiple countries with influential stakeholders, including:
- Distributors
- Marketing, Brand, and Product Managers
- Procurement and Production Managers
- Sales and Regional Sales Managers, Country Managers
- Technical Specialists
- C-Level Executives
These subject matter experts, with their extensive industry experience, helped validate and refine the findings. For secondary research, data was sourced from a wide range of materials, including online resources, company annual reports, industry publications, research papers, association reports, and government websites. These various sources provide a comprehensive and well-rounded perspective on the market.
Frequently Asked Questions
Table Of Content
List of Tables and Figures Figure Product Picture of Photographic Services Table Product Specification of Photographic Services Figure Market Concentration Ratio and Market Maturity Analysis of Photographic Services Figure Global Photographic Services Value ($) and Growth Rate from 2014-2024 Table Different Types of Photographic Services Figure Global Photographic Services Value ($) Segment by Type from 2014-2019 Figure School Portraits Picture Figure Architectural and Commercial Photography Picture Figure Wedding and Event Videography Picture Figure Still Life Photography Picture Table Different Applications of Photographic Services Figure Global Photographic Services Value ($) Segment by Applications from 2014-2019 Figure Personal Picture Figure Commerical Picture Table Research Regions of Photographic Services Figure North America Photographic Services Production Value ($) and Growth Rate (2014-2019) Figure Europe Photographic Services Production Value ($) and Growth Rate (2014-2019) Table China Photographic Services Production Value ($) and Growth Rate (2014-2019) Table Japan Photographic Services Production Value ($) and Growth Rate (2014-2019) Table Middle East & Africa Photographic Services Production Value ($) and Growth Rate (2014-2019) Table India Photographic Services Production Value ($) and Growth Rate (2014-2019) Table South America Photographic Services Production Value ($) and Growth Rate (2014-2019) Table Emerging Countries of Photographic Services Table Growing Market of Photographic Services Figure Industry Chain Analysis of Photographic Services Table Upstream Raw Material Suppliers of Photographic Services with Contact Information Table Major Players Manufacturing Base and Market Share ($) of Photographic Services in 2018 Table Major Players Photographic Services Product Types in 2018 Figure Production Process of Photographic Services Figure Manufacturing Cost Structure of Photographic Services Figure Channel Status of Photographic Services Table Major Distributors of Photographic Services with Contact Information Table Major Downstream Buyers of Photographic Services with Contact Information Table Global Photographic Services Value ($) by Type (2014-2019) Table Global Photographic Services Value ($) Share by Type (2014-2019) Figure Global Photographic Services Value ($) Share by Type (2014-2019) Table Global Photographic Services Production by Type (2014-2019) Table Global Photographic Services Production Share by Type (2014-2019) Figure Global Photographic Services Production Share by Type (2014-2019) Figure Global Photographic Services Value ($) and Growth Rate of School Portraits Figure Global Photographic Services Value ($) and Growth Rate of Architectural and Commercial Photography Figure Global Photographic Services Value ($) and Growth Rate of Wedding and Event Videography Figure Global Photographic Services Value ($) and Growth Rate of Still Life Photography Figure Global Photographic Services Price by Type (2014-2019) Table Global Photographic Services Consumption by Application (2014-2019) Table Global Photographic Services Consumption Market Share by Application (2014-2019) Figure Global Photographic Services Consumption Market Share by Application (2014-2019) Table Downstream Buyers Introduction by Application Figure Global Photographic Services Consumption and Growth Rate of Personal (2014-2019) Figure Global Photographic Services Consumption and Growth Rate of Commerical (2014-2019) Table Global Photographic Services Value ($) by Region (2014-2019) Table Global Photographic Services Value ($) Market Share by Region (2014-2019) Figure Global Photographic Services Value ($) Market Share by Region (2014-2019) Table Global Photographic Services Production by Region (2014-2019) Table Global Photographic Services Production Market Share by Region (2014-2019) Figure Global Photographic Services Production Market Share by Region (2014-2019) Table Global Photographic Services Production, Value ($), Price and Gross Margin (2014-2019) Table North America Photographic Services Production, Value ($), Price and Gross Margin (2014-2019) Table Europe Photographic Services Production, Value ($), Price and Gross Margin (2014-2019) Table China Photographic Services Production, Value ($), Price and Gross Margin (2014-2019) Table Japan Photographic Services Production, Value ($), Price and Gross Margin (2014-2019) Table Middle East & Africa Photographic Services Production, Value ($), Price and Gross Margin (2014-2019) Table India Photographic Services Production, Value ($), Price and Gross Margin (2014-2019) Table South America Photographic Services Production, Value ($), Price and Gross Margin (2014-2019) Table Global Photographic Services Consumption by Regions (2014-2019) Figure Global Photographic Services Consumption Share by Regions (2014-2019) Table North America Photographic Services Production, Consumption, Export, Import (2014-2019) Table Europe Photographic Services Production, Consumption, Export, Import (2014-2019) Table China Photographic Services Production, Consumption, Export, Import (2014-2019) Table Japan Photographic Services Production, Consumption, Export, Import (2014-2019) Table Middle East & Africa Photographic Services Production, Consumption, Export, Import (2014-2019) Table India Photographic Services Production, Consumption, Export, Import (2014-2019) Table South America Photographic Services Production, Consumption, Export, Import (2014-2019) Figure North America Photographic Services Production and Growth Rate Analysis Figure North America Photographic Services Consumption and Growth Rate Analysis Figure North America Photographic Services SWOT Analysis Figure Europe Photographic Services Production and Growth Rate Analysis Figure Europe Photographic Services Consumption and Growth Rate Analysis Figure Europe Photographic Services SWOT Analysis Figure China Photographic Services Production and Growth Rate Analysis Figure China Photographic Services Consumption and Growth Rate Analysis Figure China Photographic Services SWOT Analysis Figure Japan Photographic Services Production and Growth Rate Analysis Figure Japan Photographic Services Consumption and Growth Rate Analysis Figure Japan Photographic Services SWOT Analysis Figure Middle East & Africa Photographic Services Production and Growth Rate Analysis Figure Middle East & Africa Photographic Services Consumption and Growth Rate Analysis Figure Middle East & Africa Photographic Services SWOT Analysis Figure India Photographic Services Production and Growth Rate Analysis Figure India Photographic Services Consumption and Growth Rate Analysis Figure India Photographic Services SWOT Analysis Figure South America Photographic Services Production and Growth Rate Analysis Figure South America Photographic Services Consumption and Growth Rate Analysis Figure South America Photographic Services SWOT Analysis Figure Top 3 Market Share of Photographic Services Companies Figure Top 6 Market Share of Photographic Services Companies Table Mergers, Acquisitions and Expansion Analysis Table Company Profiles Table Product Introduction Table Studio Alice Co Ltd Production, Value ($), Price, Gross Margin 2014-2019 Figure Studio Alice Co Ltd Production and Growth Rate Figure Studio Alice Co Ltd Value ($) Market Share 2014-2019 Figure Studio Alice Co Ltd Market Share of Photographic Services Segmented by Region in 2018 Table Company Profiles Table Product Introduction Table Raygun Production, Value ($), Price, Gross Margin 2014-2019 Figure Raygun Production and Growth Rate Figure Raygun Value ($) Market Share 2014-2019 Figure Raygun Market Share of Photographic Services Segmented by Region in 2018 Table Company Profiles Table Product Introduction Table Getty Images Production, Value ($), Price, Gross Margin 2014-2019 Figure Getty Images Production and Growth Rate Figure Getty Images Value ($) Market Share 2014-2019 Figure Getty Images Market Share of Photographic Services Segmented by Region in 2018 Table Company Profiles Table Product Introduction Table Portrait Innovations Production, Value ($), Price, Gross Margin 2014-2019 Figure Portrait Innovations Production and Growth Rate Figure Portrait Innovations Value ($) Market Share 2014-2019 Figure Portrait Innovations Market Share of Photographic Services Segmented by Region in 2018 Table Company Profiles Table Product Introduction Table Visual China Group Production, Value ($), Price, Gross Margin 2014-2019 Figure Visual China Group Production and Growth Rate Figure Visual China Group Value ($) Market Share 2014-2019 Figure Visual China Group Market Share of Photographic Services Segmented by Region in 2018 Table Company Profiles Table Product Introduction Table Pace Photography Production, Value ($), Price, Gross Margin 2014-2019 Figure Pace Photography Production and Growth Rate Figure Pace Photography Value ($) Market Share 2014-2019 Figure Pace Photography Market Share of Photographic Services Segmented by Region in 2018 Table Company Profiles Table Product Introduction Table Photo Studio Production, Value ($), Price, Gross Margin 2014-2019 Figure Photo Studio Production and Growth Rate Figure Photo Studio Value ($) Market Share 2014-2019 Figure Photo Studio Market Share of Photographic Services Segmented by Region in 2018 Table Company Profiles Table Product Introduction Table Studio Alice Production, Value ($), Price, Gross Margin 2014-2019 Figure Studio Alice Production and Growth Rate Figure Studio Alice Value ($) Market Share 2014-2019 Figure Studio Alice Market Share of Photographic Services Segmented by Region in 2018 Table Company Profiles Table Product Introduction Table Snappr Photography Production, Value ($), Price, Gross Margin 2014-2019 Figure Snappr Photography Production and Growth Rate Figure Snappr Photography Value ($) Market Share 2014-2019 Figure Snappr Photography Market Share of Photographic Services Segmented by Region in 2018 Table Company Profiles Table Product Introduction Table Vital Production, Value ($), Price, Gross Margin 2014-2019 Figure Vital Production and Growth Rate Figure Vital Value ($) Market Share 2014-2019 Figure Vital Market Share of Photographic Services Segmented by Region in 2018 Table Company Profiles Table Product Introduction Table Lifetouch Inc. Production, Value ($), Price, Gross Margin 2014-2019 Figure Lifetouch Inc. Production and Growth Rate Figure Lifetouch Inc. Value ($) Market Share 2014-2019 Figure Lifetouch Inc. Market Share of Photographic Services Segmented by Region in 2018 Table Global Photographic Services Market Value ($) Forecast, by Type Table Global Photographic Services Market Volume Forecast, by Type Figure Global Photographic Services Market Value ($) and Growth Rate Forecast of School Portraits (2019-2024) Figure Global Photographic Services Market Volume and Growth Rate Forecast of School Portraits (2019-2024) Figure Global Photographic Services Market Value ($) and Growth Rate Forecast of Architectural and Commercial Photography (2019-2024) Figure Global Photographic Services Market Volume and Growth Rate Forecast of Architectural and Commercial Photography (2019-2024) Figure Global Photographic Services Market Value ($) and Growth Rate Forecast of Wedding and Event Videography (2019-2024) Figure Global Photographic Services Market Volume and Growth Rate Forecast of Wedding and Event Videography (2019-2024) Figure Global Photographic Services Market Value ($) and Growth Rate Forecast of Still Life Photography (2019-2024) Figure Global Photographic Services Market Volume and Growth Rate Forecast of Still Life Photography (2019-2024) Table Global Market Value ($) Forecast by Application (2019-2024) Table Global Market Volume Forecast by Application (2019-2024) Figure Global Photographic Services Consumption and Growth Rate of Personal (2014-2019) Figure Global Photographic Services Consumption and Growth Rate of Commerical (2014-2019) Figure Market Value ($) and Growth Rate Forecast of Commerical (2019-2024) Figure Market Volume and Growth Rate Forecast of Commerical (2019-2024) Figure North America Market Value ($) and Growth Rate Forecast (2019-2024) Table North America Consumption and Growth Rate Forecast (2019-2024) Figure Europe Market Value ($) and Growth Rate Forecast (2019-2024) Table Europe Consumption and Growth Rate Forecast (2019-2024) Figure China Market Value ($) and Growth Rate Forecast (2019-2024) Table China Consumption and Growth Rate Forecast (2019-2024) Figure Japan Market Value ($) and Growth Rate Forecast (2019-2024) Table Japan Consumption and Growth Rate Forecast (2019-2024) Figure Middle East & Africa Market Value ($) and Growth Rate Forecast (2019-2024) Table Middle East & Africa Consumption and Growth Rate Forecast (2019-2024) Figure India Market Value ($) and Growth Rate Forecast (2019-2024) Table India Consumption and Growth Rate Forecast (2019-2024) Figure South America Market Value ($) and Growth Rate Forecast (2019-2024) Table South America Consumption and Growth Rate Forecast (2019-2024) Figure Industry Resource/Technology/Labor Importance Analysis Table New Entrants SWOT Analysis Table New Project Analysis of Investment Recovery
Inquiry For Buying
Photographic Services
Request Sample
Photographic Services