Price Optimization Software Market Size, Share, and Trends Analysis Report
CAGR :

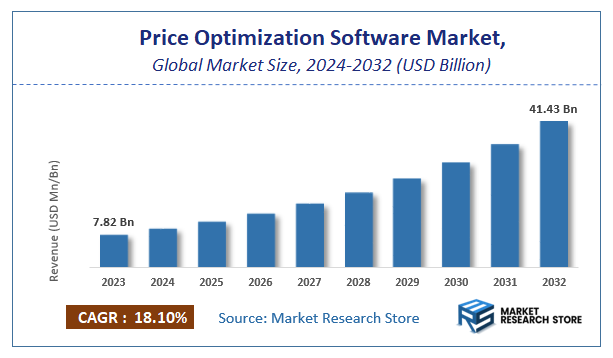
| Market Size 2023 (Base Year) | USD 7.82 Billion |
| Market Size 2032 (Forecast Year) | USD 41.43 Billion |
| CAGR | 18.1% |
| Forecast Period | 2024 - 2032 |
| Historical Period | 2018 - 2023 |
Price Optimization Software Market Insights
A latest report by Market Research Store estimates that the Global Price Optimization Software Market was valued at USD 7.82 Billion in 2023 and is expected to reach USD 41.43 Billion by 2032, with a CAGR of 18.1% during the forecast period 2024-2032. The report Price Optimization Software Market overview, growth factors, restraints, opportunities, segmentation, key developments, competitive landscape, consumer insights, and market growth forecast in terms of value or volume. These structured details offer an all-inclusive market overview, providing valuable insights for investment decisions, business decisions, strategic planning, and competitive analysis.
To Get more Insights, Request a Free Sample
Price Optimization Software Market: Overview
The growth of the price optimization software market is fueled by rising global demand across various industries and applications. The report highlights lucrative opportunities, analyzing cost structures, key segments, emerging trends, regional dynamics, and advancements by leading players to provide comprehensive market insights. The price optimization software market report offers a detailed industry analysis from 2024 to 2032, combining quantitative and qualitative insights. It examines key factors such as pricing, market penetration, GDP impact, industry dynamics, major players, consumer behavior, and socio-economic conditions. Structured into multiple sections, the report provides a comprehensive perspective on the market from all angles.
Key sections of the price optimization software market report include market segments, outlook, competitive landscape, and company profiles. Market Segments offer in-depth details based on Type, End User, and other relevant classifications to support strategic marketing initiatives. Market Outlook thoroughly analyzes market trends, growth drivers, restraints, opportunities, challenges, Porter’s Five Forces framework, macroeconomic factors, value chain analysis, and pricing trends shaping the market now and in the future. The Competitive Landscape and Company Profiles section highlights major players, their strategies, and market positioning to guide investment and business decisions. The report also identifies innovation trends, new business opportunities, and investment prospects for the forecast period.
Key Highlights:
- As per the analysis shared by our research analyst, the global price optimization software market is estimated to grow annually at a CAGR of around 18.1% over the forecast period (2024-2032).
- In terms of revenue, the global price optimization software market size was valued at around USD 7.82 Billion in 2023 and is projected to reach USD 41.43 Billion by 2032.
- The market is projected to grow at a significant rate due to increasing adoption of AI-driven pricing strategies, e-commerce expansion, and dynamic pricing models.
- Based on the Type, the Cloud-based segment is growing at a high rate and will continue to dominate the global market as per industry projections.
- On the basis of End User, the Retail segment is anticipated to command the largest market share.
- Based on region, North America is projected to dominate the global market during the forecast period.
Price Optimization Software Market: Report Scope
This report thoroughly analyzes the price optimization software market, exploring its historical trends, current state, and future projections. The market estimates presented result from a robust research methodology, incorporating primary research, secondary sources, and expert opinions. These estimates are influenced by the prevailing market dynamics as well as key economic, social, and political factors. Furthermore, the report considers the impact of regulations, government expenditures, and advancements in research and development on the market. Both positive and negative shifts are evaluated to ensure a comprehensive and accurate market outlook.
| Report Attributes | Report Details |
|---|---|
| Report Name | Price Optimization Software Market |
| Market Size in 2023 | USD 7.82 Billion |
| Market Forecast in 2032 | USD 41.43 Billion |
| Growth Rate | CAGR of 18.1% |
| Number of Pages | 184 |
| Key Companies Covered | Prisync, SellerActive, Dynamic Pricing, RepricerExpress, Revionics, Competera, Skuuudle, BQool, Omnia, TrackStreet, Eversight, Pricefx, PriceLab, RoomPriceGenie, Qualtrics, IntelligenceNode, Friggin Yeah!, BlackCurve, CallidusCloud, Darwin Pricing, SpotLi |
| Segments Covered | By Type, By End User, and By Region |
| Regions Covered | North America, Europe, Asia Pacific (APAC), Latin America, Middle East, and Africa (MEA) |
| Base Year | 2023 |
| Historical Year | 2018 to 2023 |
| Forecast Year | 2024 to 2032 |
| Customization Scope | Avail customized purchase options to meet your exact research needs. Request For Customization |
Price Optimization Software Market: Dynamics
Key Growth Drivers
The Price Optimization Software market in India is experiencing significant growth driven by the increasing adoption of e-commerce and the growing complexity of pricing strategies across various industries, including retail, travel, and manufacturing. The need for businesses to maximize profitability and remain competitive in a dynamic market necessitates the use of data-driven pricing solutions. Furthermore, the increasing availability of large datasets on consumer behavior, competitor pricing, and market trends provides the raw material for sophisticated price optimization algorithms. The growing awareness of the impact of pricing on revenue and customer acquisition is prompting businesses to invest in these tools. The advancements in artificial intelligence (AI) and machine learning (ML) have led to more accurate and dynamic pricing recommendations, further fueling market adoption.
Restraints
Despite the compelling benefits, the Price Optimization Software market in India faces certain restraints. The high initial investment cost of implementing and integrating these sophisticated software solutions can be a significant barrier, particularly for small and medium-sized enterprises (SMEs). The complexity of the software and the need for skilled personnel to operate and interpret the results can also hinder adoption. Furthermore, resistance to change and reliance on traditional pricing methods within some organizations can slow down the uptake of price optimization tools. Concerns about data privacy and security when sharing sensitive pricing and customer data with third-party software providers can also be a deterrent. The lack of seamless integration with existing enterprise resource planning (ERP) and customer relationship management (CRM) systems can also pose a challenge.
Opportunities
The Price Optimization Software market in India presents numerous opportunities for growth and localization. The increasing adoption of cloud-based price optimization solutions can reduce upfront costs and improve accessibility for SMEs. The development of solutions tailored to the specific needs and characteristics of the Indian market, considering factors like price sensitivity and regional variations, can drive wider adoption. Furthermore, the integration of real-time data and dynamic pricing capabilities can enable businesses to respond quickly to market changes and competitor actions. The potential for offering price optimization services and consulting alongside the software can provide added value to customers. The growth of e-commerce in regional languages and the need for localized pricing strategies also present an opportunity for specialized solutions.
Challenges
The Price Optimization Software market in India faces challenges related to educating businesses about the value proposition and return on investment (ROI) of price optimization software. Overcoming the resistance to change and convincing organizations to move away from traditional pricing methods requires demonstrating tangible benefits. Ensuring data accuracy and reliability for effective price optimization algorithms is crucial. Furthermore, integrating the software seamlessly with diverse legacy systems used by Indian businesses can be technically complex. Addressing the need for skilled data scientists and analysts to operate and interpret the software results is also a challenge. Finally, navigating the diverse and often fragmented retail landscape in India and developing pricing strategies that account for regional variations and competition requires sophisticated and adaptable solutions.
Price Optimization Software Market: Segmentation Insights
The global price optimization software market is segmented based on Type, End User, and Region. All the segments of the price optimization software market have been analyzed based on present & future trends and the market is estimated from 2024 to 2032.
Based on Type, the global price optimization software market is divided into Cloud-based, On-premises.
On the basis of End User, the global price optimization software market is bifurcated into Retail, Hospitality, E-commerce, Manufacturing, Others.
Price Optimization Software Market: Regional Insights
The global price optimization software market is dominated by North America, which holds the largest market share due to rapid adoption of AI-driven pricing tools, a mature e-commerce sector, and strong demand from retail, manufacturing, and travel industries. The U.S. is the primary contributor, fueled by major tech firms, competitive retail markets, and advanced analytics adoption. Europe follows, with key growth in the UK, Germany, and France, driven by stringent pricing regulations and omnichannel retail strategies.
The Asia-Pacific region is the fastest-growing, led by China, India, and Japan, as businesses increasingly leverage dynamic pricing for e-commerce and supply chain optimization. North America accounted for over 45% of market revenue in 2023, while Europe and Asia-Pacific held 30% and 20%, respectively.
Price Optimization Software Market: Competitive Landscape
The price optimization software market report offers a thorough analysis of both established and emerging players within the market. It includes a detailed list of key companies, categorized based on the types of products they offer and other relevant factors. The report also highlights the market entry year for each player, providing further context for the research analysis.
The "Global Price Optimization Software Market" study offers valuable insights, focusing on the global market landscape, with an emphasis on major industry players such as;
- Prisync
- SellerActive
- Dynamic Pricing
- RepricerExpress
- Revionics
- Competera
- Skuuudle
- BQool
- Omnia
- TrackStreet
- Eversight
- Pricefx
- PriceLab
- RoomPriceGenie
- Qualtrics
- IntelligenceNode
- Friggin Yeah!
- BlackCurve
- CallidusCloud
- Darwin Pricing
- SpotLite
- Price2Spy
- Marguard
- EReprice
- Xsellco
- JDA Software Group
- Seller Republic
- Clear Demand
- PriceEdge
- Wiser
- Engage3
- NetRivals
The Global Price Optimization Software Market is Segmented as Follows:
By Type
- Cloud-based
- On-premises
By End User
- Retail
- Hospitality
- E-commerce
- Manufacturing
- Others
By Region
- North America
- The U.S.
- Canada
- Mexico
- Europe
- France
- The UK
- Spain
- Germany
- Italy
- Rest of Europe
- Asia Pacific
- China
- Japan
- India
- Australia
- South Korea
- Rest of Asia Pacific
- The Middle East & Africa
- Saudi Arabia
- UAE
- Egypt
- Kuwait
- South Africa
- Rest of the Middle East & Africa
- Latin America
- Brazil
- Argentina
- Rest of Latin America
Market Evolution
This section evaluates the market position of the product or service by examining its development pathway and competitive dynamics. It provides a detailed overview of the product's growth stages, including the early (historical) phase, the mid-stage, and anticipated future advancements influenced by innovation and emerging technologies.
Porter’s Analysis
Porter’s Five Forces framework offers a strategic lens for assessing competitor behavior and the positioning of key players in the price optimization software industry. This section explores the external factors shaping competitive dynamics and influencing market strategies in the years ahead. The analysis focuses on five critical forces:
- Competitive Rivalry
- Threat of New Entrants
- Threat of Substitutes
- Supplier Bargaining Power
- Buyer Bargaining Power
Value Chain & Market Attractiveness Analysis
The value chain analysis helps businesses optimize operations by mapping the product flow from suppliers to end consumers, identifying opportunities to streamline processes and gain a competitive edge. Segment-wise market attractiveness analysis evaluates key dimensions like product categories, demographics, and regions, assessing growth potential, market size, and profitability. This enables businesses to focus resources on high-potential segments for better ROI and long-term value.
PESTEL Analysis
PESTEL analysis is a powerful tool in market research reports that enhances market understanding by systematically examining the external macro-environmental factors influencing a business or industry. The acronym stands for Political, Economic, Social, Technological, Environmental, and Legal factors. By evaluating these dimensions, PESTEL analysis provides a comprehensive overview of the broader context within which a market operates, helping businesses identify potential opportunities and threats.
- Political factors assess government policies, stability, trade regulations, and political risks that could impact market operations.
- Economic factors examine variables like inflation, exchange rates, economic growth, and consumer spending power to determine market viability.
- Social factors explore cultural trends, demographics, and lifestyle changes that shape consumer behavior and preferences.
- Technological factors evaluate innovation, R&D, and technological advancements affecting product development and operational efficiencies.
- Environmental factors focus on sustainability, climate change impacts, and eco-friendly practices shaping market trends.
- Legal factors address compliance requirements, industry regulations, and intellectual property laws impacting market entry and operations.
Import-Export Analysis & Pricing Analysis
An import-export analysis is vital for market research, revealing global trade dynamics, trends, and opportunities. It examines trade volumes, product categories, and regional competitiveness, offering insights into supply chains and market demand. This section also analyzes past and future pricing trends, helping businesses optimize strategies and enabling consumers to assess product value effectively.
Price Optimization Software Market: Company Profiles
The report identifies key players in the price optimization software market through competitive landscape and company profiles, evaluating their offerings, financial performance, strategies, and market positioning. It includes a SWOT analysis of the top 3-5 companies, assessing strengths, weaknesses, opportunities, and threats. The competitive landscape highlights rankings, recent activities (mergers, acquisitions, partnerships, product launches), and regional footprints using the Ace matrix. Customization is available to meet client-specific needs.
Regional & Industry Footprint
This section details the geographic reach, sales networks, and market penetration of companies profiled in the price optimization software report, showcasing their operations and distribution across regions. It analyzes the alignment of companies with specific industry verticals, highlighting the industries they serve and the scope of their products and services within those sectors.
Ace Matrix
This section categorizes companies into four distinct groups—Active, Cutting Edge, Innovator, and Emerging—based on their product and business strategies. The evaluation of product strategy focuses on aspects such as the range and depth of offerings, commitment to innovation, product functionalities, and scalability. Key elements like global reach, sector coverage, strategic acquisitions, and long-term growth plans are considered for business strategy. This analysis provides a detailed view of companies' position within the market and highlights their potential for future growth and development.
Research Methodology
The qualitative and quantitative insights for the price optimization software market are derived through a multi-faceted research approach, combining input from subject matter experts, primary research, and secondary data sources. Primary research includes gathering critical information via face-to-face or telephonic interviews, surveys, questionnaires, and feedback from industry professionals, key opinion leaders (KOLs), and customers. Regular interviews with industry experts are conducted to deepen the analysis and reinforce the existing data, ensuring a robust and well-rounded market understanding.
Secondary research for this report was carried out by the Market Research Store team, drawing on a variety of authoritative sources, such as:
- Official company websites, annual reports, financial statements, investor presentations, and SEC filings
- Internal and external proprietary databases, as well as relevant patent and regulatory databases
- Government publications, national statistical databases, and industry-specific market reports
- Media coverage, including news articles, press releases, and webcasts about market participants
- Paid industry databases for detailed market insights
Market Research Store conducted in-depth consultations with various key opinion leaders in the industry, including senior executives from top companies and regional leaders from end-user organizations. This effort aimed to gather critical insights on factors such as the market share of dominant brands in specific countries and regions, along with pricing strategies for products and services.
To determine total sales data, the research team conducted primary interviews across multiple countries with influential stakeholders, including:
- Distributors
- Marketing, Brand, and Product Managers
- Procurement and Production Managers
- Sales and Regional Sales Managers, Country Managers
- Technical Specialists
- C-Level Executives
These subject matter experts, with their extensive industry experience, helped validate and refine the findings. For secondary research, data was sourced from a wide range of materials, including online resources, company annual reports, industry publications, research papers, association reports, and government websites. These various sources provide a comprehensive and well-rounded perspective on the market.
Frequently Asked Questions
Table Of Content
Table of Content 1 Price Optimization Software Market - Research Scope 1.1 Study Goals 1.2 Market Definition and Scope 1.3 Key Market Segments 1.4 Study and Forecasting Years 2 Price Optimization Software Market - Research Methodology 2.1 Methodology 2.2 Research Data Source 2.2.1 Secondary Data 2.2.2 Primary Data 2.2.3 Market Size Estimation 2.2.4 Legal Disclaimer 3 Price Optimization Software Market Forces 3.1 Global Price Optimization Software Market Size 3.2 Top Impacting Factors (PESTEL Analysis) 3.2.1 Political Factors 3.2.2 Economic Factors 3.2.3 Social Factors 3.2.4 Technological Factors 3.2.5 Environmental Factors 3.2.6 Legal Factors 3.3 Industry Trend Analysis 3.4 Industry Trends Under COVID-19 3.4.1 Risk Assessment on COVID-19 3.4.2 Assessment of the Overall Impact of COVID-19 on the Industry 3.4.3 Pre COVID-19 and Post COVID-19 Market Scenario 3.5 Industry Risk Assessment 4 Price Optimization Software Market - By Geography 4.1 Global Price Optimization Software Market Value and Market Share by Regions 4.1.1 Global Price Optimization Software Value ($) by Region (2015-2020) 4.1.2 Global Price Optimization Software Value Market Share by Regions (2015-2020) 4.2 Global Price Optimization Software Market Production and Market Share by Major Countries 4.2.1 Global Price Optimization Software Production by Major Countries (2015-2020) 4.2.2 Global Price Optimization Software Production Market Share by Major Countries (2015-2020) 4.3 Global Price Optimization Software Market Consumption and Market Share by Regions 4.3.1 Global Price Optimization Software Consumption by Regions (2015-2020) 4.3.2 Global Price Optimization Software Consumption Market Share by Regions (2015-2020) 5 Price Optimization Software Market - By Trade Statistics 5.1 Global Price Optimization Software Export and Import 5.2 United States Price Optimization Software Export and Import (2015-2020) 5.3 Europe Price Optimization Software Export and Import (2015-2020) 5.4 China Price Optimization Software Export and Import (2015-2020) 5.5 Japan Price Optimization Software Export and Import (2015-2020) 5.6 India Price Optimization Software Export and Import (2015-2020) 5.7 ... 6 Price Optimization Software Market - By Type 6.1 Global Price Optimization Software Production and Market Share by Types (2015-2020) 6.1.1 Global Price Optimization Software Production by Types (2015-2020) 6.1.2 Global Price Optimization Software Production Market Share by Types (2015-2020) 6.2 Global Price Optimization Software Value and Market Share by Types (2015-2020) 6.2.1 Global Price Optimization Software Value by Types (2015-2020) 6.2.2 Global Price Optimization Software Value Market Share by Types (2015-2020) 6.3 Global Price Optimization Software Production, Price and Growth Rate of PC Terminal (2015-2020) 6.4 Global Price Optimization Software Production, Price and Growth Rate of Mobile Terminal (2015-2020) 7 Price Optimization Software Market - By Application 7.1 Global Price Optimization Software Consumption and Market Share by Applications (2015-2020) 7.1.1 Global Price Optimization Software Consumption by Applications (2015-2020) 7.1.2 Global Price Optimization Software Consumption Market Share by Applications (2015-2020) 7.2 Global Price Optimization Software Consumption and Growth Rate of Retailer (2015-2020) 7.3 Global Price Optimization Software Consumption and Growth Rate of E-commerce (2015-2020) 7.4 Global Price Optimization Software Consumption and Growth Rate of Brands (2015-2020) 7.5 Global Price Optimization Software Consumption and Growth Rate of Supermarkets (2015-2020) 8 North America Price Optimization Software Market 8.1 North America Price Optimization Software Market Size 8.2 United States Price Optimization Software Market Size 8.3 Canada Price Optimization Software Market Size 8.4 Mexico Price Optimization Software Market Size 8.5 The Influence of COVID-19 on North America Market 9 Europe Price Optimization Software Market Analysis 9.1 Europe Price Optimization Software Market Size 9.2 Germany Price Optimization Software Market Size 9.3 United Kingdom Price Optimization Software Market Size 9.4 France Price Optimization Software Market Size 9.5 Italy Price Optimization Software Market Size 9.6 Spain Price Optimization Software Market Size 9.7 The Influence of COVID-19 on Europe Market 10 Asia-Pacific Price Optimization Software Market Analysis 10.1 Asia-Pacific Price Optimization Software Market Size 10.2 China Price Optimization Software Market Size 10.3 Japan Price Optimization Software Market Size 10.4 South Korea Price Optimization Software Market Size 10.5 Southeast Asia Price Optimization Software Market Size 10.6 India Price Optimization Software Market Size 10.7 The Influence of COVID-19 on Asia Pacific Market 11 Middle East and Africa Price Optimization Software Market Analysis 11.1 Middle East and Africa Price Optimization Software Market Size 11.2 Saudi Arabia Price Optimization Software Market Size 11.3 UAE Price Optimization Software Market Size 11.4 South Africa Price Optimization Software Market Size 11.5 The Influence of COVID-19 on Middle East and Africa Market 12 South America Price Optimization Software Market Analysis 12.1 South America Price Optimization Software Market Size 12.2 Brazil Price Optimization Software Market Size 12.3 The Influence of COVID-19 on South America Market 13 Company Profiles 13.1 Prisync 13.1.1 Prisync Basic Information 13.1.2 Prisync Product Profiles, Application and Specification 13.1.3 Prisync Price Optimization Software Market Performance (2015-2020) 13.2 SellerActive 13.2.1 SellerActive Basic Information 13.2.2 SellerActive Product Profiles, Application and Specification 13.2.3 SellerActive Price Optimization Software Market Performance (2015-2020) 13.3 Dynamic Pricing 13.3.1 Dynamic Pricing Basic Information 13.3.2 Dynamic Pricing Product Profiles, Application and Specification 13.3.3 Dynamic Pricing Price Optimization Software Market Performance (2015-2020) 13.4 RepricerExpress 13.4.1 RepricerExpress Basic Information 13.4.2 RepricerExpress Product Profiles, Application and Specification 13.4.3 RepricerExpress Price Optimization Software Market Performance (2015-2020) 13.5 Revionics 13.5.1 Revionics Basic Information 13.5.2 Revionics Product Profiles, Application and Specification 13.5.3 Revionics Price Optimization Software Market Performance (2015-2020) 13.6 Competera 13.6.1 Competera Basic Information 13.6.2 Competera Product Profiles, Application and Specification 13.6.3 Competera Price Optimization Software Market Performance (2015-2020) 13.7 Skuuudle 13.7.1 Skuuudle Basic Information 13.7.2 Skuuudle Product Profiles, Application and Specification 13.7.3 Skuuudle Price Optimization Software Market Performance (2015-2020) 13.8 BQool 13.8.1 BQool Basic Information 13.8.2 BQool Product Profiles, Application and Specification 13.8.3 BQool Price Optimization Software Market Performance (2015-2020) 13.9 Omnia 13.9.1 Omnia Basic Information 13.9.2 Omnia Product Profiles, Application and Specification 13.9.3 Omnia Price Optimization Software Market Performance (2015-2020) 13.10 TrackStreet 13.10.1 TrackStreet Basic Information 13.10.2 TrackStreet Product Profiles, Application and Specification 13.10.3 TrackStreet Price Optimization Software Market Performance (2015-2020) 13.11 Eversight 13.11.1 Eversight Basic Information 13.11.2 Eversight Product Profiles, Application and Specification 13.11.3 Eversight Price Optimization Software Market Performance (2015-2020) 13.12 Pricefx 13.12.1 Pricefx Basic Information 13.12.2 Pricefx Product Profiles, Application and Specification 13.12.3 Pricefx Price Optimization Software Market Performance (2015-2020) 13.13 PriceLab 13.13.1 PriceLab Basic Information 13.13.2 PriceLab Product Profiles, Application and Specification 13.13.3 PriceLab Price Optimization Software Market Performance (2015-2020) 13.14 RoomPriceGenie 13.14.1 RoomPriceGenie Basic Information 13.14.2 RoomPriceGenie Product Profiles, Application and Specification 13.14.3 RoomPriceGenie Price Optimization Software Market Performance (2015-2020) 13.15 Qualtrics 13.15.1 Qualtrics Basic Information 13.15.2 Qualtrics Product Profiles, Application and Specification 13.15.3 Qualtrics Price Optimization Software Market Performance (2015-2020) 13.16 IntelligenceNode 13.16.1 IntelligenceNode Basic Information 13.16.2 IntelligenceNode Product Profiles, Application and Specification 13.16.3 IntelligenceNode Price Optimization Software Market Performance (2015-2020) 13.17 Friggin Yeah! 13.17.1 Friggin Yeah! Basic Information 13.17.2 Friggin Yeah! Product Profiles, Application and Specification 13.17.3 Friggin Yeah! Price Optimization Software Market Performance (2015-2020) 13.18 BlackCurve 13.18.1 BlackCurve Basic Information 13.18.2 BlackCurve Product Profiles, Application and Specification 13.18.3 BlackCurve Price Optimization Software Market Performance (2015-2020) 13.19 CallidusCloud 13.19.1 CallidusCloud Basic Information 13.19.2 CallidusCloud Product Profiles, Application and Specification 13.19.3 CallidusCloud Price Optimization Software Market Performance (2015-2020) 13.20 Darwin Pricing 13.20.1 Darwin Pricing Basic Information 13.20.2 Darwin Pricing Product Profiles, Application and Specification 13.20.3 Darwin Pricing Price Optimization Software Market Performance (2015-2020) 13.21 SpotLite 13.21.1 SpotLite Basic Information 13.21.2 SpotLite Product Profiles, Application and Specification 13.21.3 SpotLite Price Optimization Software Market Performance (2015-2020) 13.22 Price2Spy 13.22.1 Price2Spy Basic Information 13.22.2 Price2Spy Product Profiles, Application and Specification 13.22.3 Price2Spy Price Optimization Software Market Performance (2015-2020) 13.23 Marguard 13.23.1 Marguard Basic Information 13.23.2 Marguard Product Profiles, Application and Specification 13.23.3 Marguard Price Optimization Software Market Performance (2015-2020) 13.24 EReprice 13.24.1 EReprice Basic Information 13.24.2 EReprice Product Profiles, Application and Specification 13.24.3 EReprice Price Optimization Software Market Performance (2015-2020) 13.25 Xsellco 13.25.1 Xsellco Basic Information 13.25.2 Xsellco Product Profiles, Application and Specification 13.25.3 Xsellco Price Optimization Software Market Performance (2015-2020) 13.26 JDA Software Group 13.26.1 JDA Software Group Basic Information 13.26.2 JDA Software Group Product Profiles, Application and Specification 13.26.3 JDA Software Group Price Optimization Software Market Performance (2015-2020) 13.27 Seller Republic 13.27.1 Seller Republic Basic Information 13.27.2 Seller Republic Product Profiles, Application and Specification 13.27.3 Seller Republic Price Optimization Software Market Performance (2015-2020) 13.28 Clear Demand 13.28.1 Clear Demand Basic Information 13.28.2 Clear Demand Product Profiles, Application and Specification 13.28.3 Clear Demand Price Optimization Software Market Performance (2015-2020) 13.29 PriceEdge 13.29.1 PriceEdge Basic Information 13.29.2 PriceEdge Product Profiles, Application and Specification 13.29.3 PriceEdge Price Optimization Software Market Performance (2015-2020) 13.30 Wiser 13.30.1 Wiser Basic Information 13.30.2 Wiser Product Profiles, Application and Specification 13.30.3 Wiser Price Optimization Software Market Performance (2015-2020) 13.31 Engage3 13.31.1 Engage3 Basic Information 13.31.2 Engage3 Product Profiles, Application and Specification 13.31.3 Engage3 Price Optimization Software Market Performance (2015-2020) 13.32 NetRivals 13.32.1 NetRivals Basic Information 13.32.2 NetRivals Product Profiles, Application and Specification 13.32.3 NetRivals Price Optimization Software Market Performance (2015-2020) 14 Market Forecast - By Regions 14.1 North America Price Optimization Software Market Forecast (2020-2025) 14.2 Europe Price Optimization Software Market Forecast (2020-2025) 14.3 Asia-Pacific Price Optimization Software Market Forecast (2020-2025) 14.4 Middle East and Africa Price Optimization Software Market Forecast (2020-2025) 14.5 South America Price Optimization Software Market Forecast (2020-2025) 15 Market Forecast - By Type and Applications 15.1 Global Price Optimization Software Market Forecast by Types (2020-2025) 15.1.1 Global Price Optimization Software Market Forecast Production and Market Share by Types (2020-2025) 15.1.2 Global Price Optimization Software Market Forecast Value and Market Share by Types (2020-2025) 15.2 Global Price Optimization Software Market Forecast by Applications (2020-2025)
Inquiry For Buying
Price Optimization Software
Request Sample
Price Optimization Software