Ready to Drink (RTD) Tea and Coffee Market Size, Share, and Trends Analysis Report
CAGR :

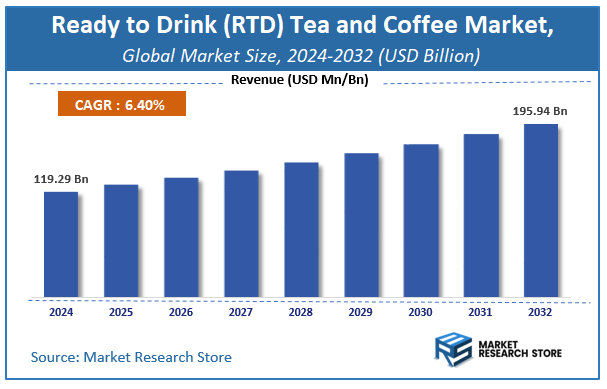
| Market Size 2024 (Base Year) | USD 119.29 Billion |
| Market Size 2032 (Forecast Year) | USD 195.94 Billion |
| CAGR | 6.4% |
| Forecast Period | 2025 - 2032 |
| Historical Period | 2020 - 2024 |
According to a recent study by Market Research Store, the global ready to drink (RTD) tea and coffee market size was valued at approximately USD 119.29 Billion in 2024. The market is projected to grow significantly, reaching USD 195.94 Billion by 2032, growing at a compound annual growth rate (CAGR) of 6.4% during the forecast period from 2024 to 2032. The report highlights key growth drivers such as rising demand, technological advancements, and expanding applications. It also outlines potential challenges like regulatory changes and market competition, while emphasizing emerging opportunities for innovation and investment in the ready to drink (RTD) tea and coffee industry.
To Get more Insights, Request a Free Sample
Ready to Drink (RTD) Tea and Coffee Market: Overview
The growth of the ready to drink (RTD) tea and coffee market is fueled by rising global demand across various industries and applications. The report highlights lucrative opportunities, analyzing cost structures, key segments, emerging trends, regional dynamics, and advancements by leading players to provide comprehensive market insights. The ready to drink (RTD) tea and coffee market report offers a detailed industry analysis from 2024 to 2032, combining quantitative and qualitative insights. It examines key factors such as pricing, market penetration, GDP impact, industry dynamics, major players, consumer behavior, and socio-economic conditions. Structured into multiple sections, the report provides a comprehensive perspective on the market from all angles.
Key sections of the ready to drink (RTD) tea and coffee market report include market segments, outlook, competitive landscape, and company profiles. Market Segments offer in-depth details based on Product Type, Packaging Type, Distribution Channel, Flavor Profile, Consumer Demographics, and other relevant classifications to support strategic marketing initiatives. Market Outlook thoroughly analyzes market trends, growth drivers, restraints, opportunities, challenges, Porter’s Five Forces framework, macroeconomic factors, value chain analysis, and pricing trends shaping the market now and in the future. The Competitive Landscape and Company Profiles section highlights major players, their strategies, and market positioning to guide investment and business decisions. The report also identifies innovation trends, new business opportunities, and investment prospects for the forecast period.
Key Highlights:
- As per the analysis shared by our research analyst, the global ready to drink (RTD) tea and coffee market is estimated to grow annually at a CAGR of around 6.4% over the forecast period (2024-2032).
- In terms of revenue, the global ready to drink (RTD) tea and coffee market size was valued at around USD 119.29 Billion in 2024 and is projected to reach USD 195.94 Billion by 2032.
- The market is projected to grow at a significant rate due to rising demand for convenient, functional beverages, health-conscious innovation, and premiumization trends in flavors and formats.
- Based on the Product Type, the Ready to Drink Tea segment is growing at a high rate and will continue to dominate the global market as per industry projections.
- On the basis of Packaging Type, the Bottles segment is anticipated to command the largest market share.
- In terms of Distribution Channel, the Supermarkets and Hypermarkets segment is projected to lead the global market.
- By Flavor Profile, the Classic/Original segment is predicted to dominate the global market.
- Based on the Consumer Demographics, the Age Group segment is expected to swipe the largest market share.
- Based on region, Asia-Pacific is projected to dominate the global market during the forecast period.
Ready to Drink (RTD) Tea and Coffee Market: Report Scope
This report thoroughly analyzes the ready to drink (RTD) tea and coffee market, exploring its historical trends, current state, and future projections. The market estimates presented result from a robust research methodology, incorporating primary research, secondary sources, and expert opinions. These estimates are influenced by the prevailing market dynamics as well as key economic, social, and political factors. Furthermore, the report considers the impact of regulations, government expenditures, and advancements in research and development on the market. Both positive and negative shifts are evaluated to ensure a comprehensive and accurate market outlook.
| Report Attributes | Report Details |
|---|---|
| Report Name | Ready to Drink (RTD) Tea and Coffee Market |
| Market Size in 2024 | USD 119.29 Billion |
| Market Forecast in 2032 | USD 195.94 Billion |
| Growth Rate | CAGR of 6.4% |
| Number of Pages | 211 |
| Key Companies Covered | Suntory Holdings Ltd., Nestlé S.A., The Coca-Cola Company, PepsiCo Inc., Tsing Hsin International Group, Starbucks Corporation, Uni-President Enterprises, Monster Beverage Company, and Danone. |
| Segments Covered | By Product Type, By Packaging Type, By Distribution Channel, By Flavor Profile, By Consumer Demographics, and By Region |
| Regions Covered | North America, Europe, Asia Pacific (APAC), Latin America, Middle East, and Africa (MEA) |
| Base Year | 2024 |
| Historical Year | 2020 to 2024 |
| Forecast Year | 2025 to 2032 |
| Customization Scope | Avail customized purchase options to meet your exact research needs. Request For Customization |
Ready to Drink (RTD) Tea and Coffee Market: Dynamics
Key Growth Drivers:
The Ready to Drink (RTD) Tea and Coffee market is experiencing strong growth primarily driven by the increasing demand for convenient, on-the-go beverages that align with modern, fast-paced lifestyles. Urbanization and the rising number of working professionals have led to a preference for quick, no-preparation-required drinks. Furthermore, a significant shift in consumer preferences towards healthier alternatives to sugary carbonated drinks and sodas is a major catalyst. Both RTD tea and coffee are perceived as healthier options, often fortified with functional ingredients and antioxidants. The market is also benefiting from a growing trend of "premiumization," with consumers willing to pay more for high-quality, artisanal, and specialty RTD products like cold brews and single-origin teas.
Restraints:
Despite the market's positive trajectory, it faces several significant restraints. A key challenge is the higher production cost of RTD beverages compared to traditional at-home brewing, which can lead to a higher price point for the end consumer. This makes them less accessible to price-sensitive segments of the population. The market is also subject to the unpredictable nature of raw material costs, particularly the volatile prices of coffee beans and tea leaves, which can directly impact profit margins. Additionally, while the market is growing, it still faces stiff competition from traditional beverage categories and a growing number of alternative healthy drinks, such as fresh juices and energy drinks, which can fragment the consumer base.
Opportunities:
The RTD tea and coffee market presents numerous opportunities for future growth. The rising popularity of e-commerce and online retail platforms provides a powerful avenue for brands to reach a wider, global customer base. There is a significant opportunity for product innovation, including the development of new and unique flavor combinations, such as botanical infusions and exotic fruit blends, to appeal to adventurous consumers. The demand for functional beverages offers a major growth avenue, with brands incorporating ingredients like vitamins, proteins, and adaptogens to provide added health benefits. Furthermore, the development of eco-friendly and sustainable packaging solutions can help brands appeal to a growing segment of environmentally conscious consumers.
Challenges:
The market faces a number of specific challenges that must be addressed. Maintaining consistent product quality and taste across a diverse portfolio is a continuous operational challenge. The high level of competition and market saturation, particularly in developed regions, makes it difficult for new entrants to gain a foothold and for existing brands to maintain market share. Consumer perception can be a hurdle, as some still view packaged drinks with skepticism regarding their healthfulness and ingredient transparency. Finally, the need for continuous research and development to stay ahead of evolving consumer trends and to innovate with new ingredients and flavors puts pressure on a company's financial and technical resources.
Ready to Drink (RTD) Tea and Coffee Market: Segmentation Insights
The global ready to drink (RTD) tea and coffee market is segmented based on Product Type, Packaging Type, Distribution Channel, Flavor Profile, Consumer Demographics, and Region. All the segments of the ready to drink (RTD) tea and coffee market have been analyzed based on present & future trends and the market is estimated from 2024 to 2032.
Based on Product Type, the global ready to drink (RTD) tea and coffee market is divided into Ready to Drink Tea, Ready to Drink Coffee, Mixed and Flavored Beverages.
On the basis of Packaging Type, the global ready to drink (RTD) tea and coffee market is bifurcated into Bottles, Cans, Pouches, Cartons.
In terms of Distribution Channel, the global ready to drink (RTD) tea and coffee market is categorized into Supermarkets and Hypermarkets, Convenience Stores, Online Retail, Specialty Stores.
Based on Flavor Profile, the global ready to drink (RTD) tea and coffee market is split into Classic/Original, Herbal and Floral, Fruit Infusions, Spiced and Blended.
By Consumer Demographics, the global ready to drink (RTD) tea and coffee market is divided into Age Group, Income Level, Lifestyle Preferences.
Ready to Drink (RTD) Tea and Coffee Market: Regional Insights
Asia-Pacific (APAC) is the dominant region in the global RTD tea and coffee market, holding the largest revenue share, estimated at over 50%. This overwhelming dominance is driven by deep-rooted cultural tea consumption habits, particularly in Japan, which pioneered the category, and China, the world's largest tea producer and consumer. The region's hot climate, high urbanization, and extensive availability of diverse products through vast vending machine and convenience store networks fuel massive consumption.
While North America is a significant and mature market characterized by innovation in cold brew coffee and health-focused tea variants, and Europe shows steady growth, their market sizes are substantially smaller. APAC's cultural foundation, established supply chains, and immense consumer base, coupled with rapidly growing coffee culture in Southeast Asia, solidify its position as the undisputed leader in this market.
Ready to Drink (RTD) Tea and Coffee Market: Competitive Landscape
The ready to drink (RTD) tea and coffee market Report offers a thorough analysis of both established and emerging players within the market. It includes a detailed list of key companies, categorized based on the types of products they offer and other relevant factors. The report also highlights the market entry year for each player, providing further context for the research analysis.
The "Global Ready to Drink (RTD) Tea and Coffee Market" study offers valuable insights, focusing on the global market landscape, with an emphasis on major industry players such as;
- Suntory Holdings Ltd.
- Nestlé S.A.
- The Coca-Cola Company
- PepsiCo Inc.
- Tsing Hsin International Group
- Starbucks Corporation
- Uni-President Enterprises
- Monster Beverage Company
- and Danone.
The Global Ready to Drink (RTD) Tea and Coffee Market is Segmented as Follows:
By Product Type
- Ready to Drink Tea
- Ready to Drink Coffee
- Mixed and Flavored Beverages
By Packaging Type
- Bottles
- Cans
- Pouches
- Cartons
By Distribution Channel
- Supermarkets and Hypermarkets
- Convenience Stores
- Online Retail
- Specialty Stores
By Flavor Profile
- Classic/Original
- Herbal and Floral
- Fruit Infusions
- Spiced and Blended
By Consumer Demographics
- Age Group
- Income Level
- Lifestyle Preferences
By Region
- North America
- The U.S.
- Canada
- Mexico
- Europe
- France
- The UK
- Spain
- Germany
- Italy
- Rest of Europe
- Asia Pacific
- China
- Japan
- India
- Australia
- South Korea
- Rest of Asia Pacific
- The Middle East & Africa
- Saudi Arabia
- UAE
- Egypt
- Kuwait
- South Africa
- Rest of the Middle East & Africa
- Latin America
- Brazil
- Argentina
- Rest of Latin America
Frequently Asked Questions
Table Of Content
List of Tables and Figures Figure Product Picture of Ready to Drink (RTD) Tea and Coffee Table Product Specification of Ready to Drink (RTD) Tea and Coffee Figure Market Concentration Ratio and Market Maturity Analysis of Ready to Drink (RTD) Tea and Coffee Figure Global Ready to Drink (RTD) Tea and Coffee Value ($) and Growth Rate from 2014-2024 Table Different Types of Ready to Drink (RTD) Tea and Coffee Figure Global Ready to Drink (RTD) Tea and Coffee Value ($) Segment by Type from 2014-2019 Figure Canned Picture Figure Glass Bottle Picture Figure PET Bottle Picture Figure Others Picture Table Different Applications of Ready to Drink (RTD) Tea and Coffee Figure Global Ready to Drink (RTD) Tea and Coffee Value ($) Segment by Applications from 2014-2019 Figure Supermarkets/Hypermarkets Picture Figure Specialty Retailers Picture Figure Convenience Stores Picture Figure E-Commerce Picture Table Research Regions of Ready to Drink (RTD) Tea and Coffee Figure North America Ready to Drink (RTD) Tea and Coffee Production Value ($) and Growth Rate (2014-2019) Figure Europe Ready to Drink (RTD) Tea and Coffee Production Value ($) and Growth Rate (2014-2019) Table China Ready to Drink (RTD) Tea and Coffee Production Value ($) and Growth Rate (2014-2019) Table Japan Ready to Drink (RTD) Tea and Coffee Production Value ($) and Growth Rate (2014-2019) Table Middle East & Africa Ready to Drink (RTD) Tea and Coffee Production Value ($) and Growth Rate (2014-2019) Table India Ready to Drink (RTD) Tea and Coffee Production Value ($) and Growth Rate (2014-2019) Table South America Ready to Drink (RTD) Tea and Coffee Production Value ($) and Growth Rate (2014-2019) Table Emerging Countries of Ready to Drink (RTD) Tea and Coffee Table Growing Market of Ready to Drink (RTD) Tea and Coffee Figure Industry Chain Analysis of Ready to Drink (RTD) Tea and Coffee Table Upstream Raw Material Suppliers of Ready to Drink (RTD) Tea and Coffee with Contact Information Table Major Players Manufacturing Base and Market Share ($) of Ready to Drink (RTD) Tea and Coffee in 2018 Table Major Players Ready to Drink (RTD) Tea and Coffee Product Types in 2018 Figure Production Process of Ready to Drink (RTD) Tea and Coffee Figure Manufacturing Cost Structure of Ready to Drink (RTD) Tea and Coffee Figure Channel Status of Ready to Drink (RTD) Tea and Coffee Table Major Distributors of Ready to Drink (RTD) Tea and Coffee with Contact Information Table Major Downstream Buyers of Ready to Drink (RTD) Tea and Coffee with Contact Information Table Global Ready to Drink (RTD) Tea and Coffee Value ($) by Type (2014-2019) Table Global Ready to Drink (RTD) Tea and Coffee Value ($) Share by Type (2014-2019) Figure Global Ready to Drink (RTD) Tea and Coffee Value ($) Share by Type (2014-2019) Table Global Ready to Drink (RTD) Tea and Coffee Production by Type (2014-2019) Table Global Ready to Drink (RTD) Tea and Coffee Production Share by Type (2014-2019) Figure Global Ready to Drink (RTD) Tea and Coffee Production Share by Type (2014-2019) Figure Global Ready to Drink (RTD) Tea and Coffee Value ($) and Growth Rate of Canned Figure Global Ready to Drink (RTD) Tea and Coffee Value ($) and Growth Rate of Glass Bottle Figure Global Ready to Drink (RTD) Tea and Coffee Value ($) and Growth Rate of PET Bottle Figure Global Ready to Drink (RTD) Tea and Coffee Value ($) and Growth Rate of Others Figure Global Ready to Drink (RTD) Tea and Coffee Price by Type (2014-2019) Table Global Ready to Drink (RTD) Tea and Coffee Consumption by Application (2014-2019) Table Global Ready to Drink (RTD) Tea and Coffee Consumption Market Share by Application (2014-2019) Figure Global Ready to Drink (RTD) Tea and Coffee Consumption Market Share by Application (2014-2019) Table Downstream Buyers Introduction by Application Figure Global Ready to Drink (RTD) Tea and Coffee Consumption and Growth Rate of Supermarkets/Hypermarkets (2014-2019) Figure Global Ready to Drink (RTD) Tea and Coffee Consumption and Growth Rate of Specialty Retailers (2014-2019) Figure Global Ready to Drink (RTD) Tea and Coffee Consumption and Growth Rate of Convenience Stores (2014-2019) Figure Global Ready to Drink (RTD) Tea and Coffee Consumption and Growth Rate of E-Commerce (2014-2019) Table Global Ready to Drink (RTD) Tea and Coffee Value ($) by Region (2014-2019) Table Global Ready to Drink (RTD) Tea and Coffee Value ($) Market Share by Region (2014-2019) Figure Global Ready to Drink (RTD) Tea and Coffee Value ($) Market Share by Region (2014-2019) Table Global Ready to Drink (RTD) Tea and Coffee Production by Region (2014-2019) Table Global Ready to Drink (RTD) Tea and Coffee Production Market Share by Region (2014-2019) Figure Global Ready to Drink (RTD) Tea and Coffee Production Market Share by Region (2014-2019) Table Global Ready to Drink (RTD) Tea and Coffee Production, Value ($), Price and Gross Margin (2014-2019) Table North America Ready to Drink (RTD) Tea and Coffee Production, Value ($), Price and Gross Margin (2014-2019) Table Europe Ready to Drink (RTD) Tea and Coffee Production, Value ($), Price and Gross Margin (2014-2019) Table China Ready to Drink (RTD) Tea and Coffee Production, Value ($), Price and Gross Margin (2014-2019) Table Japan Ready to Drink (RTD) Tea and Coffee Production, Value ($), Price and Gross Margin (2014-2019) Table Middle East & Africa Ready to Drink (RTD) Tea and Coffee Production, Value ($), Price and Gross Margin (2014-2019) Table India Ready to Drink (RTD) Tea and Coffee Production, Value ($), Price and Gross Margin (2014-2019) Table South America Ready to Drink (RTD) Tea and Coffee Production, Value ($), Price and Gross Margin (2014-2019) Table Global Ready to Drink (RTD) Tea and Coffee Consumption by Regions (2014-2019) Figure Global Ready to Drink (RTD) Tea and Coffee Consumption Share by Regions (2014-2019) Table North America Ready to Drink (RTD) Tea and Coffee Production, Consumption, Export, Import (2014-2019) Table Europe Ready to Drink (RTD) Tea and Coffee Production, Consumption, Export, Import (2014-2019) Table China Ready to Drink (RTD) Tea and Coffee Production, Consumption, Export, Import (2014-2019) Table Japan Ready to Drink (RTD) Tea and Coffee Production, Consumption, Export, Import (2014-2019) Table Middle East & Africa Ready to Drink (RTD) Tea and Coffee Production, Consumption, Export, Import (2014-2019) Table India Ready to Drink (RTD) Tea and Coffee Production, Consumption, Export, Import (2014-2019) Table South America Ready to Drink (RTD) Tea and Coffee Production, Consumption, Export, Import (2014-2019) Figure North America Ready to Drink (RTD) Tea and Coffee Production and Growth Rate Analysis Figure North America Ready to Drink (RTD) Tea and Coffee Consumption and Growth Rate Analysis Figure North America Ready to Drink (RTD) Tea and Coffee SWOT Analysis Figure Europe Ready to Drink (RTD) Tea and Coffee Production and Growth Rate Analysis Figure Europe Ready to Drink (RTD) Tea and Coffee Consumption and Growth Rate Analysis Figure Europe Ready to Drink (RTD) Tea and Coffee SWOT Analysis Figure China Ready to Drink (RTD) Tea and Coffee Production and Growth Rate Analysis Figure China Ready to Drink (RTD) Tea and Coffee Consumption and Growth Rate Analysis Figure China Ready to Drink (RTD) Tea and Coffee SWOT Analysis Figure Japan Ready to Drink (RTD) Tea and Coffee Production and Growth Rate Analysis Figure Japan Ready to Drink (RTD) Tea and Coffee Consumption and Growth Rate Analysis Figure Japan Ready to Drink (RTD) Tea and Coffee SWOT Analysis Figure Middle East & Africa Ready to Drink (RTD) Tea and Coffee Production and Growth Rate Analysis Figure Middle East & Africa Ready to Drink (RTD) Tea and Coffee Consumption and Growth Rate Analysis Figure Middle East & Africa Ready to Drink (RTD) Tea and Coffee SWOT Analysis Figure India Ready to Drink (RTD) Tea and Coffee Production and Growth Rate Analysis Figure India Ready to Drink (RTD) Tea and Coffee Consumption and Growth Rate Analysis Figure India Ready to Drink (RTD) Tea and Coffee SWOT Analysis Figure South America Ready to Drink (RTD) Tea and Coffee Production and Growth Rate Analysis Figure South America Ready to Drink (RTD) Tea and Coffee Consumption and Growth Rate Analysis Figure South America Ready to Drink (RTD) Tea and Coffee SWOT Analysis Figure Top 3 Market Share of Ready to Drink (RTD) Tea and Coffee Companies Figure Top 6 Market Share of Ready to Drink (RTD) Tea and Coffee Companies Table Mergers, Acquisitions and Expansion Analysis Table Company Profiles Table Product Introduction Table Starbucks Corporation Production, Value ($), Price, Gross Margin 2014-2019 Figure Starbucks Corporation Production and Growth Rate Figure Starbucks Corporation Value ($) Market Share 2014-2019 Figure Starbucks Corporation Market Share of Ready to Drink (RTD) Tea and Coffee Segmented by Region in 2018 Table Company Profiles Table Product Introduction Table Dr Pepper Snapple Group Production, Value ($), Price, Gross Margin 2014-2019 Figure Dr Pepper Snapple Group Production and Growth Rate Figure Dr Pepper Snapple Group Value ($) Market Share 2014-2019 Figure Dr Pepper Snapple Group Market Share of Ready to Drink (RTD) Tea and Coffee Segmented by Region in 2018 Table Company Profiles Table Product Introduction Table San Benedetto Production, Value ($), Price, Gross Margin 2014-2019 Figure San Benedetto Production and Growth Rate Figure San Benedetto Value ($) Market Share 2014-2019 Figure San Benedetto Market Share of Ready to Drink (RTD) Tea and Coffee Segmented by Region in 2018 Table Company Profiles Table Product Introduction Table Hangzhou Wahaha Group Production, Value ($), Price, Gross Margin 2014-2019 Figure Hangzhou Wahaha Group Production and Growth Rate Figure Hangzhou Wahaha Group Value ($) Market Share 2014-2019 Figure Hangzhou Wahaha Group Market Share of Ready to Drink (RTD) Tea and Coffee Segmented by Region in 2018 Table Company Profiles Table Product Introduction Table Asahi Group Holdings, Production, Value ($), Price, Gross Margin 2014-2019 Figure Asahi Group Holdings, Production and Growth Rate Figure Asahi Group Holdings, Value ($) Market Share 2014-2019 Figure Asahi Group Holdings, Market Share of Ready to Drink (RTD) Tea and Coffee Segmented by Region in 2018 Table Company Profiles Table Product Introduction Table Japan Tobacco Inc Production, Value ($), Price, Gross Margin 2014-2019 Figure Japan Tobacco Inc Production and Growth Rate Figure Japan Tobacco Inc Value ($) Market Share 2014-2019 Figure Japan Tobacco Inc Market Share of Ready to Drink (RTD) Tea and Coffee Segmented by Region in 2018 Table Company Profiles Table Product Introduction Table Monster Beverage Company Production, Value ($), Price, Gross Margin 2014-2019 Figure Monster Beverage Company Production and Growth Rate Figure Monster Beverage Company Value ($) Market Share 2014-2019 Figure Monster Beverage Company Market Share of Ready to Drink (RTD) Tea and Coffee Segmented by Region in 2018 Table Company Profiles Table Product Introduction Table Taisun Enterprises Co Ltd. Production, Value ($), Price, Gross Margin 2014-2019 Figure Taisun Enterprises Co Ltd. Production and Growth Rate Figure Taisun Enterprises Co Ltd. Value ($) Market Share 2014-2019 Figure Taisun Enterprises Co Ltd. Market Share of Ready to Drink (RTD) Tea and Coffee Segmented by Region in 2018 Table Company Profiles Table Product Introduction Table Ferolito Vulataggio and Sons Production, Value ($), Price, Gross Margin 2014-2019 Figure Ferolito Vulataggio and Sons Production and Growth Rate Figure Ferolito Vulataggio and Sons Value ($) Market Share 2014-2019 Figure Ferolito Vulataggio and Sons Market Share of Ready to Drink (RTD) Tea and Coffee Segmented by Region in 2018 Table Company Profiles Table Product Introduction Table Pepsico In Production, Value ($), Price, Gross Margin 2014-2019 Figure Pepsico In Production and Growth Rate Figure Pepsico In Value ($) Market Share 2014-2019 Figure Pepsico In Market Share of Ready to Drink (RTD) Tea and Coffee Segmented by Region in 2018 Table Company Profiles Table Product Introduction Table The Coca-Cola Company Production, Value ($), Price, Gross Margin 2014-2019 Figure The Coca-Cola Company Production and Growth Rate Figure The Coca-Cola Company Value ($) Market Share 2014-2019 Figure The Coca-Cola Company Market Share of Ready to Drink (RTD) Tea and Coffee Segmented by Region in 2018 Table Global Ready to Drink (RTD) Tea and Coffee Market Value ($) Forecast, by Type Table Global Ready to Drink (RTD) Tea and Coffee Market Volume Forecast, by Type Figure Global Ready to Drink (RTD) Tea and Coffee Market Value ($) and Growth Rate Forecast of Canned (2019-2024) Figure Global Ready to Drink (RTD) Tea and Coffee Market Volume and Growth Rate Forecast of Canned (2019-2024) Figure Global Ready to Drink (RTD) Tea and Coffee Market Value ($) and Growth Rate Forecast of Glass Bottle (2019-2024) Figure Global Ready to Drink (RTD) Tea and Coffee Market Volume and Growth Rate Forecast of Glass Bottle (2019-2024) Figure Global Ready to Drink (RTD) Tea and Coffee Market Value ($) and Growth Rate Forecast of PET Bottle (2019-2024) Figure Global Ready to Drink (RTD) Tea and Coffee Market Volume and Growth Rate Forecast of PET Bottle (2019-2024) Figure Global Ready to Drink (RTD) Tea and Coffee Market Value ($) and Growth Rate Forecast of Others (2019-2024) Figure Global Ready to Drink (RTD) Tea and Coffee Market Volume and Growth Rate Forecast of Others (2019-2024) Table Global Market Value ($) Forecast by Application (2019-2024) Table Global Market Volume Forecast by Application (2019-2024) Figure Global Ready to Drink (RTD) Tea and Coffee Consumption and Growth Rate of Supermarkets/Hypermarkets (2014-2019) Figure Global Ready to Drink (RTD) Tea and Coffee Consumption and Growth Rate of Specialty Retailers (2014-2019) Figure Global Ready to Drink (RTD) Tea and Coffee Consumption and Growth Rate of Convenience Stores (2014-2019) Figure Global Ready to Drink (RTD) Tea and Coffee Consumption and Growth Rate of E-Commerce (2014-2019) Figure Market Value ($) and Growth Rate Forecast of E-Commerce (2019-2024) Figure Market Volume and Growth Rate Forecast of E-Commerce (2019-2024) Figure North America Market Value ($) and Growth Rate Forecast (2019-2024) Table North America Consumption and Growth Rate Forecast (2019-2024) Figure Europe Market Value ($) and Growth Rate Forecast (2019-2024) Table Europe Consumption and Growth Rate Forecast (2019-2024) Figure China Market Value ($) and Growth Rate Forecast (2019-2024) Table China Consumption and Growth Rate Forecast (2019-2024) Figure Japan Market Value ($) and Growth Rate Forecast (2019-2024) Table Japan Consumption and Growth Rate Forecast (2019-2024) Figure Middle East & Africa Market Value ($) and Growth Rate Forecast (2019-2024) Table Middle East & Africa Consumption and Growth Rate Forecast (2019-2024) Figure India Market Value ($) and Growth Rate Forecast (2019-2024) Table India Consumption and Growth Rate Forecast (2019-2024) Figure South America Market Value ($) and Growth Rate Forecast (2019-2024) Table South America Consumption and Growth Rate Forecast (2019-2024) Figure Industry Resource/Technology/Labor Importance Analysis Table New Entrants SWOT Analysis Table New Project Analysis of Investment Recovery
Inquiry For Buying
Ready to Drink (RTD) Tea and Coffee
Request Sample
Ready to Drink (RTD) Tea and Coffee