Running Belts Market Size, Share, and Trends Analysis Report
CAGR :

| Market Size 2023 (Base Year) | USD 1.41 Billion |
| Market Size 2032 (Forecast Year) | USD 2.58 Billion |
| CAGR | 6.9% |
| Forecast Period | 2024 - 2032 |
| Historical Period | 2018 - 2023 |
Running Belts Market Insights
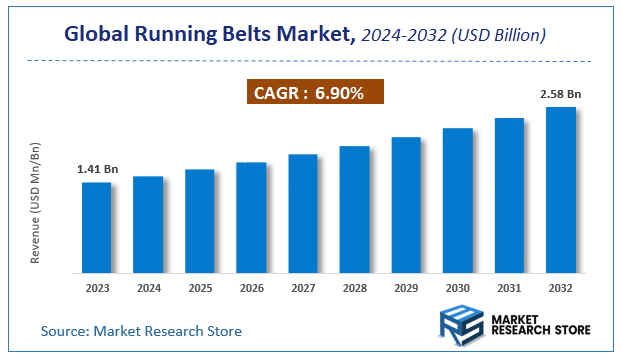
As per the published report by Market Research Store, the Global Running Belts Market size was estimated at USD 1.41 Billion in 2023 and is anticipated to reach reach USD 2.58 Billion by 2032, growing at a projected CAGR of 6.9% during the forecast period 2024-2032. The report provides a detailed analysis of the global Running Belts Market, including market trends, market dynamics, and market opportunities during the forecast period (2024-2032). It delves deeper into several market facets, such as market definition, size, growth, forecast, segmentation, competitive analysis, growth drivers, restraints, financial analysis, SWOT analysis, PORTER’s five force analysis, PESTEL analysis, market share analysis, cost-benefit analysis, challenges, restraints, strategic recommendations, and market players.
To Get more Insights, Request a Free Sample
Running Belts Market: Overview
The growth of the running belts market is fueled by rising global demand across various industries and applications. The report highlights lucrative opportunities, analyzing cost structures, key segments, emerging trends, regional dynamics, and advancements by leading players to provide comprehensive market insights. The running belts market report offers a detailed industry analysis from 2024 to 2032, combining quantitative and qualitative insights. It examines key factors such as pricing, market penetration, GDP impact, industry dynamics, major players, consumer behavior, and socio-economic conditions. Structured into multiple sections, the report provides a comprehensive perspective on the market from all angles.
Key sections of the running belts market report include market segments, outlook, competitive landscape, and company profiles. Market Segments offer in-depth details based on Product Type, Material Type, Capacity, User Demographics, Features, and other relevant classifications to support strategic marketing initiatives. Market Outlook thoroughly analyzes market trends, growth drivers, restraints, opportunities, challenges, Porter’s Five Forces framework, macroeconomic factors, value chain analysis, and pricing trends shaping the market now and in the future. The Competitive Landscape and Company Profiles section highlights major players, their strategies, and market positioning to guide investment and business decisions. The report also identifies innovation trends, new business opportunities, and investment prospects for the forecast period.
Key Highlights:
- As per the analysis shared by our research analyst, the global running belts market is estimated to grow annually at a CAGR of around 6.9% over the forecast period (2024-2032).
- In terms of revenue, the global running belts market size was valued at around USD 1.41 Billion in 2023 and is projected to reach USD 2.58 Billion by 2032.
- The market is projected to grow at a significant rate due to increasing participation in fitness activities, particularly running, coupled with the demand for convenient and hands-free solutions for carrying essentials during workouts.
- Based on the Product Type, the Adjustable Running Belts segment is growing at a high rate and will continue to dominate the global market as per industry projections.
- On the basis of Material Type, the Nylon segment is anticipated to command the largest market share.
- In terms of Capacity, the Single Water Bottle Capacity (500ml) segment is projected to lead the global market.
- By User Demographics, the Beginners segment is predicted to dominate the global market.
- Based on the Features, the Reflective Safety Strips segment is expected to swipe the largest market share.
- Based on region, North America is projected to dominate the global market during the forecast period.
Running Belts Market: Report Scope
This report thoroughly analyzes the running belts market, exploring its historical trends, current state, and future projections. The market estimates presented result from a robust research methodology, incorporating primary research, secondary sources, and expert opinions. These estimates are influenced by the prevailing market dynamics as well as key economic, social, and political factors. Furthermore, the report considers the impact of regulations, government expenditures, and advancements in research and development on the market. Both positive and negative shifts are evaluated to ensure a comprehensive and accurate market outlook.
| Report Attributes | Report Details |
|---|---|
| Report Name | Running Belts Market |
| Market Size in 2023 | USD 1.41 Billion |
| Market Forecast in 2032 | USD 2.58 Billion |
| Growth Rate | CAGR of 6.9% |
| Number of Pages | 193 |
| Key Companies Covered | Amphipod, FuelBelt, Nathan Sports, Ultimate Direction, CamelBak Products, Decathlon, Fitletic, Salomon and The North Face, Jupiter Gear, Osprey Packs |
| Segments Covered | By Product Type, By Material Type, By Capacity, By User Demographics, By Features, and By Region |
| Regions Covered | North America, Europe, Asia Pacific (APAC), Latin America, Middle East, and Africa (MEA) |
| Base Year | 2023 |
| Historical Year | 2018 to 2023 |
| Forecast Year | 2024 to 2032 |
| Customization Scope | Avail customized purchase options to meet your exact research needs. Request For Customization |
Running Belts Market: Dynamics
Key Growth Drivers
The running belts market is primarily driven by the increasing popularity of running and fitness activities worldwide, with more individuals participating in marathons, trail running, and general fitness regimes. The convenience and practicality offered by running belts for carrying essentials like water bottles, smartphones, keys, and energy gels during workouts are major factors fueling demand. The rising awareness of hydration and nutrition during exercise, coupled with the need to keep personal belongings secure and accessible, further contributes to market growth. Additionally, the growing trend of outdoor and adventure sports, where hands-free carrying solutions are essential, is expanding the application of running belts beyond traditional road running.
Restraints
Despite the growing participation in running, the running belts market faces certain restraints. Some runners prefer minimalist approaches and avoid carrying any accessories, opting for handheld bottles or relying on hydration stations during longer runs. Comfort issues, such as chafing or bouncing of the belt, can deter some potential users if the design and fit are not optimal. The availability of alternatives like running vests or specialized shorts and tights with built-in pockets might also limit the exclusive reliance on running belts for carrying items. Furthermore, the perceived need for a running belt might be lower for shorter runs or indoor treadmill workouts.
Opportunities
The running belts market presents various opportunities for innovation and growth. The development of more ergonomic and comfortable belt designs using breathable and lightweight materials can address comfort concerns. Integrating features like secure phone holders with touchscreen compatibility, insulated pockets for water bottles, and reflective elements for enhanced visibility during low-light conditions can add value and appeal to a wider range of runners. The incorporation of smart features, such as fitness trackers or emergency contact information, could also attract tech-savvy consumers. Furthermore, expanding the product line to cater to specific needs like trail running (with larger capacity and more secure storage) or minimalist running (with ultra-lightweight designs) can tap into niche segments. Collaborations with running apparel and gear brands can also enhance market reach and product integration.
Challenges
The running belts market faces challenges related to ensuring a secure and comfortable fit for diverse body types and activities. Preventing bouncing and chafing during intense workouts requires careful design and material selection. Balancing storage capacity with a lightweight and non-obtrusive design can be a significant engineering challenge. Differentiating products based on quality, features, and durability in a market with numerous options is crucial for manufacturers. Addressing concerns about the longevity and washability of running belts is also important for maintaining customer satisfaction. Keeping up with evolving smartphone sizes and runner preferences for carrying essentials requires continuous product development and adaptation.
Running Belts Market: Segmentation Insights
The global running belts market is segmented based on Product Type, Material Type, Capacity, User Demographics, Features, and Region. All the segments of the running belts market have been analyzed based on present & future trends and the market is estimated from 2024 to 2032.
Based on Product Type, the global running belts market is divided into Adjustable Running Belts, Waist Packs with Water Bottle, Hydration Vests, Runner's Backpacks with Hydration Bladders, Specialized Running Belts for Trailers.
On the basis of Material Type, the global running belts market is bifurcated into Nylon, Polyester, Neoprene, Canvas, Eco-friendly Materials.
In terms of Capacity, the global running belts market is categorized into Single Water Bottle Capacity (500ml), Double Water Bottle Capacity (1L), Large Capacity Belts (1.5L and above), Integrated Hydration Packs, Expandable Capacity Designs.
Based on User Demographics, the global running belts market is split into Beginners, Intermediate Runners, Marathon Runners, Trail Runners, Fitness Enthusiasts.
By Features, the global running belts market is divided into Reflective Safety Strips, Built-in Storage Pockets, Adjustable Sizing, Waterproof Design, Quick-Dry and Breathable Fabrics.
Running Belts Market: Regional Insights
The Running Belts Market is currently dominated by North America, which holds over 42% of the global market share as of 2024, driven by a strong fitness culture, high disposable income, and widespread adoption of running as a primary exercise. The United States leads the region due to its large base of recreational and professional runners, coupled with robust e-commerce penetration for sports accessories. Europe follows as the second-largest market, with significant demand in Germany, the UK, and France, fueled by growing health consciousness and participation in marathons. The Asia-Pacific region, particularly Japan and Australia, is witnessing rapid growth due to increasing fitness trends and urbanization, though it remains behind North America in overall market size. Innovation in lightweight, moisture-wicking materials and smart belts with GPS tracking further solidify North America's dominance in this niche athletic gear segment.
Running Belts Market: Competitive Landscape
The running belts market Report offers a thorough analysis of both established and emerging players within the market. It includes a detailed list of key companies, categorized based on the types of products they offer and other relevant factors. The report also highlights the market entry year for each player, providing further context for the research analysis.
The "Global Running Belts Market" study offers valuable insights, focusing on the global market landscape, with an emphasis on major industry players such as;
- Amphipod
- FuelBelt
- Nathan Sports
- Ultimate Direction
- CamelBak Products
- Decathlon
- Fitletic
- Salomon and The North Face
- Jupiter Gear
- Osprey Packs
The Global Running Belts Market is Segmented as Follows:
By Product Type
- Adjustable Running Belts
- Waist Packs with Water Bottle
- Hydration Vests
- Runner's Backpacks with Hydration Bladders
- Specialized Running Belts for Trailers
By Material Type
- Nylon
- Polyester
- Neoprene
- Canvas
- Eco-friendly Materials
By Capacity
- Single Water Bottle Capacity (500ml)
- Double Water Bottle Capacity (1L)
- Large Capacity Belts (1.5L and above)
- Integrated Hydration Packs
- Expandable Capacity Designs
By User Demographics
- Beginners
- Intermediate Runners
- Marathon Runners
- Trail Runners
- Fitness Enthusiasts
By Features
- Reflective Safety Strips
- Built-in Storage Pockets
- Adjustable Sizing
- Waterproof Design
- Quick-Dry and Breathable Fabrics
By Region
- North America
- The U.S.
- Canada
- Mexico
- Europe
- France
- The UK
- Spain
- Germany
- Italy
- Rest of Europe
- Asia Pacific
- China
- Japan
- India
- Australia
- South Korea
- Rest of Asia Pacific
- The Middle East & Africa
- Saudi Arabia
- UAE
- Egypt
- Kuwait
- South Africa
- Rest of the Middle East & Africa
- Latin America
- Brazil
- Argentina
- Rest of Latin America
Market Evolution
This section evaluates the market position of the product or service by examining its development pathway and competitive dynamics. It provides a detailed overview of the product's growth stages, including the early (historical) phase, the mid-stage, and anticipated future advancements influenced by innovation and emerging technologies.
Porter’s Analysis
Porter’s Five Forces framework offers a strategic lens for assessing competitor behavior and the positioning of key players in the running belts industry. This section explores the external factors shaping competitive dynamics and influencing market strategies in the years ahead. The analysis focuses on five critical forces:
- Competitive Rivalry
- Threat of New Entrants
- Threat of Substitutes
- Supplier Bargaining Power
- Buyer Bargaining Power
Value Chain & Market Attractiveness Analysis
The value chain analysis helps businesses optimize operations by mapping the product flow from suppliers to end consumers, identifying opportunities to streamline processes and gain a competitive edge. Segment-wise market attractiveness analysis evaluates key dimensions like product categories, demographics, and regions, assessing growth potential, market size, and profitability. This enables businesses to focus resources on high-potential segments for better ROI and long-term value.
PESTEL Analysis
PESTEL analysis is a powerful tool in market research reports that enhances market understanding by systematically examining the external macro-environmental factors influencing a business or industry. The acronym stands for Political, Economic, Social, Technological, Environmental, and Legal factors. By evaluating these dimensions, PESTEL analysis provides a comprehensive overview of the broader context within which a market operates, helping businesses identify potential opportunities and threats.
- Political factors assess government policies, stability, trade regulations, and political risks that could impact market operations.
- Economic factors examine variables like inflation, exchange rates, economic growth, and consumer spending power to determine market viability.
- Social factors explore cultural trends, demographics, and lifestyle changes that shape consumer behavior and preferences.
- Technological factors evaluate innovation, R&D, and technological advancements affecting product development and operational efficiencies.
- Environmental factors focus on sustainability, climate change impacts, and eco-friendly practices shaping market trends.
- Legal factors address compliance requirements, industry regulations, and intellectual property laws impacting market entry and operations.
Import-Export Analysis & Pricing Analysis
An import-export analysis is vital for market research, revealing global trade dynamics, trends, and opportunities. It examines trade volumes, product categories, and regional competitiveness, offering insights into supply chains and market demand. This section also analyzes past and future pricing trends, helping businesses optimize strategies and enabling consumers to assess product value effectively.
Running Belts Market: Company Profiles
The report identifies key players in the running belts market through a competitive landscape and company profiles, evaluating their offerings, financial performance, strategies, and market positioning. It includes a SWOT analysis of the top 3-5 companies, assessing strengths, weaknesses, opportunities, and threats. The competitive landscape highlights rankings, recent activities (mergers, acquisitions, partnerships, product launches), and regional footprints using the Ace matrix. Customization is available to meet client-specific needs.
Regional & Industry Footprint
This section details the geographic reach, sales networks, and market penetration of companies profiled in the running belts report, showcasing their operations and distribution across regions. It analyzes the alignment of companies with specific industry verticals, highlighting the industries they serve and the scope of their products and services within those sectors.
Ace Matrix
This section categorizes companies into four distinct groups—Active, Cutting Edge, Innovator, and Emerging—based on their product and business strategies. The evaluation of product strategy focuses on aspects such as the range and depth of offerings, commitment to innovation, product functionalities, and scalability. Key elements like global reach, sector coverage, strategic acquisitions, and long-term growth plans are considered for business strategy. This analysis provides a detailed view of companies' position within the market and highlights their potential for future growth and development.
Research Methodology
The qualitative and quantitative insights for the running belts market are derived through a multi-faceted research approach, combining input from subject matter experts, primary research, and secondary data sources. Primary research includes gathering critical information via face-to-face or telephonic interviews, surveys, questionnaires, and feedback from industry professionals, key opinion leaders (KOLs), and customers. Regular interviews with industry experts are conducted to deepen the analysis and reinforce the existing data, ensuring a robust and well-rounded market understanding.
Secondary research for this report was carried out by the Market Research Store team, drawing on a variety of authoritative sources, such as:
- Official company websites, annual reports, financial statements, investor presentations, and SEC filings
- Internal and external proprietary databases, as well as relevant patent and regulatory databases
- Government publications, national statistical databases, and industry-specific market reports
- Media coverage, including news articles, press releases, and webcasts about market participants
- Paid industry databases for detailed market insights
Market Research Store conducted in-depth consultations with various key opinion leaders in the industry, including senior executives from top companies and regional leaders from end-user organizations. This effort aimed to gather critical insights on factors such as the market share of dominant brands in specific countries and regions, along with pricing strategies for products and services.
To determine total sales data, the research team conducted primary interviews across multiple countries with influential stakeholders, including:
- Distributors
- Marketing, Brand, and Product Managers
- Procurement and Production Managers
- Sales and Regional Sales Managers, Country Managers
- Technical Specialists
- C-Level Executives
These subject matter experts, with their extensive industry experience, helped validate and refine the findings. For secondary research, data were sourced from a wide range of materials, including online resources, company annual reports, industry publications, research papers, association reports, and government websites. These various sources provide a comprehensive and well-rounded perspective on the market.
Frequently Asked Questions
Table Of Content
List of Tables and Figures Figure Product Picture of Running Belts Table Product Specification of Running Belts Figure Market Concentration Ratio and Market Maturity Analysis of Running Belts Figure Global Running Belts Value ($) and Growth Rate from 2014-2024 Table Different Types of Running Belts Figure Global Running Belts Value ($) Segment by Type from 2014-2019 Figure Small Picture Figure Medium Picture Figure Large Picture Table Different Applications of Running Belts Figure Global Running Belts Value ($) Segment by Applications from 2014-2019 Figure Profession Player Picture Figure Amateur Player Picture Table Research Regions of Running Belts Figure North America Running Belts Production Value ($) and Growth Rate (2014-2019) Figure Europe Running Belts Production Value ($) and Growth Rate (2014-2019) Table China Running Belts Production Value ($) and Growth Rate (2014-2019) Table Japan Running Belts Production Value ($) and Growth Rate (2014-2019) Table Middle East & Africa Running Belts Production Value ($) and Growth Rate (2014-2019) Table India Running Belts Production Value ($) and Growth Rate (2014-2019) Table South America Running Belts Production Value ($) and Growth Rate (2014-2019) Table Emerging Countries of Running Belts Table Growing Market of Running Belts Figure Industry Chain Analysis of Running Belts Table Upstream Raw Material Suppliers of Running Belts with Contact Information Table Major Players Manufacturing Base and Market Share ($) of Running Belts in 2018 Table Major Players Running Belts Product Types in 2018 Figure Production Process of Running Belts Figure Manufacturing Cost Structure of Running Belts Figure Channel Status of Running Belts Table Major Distributors of Running Belts with Contact Information Table Major Downstream Buyers of Running Belts with Contact Information Table Global Running Belts Value ($) by Type (2014-2019) Table Global Running Belts Value ($) Share by Type (2014-2019) Figure Global Running Belts Value ($) Share by Type (2014-2019) Table Global Running Belts Production by Type (2014-2019) Table Global Running Belts Production Share by Type (2014-2019) Figure Global Running Belts Production Share by Type (2014-2019) Figure Global Running Belts Value ($) and Growth Rate of Small Figure Global Running Belts Value ($) and Growth Rate of Medium Figure Global Running Belts Value ($) and Growth Rate of Large Figure Global Running Belts Price by Type (2014-2019) Table Global Running Belts Consumption by Application (2014-2019) Table Global Running Belts Consumption Market Share by Application (2014-2019) Figure Global Running Belts Consumption Market Share by Application (2014-2019) Table Downstream Buyers Introduction by Application Figure Global Running Belts Consumption and Growth Rate of Profession Player (2014-2019) Figure Global Running Belts Consumption and Growth Rate of Amateur Player (2014-2019) Table Global Running Belts Value ($) by Region (2014-2019) Table Global Running Belts Value ($) Market Share by Region (2014-2019) Figure Global Running Belts Value ($) Market Share by Region (2014-2019) Table Global Running Belts Production by Region (2014-2019) Table Global Running Belts Production Market Share by Region (2014-2019) Figure Global Running Belts Production Market Share by Region (2014-2019) Table Global Running Belts Production, Value ($), Price and Gross Margin (2014-2019) Table North America Running Belts Production, Value ($), Price and Gross Margin (2014-2019) Table Europe Running Belts Production, Value ($), Price and Gross Margin (2014-2019) Table China Running Belts Production, Value ($), Price and Gross Margin (2014-2019) Table Japan Running Belts Production, Value ($), Price and Gross Margin (2014-2019) Table Middle East & Africa Running Belts Production, Value ($), Price and Gross Margin (2014-2019) Table India Running Belts Production, Value ($), Price and Gross Margin (2014-2019) Table South America Running Belts Production, Value ($), Price and Gross Margin (2014-2019) Table Global Running Belts Consumption by Regions (2014-2019) Figure Global Running Belts Consumption Share by Regions (2014-2019) Table North America Running Belts Production, Consumption, Export, Import (2014-2019) Table Europe Running Belts Production, Consumption, Export, Import (2014-2019) Table China Running Belts Production, Consumption, Export, Import (2014-2019) Table Japan Running Belts Production, Consumption, Export, Import (2014-2019) Table Middle East & Africa Running Belts Production, Consumption, Export, Import (2014-2019) Table India Running Belts Production, Consumption, Export, Import (2014-2019) Table South America Running Belts Production, Consumption, Export, Import (2014-2019) Figure North America Running Belts Production and Growth Rate Analysis Figure North America Running Belts Consumption and Growth Rate Analysis Figure North America Running Belts SWOT Analysis Figure Europe Running Belts Production and Growth Rate Analysis Figure Europe Running Belts Consumption and Growth Rate Analysis Figure Europe Running Belts SWOT Analysis Figure China Running Belts Production and Growth Rate Analysis Figure China Running Belts Consumption and Growth Rate Analysis Figure China Running Belts SWOT Analysis Figure Japan Running Belts Production and Growth Rate Analysis Figure Japan Running Belts Consumption and Growth Rate Analysis Figure Japan Running Belts SWOT Analysis Figure Middle East & Africa Running Belts Production and Growth Rate Analysis Figure Middle East & Africa Running Belts Consumption and Growth Rate Analysis Figure Middle East & Africa Running Belts SWOT Analysis Figure India Running Belts Production and Growth Rate Analysis Figure India Running Belts Consumption and Growth Rate Analysis Figure India Running Belts SWOT Analysis Figure South America Running Belts Production and Growth Rate Analysis Figure South America Running Belts Consumption and Growth Rate Analysis Figure South America Running Belts SWOT Analysis Figure Top 3 Market Share of Running Belts Companies Figure Top 6 Market Share of Running Belts Companies Table Mergers, Acquisitions and Expansion Analysis Table Company Profiles Table Product Introduction Table Running Buddy Production, Value ($), Price, Gross Margin 2014-2019 Figure Running Buddy Production and Growth Rate Figure Running Buddy Value ($) Market Share 2014-2019 Figure Running Buddy Market Share of Running Belts Segmented by Region in 2018 Table Company Profiles Table Product Introduction Table Giosport Production, Value ($), Price, Gross Margin 2014-2019 Figure Giosport Production and Growth Rate Figure Giosport Value ($) Market Share 2014-2019 Figure Giosport Market Share of Running Belts Segmented by Region in 2018 Table Company Profiles Table Product Introduction Table Nathan Production, Value ($), Price, Gross Margin 2014-2019 Figure Nathan Production and Growth Rate Figure Nathan Value ($) Market Share 2014-2019 Figure Nathan Market Share of Running Belts Segmented by Region in 2018 Table Company Profiles Table Product Introduction Table FlipBelt Production, Value ($), Price, Gross Margin 2014-2019 Figure FlipBelt Production and Growth Rate Figure FlipBelt Value ($) Market Share 2014-2019 Figure FlipBelt Market Share of Running Belts Segmented by Region in 2018 Table Company Profiles Table Product Introduction Table Nike Production, Value ($), Price, Gross Margin 2014-2019 Figure Nike Production and Growth Rate Figure Nike Value ($) Market Share 2014-2019 Figure Nike Market Share of Running Belts Segmented by Region in 2018 Table Company Profiles Table Product Introduction Table Amphipod Production, Value ($), Price, Gross Margin 2014-2019 Figure Amphipod Production and Growth Rate Figure Amphipod Value ($) Market Share 2014-2019 Figure Amphipod Market Share of Running Belts Segmented by Region in 2018 Table Company Profiles Table Product Introduction Table Griffin Technology Production, Value ($), Price, Gross Margin 2014-2019 Figure Griffin Technology Production and Growth Rate Figure Griffin Technology Value ($) Market Share 2014-2019 Figure Griffin Technology Market Share of Running Belts Segmented by Region in 2018 Table Company Profiles Table Product Introduction Table SPIbelt Production, Value ($), Price, Gross Margin 2014-2019 Figure SPIbelt Production and Growth Rate Figure SPIbelt Value ($) Market Share 2014-2019 Figure SPIbelt Market Share of Running Belts Segmented by Region in 2018 Table Global Running Belts Market Value ($) Forecast, by Type Table Global Running Belts Market Volume Forecast, by Type Figure Global Running Belts Market Value ($) and Growth Rate Forecast of Small (2019-2024) Figure Global Running Belts Market Volume and Growth Rate Forecast of Small (2019-2024) Figure Global Running Belts Market Value ($) and Growth Rate Forecast of Medium (2019-2024) Figure Global Running Belts Market Volume and Growth Rate Forecast of Medium (2019-2024) Figure Global Running Belts Market Value ($) and Growth Rate Forecast of Large (2019-2024) Figure Global Running Belts Market Volume and Growth Rate Forecast of Large (2019-2024) Table Global Market Value ($) Forecast by Application (2019-2024) Table Global Market Volume Forecast by Application (2019-2024) Figure Global Running Belts Consumption and Growth Rate of Profession Player (2014-2019) Figure Global Running Belts Consumption and Growth Rate of Amateur Player (2014-2019) Figure Market Value ($) and Growth Rate Forecast of Amateur Player (2019-2024) Figure Market Volume and Growth Rate Forecast of Amateur Player (2019-2024) Figure North America Market Value ($) and Growth Rate Forecast (2019-2024) Table North America Consumption and Growth Rate Forecast (2019-2024) Figure Europe Market Value ($) and Growth Rate Forecast (2019-2024) Table Europe Consumption and Growth Rate Forecast (2019-2024) Figure China Market Value ($) and Growth Rate Forecast (2019-2024) Table China Consumption and Growth Rate Forecast (2019-2024) Figure Japan Market Value ($) and Growth Rate Forecast (2019-2024) Table Japan Consumption and Growth Rate Forecast (2019-2024) Figure Middle East & Africa Market Value ($) and Growth Rate Forecast (2019-2024) Table Middle East & Africa Consumption and Growth Rate Forecast (2019-2024) Figure India Market Value ($) and Growth Rate Forecast (2019-2024) Table India Consumption and Growth Rate Forecast (2019-2024) Figure South America Market Value ($) and Growth Rate Forecast (2019-2024) Table South America Consumption and Growth Rate Forecast (2019-2024) Figure Industry Resource/Technology/Labor Importance Analysis Table New Entrants SWOT Analysis Table New Project Analysis of Investment Recovery
Inquiry For Buying
Running Belts
Request Sample
Running Belts