Sandalwood Market Size, Share, and Trends Analysis Report
CAGR :

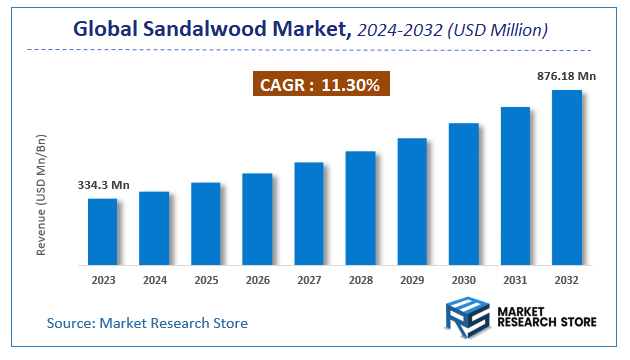
| Market Size 2023 (Base Year) | USD 334.3 Million |
| Market Size 2032 (Forecast Year) | USD 876.18 Million |
| CAGR | 11.3% |
| Forecast Period | 2024 - 2032 |
| Historical Period | 2018 - 2023 |
Sandalwood Market Insights
A latest report by Market Research Store estimates that the Global Sandalwood Market was valued at USD 334.3 Million in 2023 and is expected to reach USD 876.18 Million by 2032, with a CAGR of 11.3% during the forecast period 2024-2032. The report Sandalwood Market overview, growth factors, restraints, opportunities, segmentation, key developments, competitive landscape, consumer insights, and market growth forecast in terms of value or volume. These structured details offer an all-inclusive market overview, providing valuable insights for investment decisions, business decisions, strategic planning, and competitive analysis.
To Get more Insights, Request a Free Sample
Sandalwood Market: Overview
The growth of the sandalwood market is fueled by rising global demand across various industries and applications. The report highlights lucrative opportunities, analyzing cost structures, key segments, emerging trends, regional dynamics, and advancements by leading players to provide comprehensive market insights. The sandalwood market report offers a detailed industry analysis from 2024 to 2032, combining quantitative and qualitative insights. It examines key factors such as pricing, market penetration, GDP impact, industry dynamics, major players, consumer behavior, and socio-economic conditions. Structured into multiple sections, the report provides a comprehensive perspective on the market from all angles.
Key sections of the sandalwood market report include market segments, outlook, competitive landscape, and company profiles. Market Segments offer in-depth details based on Type, Application, and other relevant classifications to support strategic marketing initiatives. Market Outlook thoroughly analyzes market trends, growth drivers, restraints, opportunities, challenges, Porter’s Five Forces framework, macroeconomic factors, value chain analysis, and pricing trends shaping the market now and in the future. The Competitive Landscape and Company Profiles section highlights major players, their strategies, and market positioning to guide investment and business decisions. The report also identifies innovation trends, new business opportunities, and investment prospects for the forecast period.
Key Highlights:
- As per the analysis shared by our research analyst, the global sandalwood market is estimated to grow annually at a CAGR of around 11.3% over the forecast period (2024-2032).
- In terms of revenue, the global sandalwood market size was valued at around USD 334.3 Million in 2023 and is projected to reach USD 876.18 Million by 2032.
- The market is projected to grow at a significant rate due to rising demand in aromatherapy and cosmetics, its use in traditional medicine, luxury fragrances, and sustainable cultivation efforts amid declining natural reserves.
- Based on the Type, the Indian Sandalwood segment is growing at a high rate and will continue to dominate the global market as per industry projections.
- On the basis of Application, the Personal Care segment is anticipated to command the largest market share.
- Based on region, Asia-Pacific is projected to dominate the global market during the forecast period.
Sandalwood Market: Report Scope
This report thoroughly analyzes the sandalwood market, exploring its historical trends, current state, and future projections. The market estimates presented result from a robust research methodology, incorporating primary research, secondary sources, and expert opinions. These estimates are influenced by the prevailing market dynamics as well as key economic, social, and political factors. Furthermore, the report considers the impact of regulations, government expenditures, and advancements in research and development on the market. Both positive and negative shifts are evaluated to ensure a comprehensive and accurate market outlook.
| Report Attributes | Report Details |
|---|---|
| Report Name | Sandalwood Market |
| Market Size in 2023 | USD 334.3 Million |
| Market Forecast in 2032 | USD 876.18 Million |
| Growth Rate | CAGR of 11.3% |
| Number of Pages | 195 |
| Key Companies Covered | Quintis, FPC, WA Sandalwood Plantations, Australian Sandalwood, Santanol Group, KS&DL, Sandalwood Forest |
| Segments Covered | By Type, By Application, and By Region |
| Regions Covered | North America, Europe, Asia Pacific (APAC), Latin America, Middle East, and Africa (MEA) |
| Base Year | 2023 |
| Historical Year | 2018 to 2023 |
| Forecast Year | 2024 to 2032 |
| Customization Scope | Avail customized purchase options to meet your exact research needs. Request For Customization |
Sandalwood Market: Dynamics
The sandalwood market is primarily driven by the persistent high demand for its fragrant heartwood and essential oil in various applications, including perfumes, cosmetics, aromatherapy, traditional medicines (especially in Ayurveda and Traditional Chinese Medicine), and religious ceremonies. The unique aroma of sandalwood, known for its calming and grounding properties, makes it a sought-after ingredient globally. Increasing consumer preference for natural and plant-based products in personal care and wellness industries further fuels this demand. The limited natural supply of high-quality sandalwood, particularly the Indian white sandalwood (Santalum album), also contributes to its high value and sustained market interest. Growing awareness of aromatherapy and its benefits has further expanded the use of sandalwood essential oil.
Restraints
Despite the strong demand, the sandalwood market faces significant restraints. The long gestation period for sandalwood trees to mature and develop commercially valuable heartwood (typically several decades) severely limits the immediate supply and responsiveness to market demand. Illegal logging and smuggling of sandalwood, particularly the highly prized Indian variety, pose a major threat to sustainable sourcing and market stability. Strict regulations and trade restrictions imposed by some governments to protect dwindling natural resources can also complicate the supply chain and increase costs. The variability in oil content and quality depending on the species, age, and growing conditions of the trees adds another layer of complexity to the market. The emergence of synthetic sandalwood fragrance alternatives also presents competition, although they often lack the depth and complexity of natural sandalwood oil.
Opportunities
The sandalwood market has considerable opportunities for sustainable growth and development. The increasing focus on sustainable forestry practices and the promotion of sandalwood cultivation in plantations offer a way to augment natural supplies and combat illegal logging. Technological advancements in sustainable harvesting and oil extraction methods can improve efficiency and reduce environmental impact. The growing demand for natural ingredients in high-end perfumes and cosmetics provides a premium market for ethically sourced, high-quality sandalwood oil. Research into faster-growing and higher oil-yielding sandalwood varieties could help bridge the supply-demand gap. Furthermore, promoting the cultivation of sandalwood in new regions with suitable climates could diversify supply sources and reduce reliance on traditional growing areas. The development of value-added products derived from sandalwood, beyond just the oil and heartwood, such as sandalwood powder for incense and skincare, also presents opportunities.
Challenges
The sandalwood market faces several critical challenges. Combating illegal logging and ensuring the traceability of sandalwood products throughout the supply chain remain paramount for conservation efforts and market integrity. Protecting sandalwood plantations from pests, diseases, and theft requires significant investment and effective management strategies. Establishing and enforcing consistent quality standards for sandalwood oil and heartwood across different regions and producers is crucial for maintaining consumer trust. Educating consumers about the importance of sustainable sourcing and the differences between natural and synthetic sandalwood fragrances is also vital. Addressing the socio-economic issues related to sandalwood cultivation and trade, ensuring fair benefits for local communities involved in its production, is essential for long-term sustainability and ethical sourcing. Balancing the high demand with the limited natural supply and the long growth cycle of sandalwood trees requires a multi-faceted approach involving conservation, sustainable cultivation, and technological innovation.
Sandalwood Market: Segmentation Insights
The global sandalwood market is segmented based on Type, Application, and Region. All the segments of the sandalwood market have been analyzed based on present & future trends, and the market is estimated from 2024 to 2032.
Based on Type, the global sandalwood market is divided into Indian Sandalwood, Australian Sandalwood, and Others. These types vary in aroma, oil concentration, and traditional usage, with Indian sandalwood often considered the most premium due to its rich fragrance and high oil content.
On the basis of Application, the global sandalwood market is bifurcated into Personal Care, Aromatherapy, Pharmaceuticals, Sculpture, Furniture, and Others. These applications highlight sandalwood’s versatility across wellness, beauty, medicinal, and artistic domains.
Sandalwood Market: Regional Insights
The global sandalwood market is overwhelmingly dominated by the Asia-Pacific (APAC) region, which accounts for over 70% of both production and consumption (2023–24 data). India remains the historic leader in sandalwood oil production, though strict regulations protect its endangered native species. Australia has emerged as the world's largest plantation producer, supplying 60% of global premium-grade sandalwood, while Indonesia dominates the lower-cost segment. The market is driven by insatiable demand from China's perfume and traditional medicine industries (40% of global imports) and India's religious/ayurvedic sectors.
North America and Europe show strong growth (CAGR 8.3%) in luxury fragrances and skincare, but remain price-sensitive to APAC's supply constraints. The market faces critical sustainability challenges, with plantation sandalwood now representing 85% of legal supply.
Sandalwood Market: Competitive Landscape
The sandalwood market report offers a thorough analysis of both established and emerging players within the market. It includes a detailed list of key companies, categorized based on the types of products they offer and other relevant factors. The report also highlights the market entry year for each player, providing further context for the research analysis.
The "Global Sandalwood Market" study offers valuable insights, focusing on the global market landscape, with an emphasis on major industry players such as;
- Quintis
- FPC
- WA Sandalwood Plantations
- Australian Sandalwood
- Santanol Group
- KS&DL
- Sandalwood Forest
The Global Sandalwood Market is Segmented as Follows:
By Type
- Indian Sandalwood
- Australian Sandalwood
- Others
By Application
- Personal Care
- Aromatherapy
- Pharmaceuticals
- Sculpture
- Furniture
- Others
By Region
- North America
- The U.S.
- Canada
- Mexico
- Europe
- France
- The UK
- Spain
- Germany
- Italy
- Rest of Europe
- Asia Pacific
- China
- Japan
- India
- Australia
- South Korea
- Rest of Asia Pacific
- The Middle East & Africa
- Saudi Arabia
- UAE
- Egypt
- Kuwait
- South Africa
- Rest of the Middle East & Africa
- Latin America
- Brazil
- Argentina
- Rest of Latin America
Market Evolution
This section evaluates the market position of the product or service by examining its development pathway and competitive dynamics. It provides a detailed overview of the product's growth stages, including the early (historical) phase, the mid-stage, and anticipated future advancements influenced by innovation and emerging technologies.
Porter’s Analysis
Porter’s Five Forces framework offers a strategic lens for assessing competitor behavior and the positioning of key players in the sandalwood industry. This section explores the external factors shaping competitive dynamics and influencing market strategies in the years ahead. The analysis focuses on five critical forces:
- Competitive Rivalry
- Threat of New Entrants
- Threat of Substitutes
- Supplier Bargaining Power
- Buyer Bargaining Power
Value Chain & Market Attractiveness Analysis
The value chain analysis helps businesses optimize operations by mapping the product flow from suppliers to end consumers, identifying opportunities to streamline processes and gain a competitive edge. Segment-wise market attractiveness analysis evaluates key dimensions like product categories, demographics, and regions, assessing growth potential, market size, and profitability. This enables businesses to focus resources on high-potential segments for better ROI and long-term value.
PESTEL Analysis
PESTEL analysis is a powerful tool in market research reports that enhances market understanding by systematically examining the external macro-environmental factors influencing a business or industry. The acronym stands for Political, Economic, Social, Technological, Environmental, and Legal factors. By evaluating these dimensions, PESTEL analysis provides a comprehensive overview of the broader context within which a market operates, helping businesses identify potential opportunities and threats.
- Political factors assess government policies, stability, trade regulations, and political risks that could impact market operations.
- Economic factors examine variables like inflation, exchange rates, economic growth, and consumer spending power to determine market viability.
- Social factors explore cultural trends, demographics, and lifestyle changes that shape consumer behavior and preferences.
- Technological factors evaluate innovation, R&D, and technological advancements affecting product development and operational efficiencies.
- Environmental factors focus on sustainability, climate change impacts, and eco-friendly practices shaping market trends.
- Legal factors address compliance requirements, industry regulations, and intellectual property laws impacting market entry and operations.
Import-Export Analysis & Pricing Analysis
An import-export analysis is vital for market research, revealing global trade dynamics, trends, and opportunities. It examines trade volumes, product categories, and regional competitiveness, offering insights into supply chains and market demand. This section also analyzes past and future pricing trends, helping businesses optimize strategies and enabling consumers to assess product value effectively.
Sandalwood Market: Company Profiles
The report identifies key players in the sandalwood market through competitive landscape and company profiles, evaluating their offerings, financial performance, strategies, and market positioning. It includes a SWOT analysis of the top 3-5 companies, assessing strengths, weaknesses, opportunities, and threats. The competitive landscape highlights rankings, recent activities (mergers, acquisitions, partnerships, product launches), and regional footprints using the Ace matrix. Customization is available to meet client-specific needs.
Regional & Industry Footprint
This section details the geographic reach, sales networks, and market penetration of companies profiled in the sandalwood report, showcasing their operations and distribution across regions. It analyzes the alignment of companies with specific industry verticals, highlighting the industries they serve and the scope of their products and services within those sectors.
Ace Matrix
This section categorizes companies into four distinct groups—Active, Cutting Edge, Innovator, and Emerging—based on their product and business strategies. The evaluation of product strategy focuses on aspects such as the range and depth of offerings, commitment to innovation, product functionalities, and scalability. Key elements like global reach, sector coverage, strategic acquisitions, and long-term growth plans are considered for business strategy. This analysis provides a detailed view of companies' position within the market and highlights their potential for future growth and development.
Research Methodology
The qualitative and quantitative insights for the sandalwood market are derived through a multi-faceted research approach, combining input from subject matter experts, primary research, and secondary data sources. Primary research includes gathering critical information via face-to-face or telephonic interviews, surveys, questionnaires, and feedback from industry professionals, key opinion leaders (KOLs), and customers. Regular interviews with industry experts are conducted to deepen the analysis and reinforce the existing data, ensuring a robust and well-rounded market understanding.
Secondary research for this report was carried out by the Market Research Store team, drawing on a variety of authoritative sources, such as:
- Official company websites, annual reports, financial statements, investor presentations, and SEC filings
- Internal and external proprietary databases, as well as relevant patent and regulatory databases
- Government publications, national statistical databases, and industry-specific market reports
- Media coverage, including news articles, press releases, and webcasts about market participants
- Paid industry databases for detailed market insights
Market Research Store conducted in-depth consultations with various key opinion leaders in the industry, including senior executives from top companies and regional leaders from end-user organizations. This effort aimed to gather critical insights on factors such as the market share of dominant brands in specific countries and regions, along with pricing strategies for products and services.
To determine total sales data, the research team conducted primary interviews across multiple countries with influential stakeholders, including:
- Distributors
- Marketing, Brand, and Product Managers
- Procurement and Production Managers
- Sales and Regional Sales Managers, Country Managers
- Technical Specialists
- C-Level Executives
These subject matter experts, with their extensive industry experience, helped validate and refine the findings. For secondary research, data was sourced from a wide range of materials, including online resources, company annual reports, industry publications, research papers, association reports, and government websites. These various sources provide a comprehensive and well-rounded perspective on the market.
Frequently Asked Questions
Table Of Content
List of Tables and Figures Figure Product Picture of Sandalwood Table Product Specification of Sandalwood Figure Market Concentration Ratio and Market Maturity Analysis of Sandalwood Figure Global Sandalwood Value ($) and Growth Rate from 2014-2024 Table Different Types of Sandalwood Figure Global Sandalwood Value ($) Segment by Type from 2014-2019 Figure Santalum paniculatum Picture Figure Santalum spicatum Picture Figure Santalum album Picture Table Different Applications of Sandalwood Figure Global Sandalwood Value ($) Segment by Applications from 2014-2019 Figure Sandalwood Oil Picture Figure Sandalwood Wood Picture Table Research Regions of Sandalwood Figure North America Sandalwood Production Value ($) and Growth Rate (2014-2019) Figure Europe Sandalwood Production Value ($) and Growth Rate (2014-2019) Table China Sandalwood Production Value ($) and Growth Rate (2014-2019) Table Japan Sandalwood Production Value ($) and Growth Rate (2014-2019) Table Middle East & Africa Sandalwood Production Value ($) and Growth Rate (2014-2019) Table India Sandalwood Production Value ($) and Growth Rate (2014-2019) Table South America Sandalwood Production Value ($) and Growth Rate (2014-2019) Table Emerging Countries of Sandalwood Table Growing Market of Sandalwood Figure Industry Chain Analysis of Sandalwood Table Upstream Raw Material Suppliers of Sandalwood with Contact Information Table Major Players Manufacturing Base and Market Share ($) of Sandalwood in 2018 Table Major Players Sandalwood Product Types in 2018 Figure Production Process of Sandalwood Figure Manufacturing Cost Structure of Sandalwood Figure Channel Status of Sandalwood Table Major Distributors of Sandalwood with Contact Information Table Major Downstream Buyers of Sandalwood with Contact Information Table Global Sandalwood Value ($) by Type (2014-2019) Table Global Sandalwood Value ($) Share by Type (2014-2019) Figure Global Sandalwood Value ($) Share by Type (2014-2019) Table Global Sandalwood Production by Type (2014-2019) Table Global Sandalwood Production Share by Type (2014-2019) Figure Global Sandalwood Production Share by Type (2014-2019) Figure Global Sandalwood Value ($) and Growth Rate of Santalum paniculatum Figure Global Sandalwood Value ($) and Growth Rate of Santalum spicatum Figure Global Sandalwood Value ($) and Growth Rate of Santalum album Figure Global Sandalwood Price by Type (2014-2019) Table Global Sandalwood Consumption by Application (2014-2019) Table Global Sandalwood Consumption Market Share by Application (2014-2019) Figure Global Sandalwood Consumption Market Share by Application (2014-2019) Table Downstream Buyers Introduction by Application Figure Global Sandalwood Consumption and Growth Rate of Sandalwood Oil (2014-2019) Figure Global Sandalwood Consumption and Growth Rate of Sandalwood Wood (2014-2019) Table Global Sandalwood Value ($) by Region (2014-2019) Table Global Sandalwood Value ($) Market Share by Region (2014-2019) Figure Global Sandalwood Value ($) Market Share by Region (2014-2019) Table Global Sandalwood Production by Region (2014-2019) Table Global Sandalwood Production Market Share by Region (2014-2019) Figure Global Sandalwood Production Market Share by Region (2014-2019) Table Global Sandalwood Production, Value ($), Price and Gross Margin (2014-2019) Table North America Sandalwood Production, Value ($), Price and Gross Margin (2014-2019) Table Europe Sandalwood Production, Value ($), Price and Gross Margin (2014-2019) Table China Sandalwood Production, Value ($), Price and Gross Margin (2014-2019) Table Japan Sandalwood Production, Value ($), Price and Gross Margin (2014-2019) Table Middle East & Africa Sandalwood Production, Value ($), Price and Gross Margin (2014-2019) Table India Sandalwood Production, Value ($), Price and Gross Margin (2014-2019) Table South America Sandalwood Production, Value ($), Price and Gross Margin (2014-2019) Table Global Sandalwood Consumption by Regions (2014-2019) Figure Global Sandalwood Consumption Share by Regions (2014-2019) Table North America Sandalwood Production, Consumption, Export, Import (2014-2019) Table Europe Sandalwood Production, Consumption, Export, Import (2014-2019) Table China Sandalwood Production, Consumption, Export, Import (2014-2019) Table Japan Sandalwood Production, Consumption, Export, Import (2014-2019) Table Middle East & Africa Sandalwood Production, Consumption, Export, Import (2014-2019) Table India Sandalwood Production, Consumption, Export, Import (2014-2019) Table South America Sandalwood Production, Consumption, Export, Import (2014-2019) Figure North America Sandalwood Production and Growth Rate Analysis Figure North America Sandalwood Consumption and Growth Rate Analysis Figure North America Sandalwood SWOT Analysis Figure Europe Sandalwood Production and Growth Rate Analysis Figure Europe Sandalwood Consumption and Growth Rate Analysis Figure Europe Sandalwood SWOT Analysis Figure China Sandalwood Production and Growth Rate Analysis Figure China Sandalwood Consumption and Growth Rate Analysis Figure China Sandalwood SWOT Analysis Figure Japan Sandalwood Production and Growth Rate Analysis Figure Japan Sandalwood Consumption and Growth Rate Analysis Figure Japan Sandalwood SWOT Analysis Figure Middle East & Africa Sandalwood Production and Growth Rate Analysis Figure Middle East & Africa Sandalwood Consumption and Growth Rate Analysis Figure Middle East & Africa Sandalwood SWOT Analysis Figure India Sandalwood Production and Growth Rate Analysis Figure India Sandalwood Consumption and Growth Rate Analysis Figure India Sandalwood SWOT Analysis Figure South America Sandalwood Production and Growth Rate Analysis Figure South America Sandalwood Consumption and Growth Rate Analysis Figure South America Sandalwood SWOT Analysis Figure Top 3 Market Share of Sandalwood Companies Figure Top 6 Market Share of Sandalwood Companies Table Mergers, Acquisitions and Expansion Analysis Table Company Profiles Table Product Introduction Table Australian Sandalwood Network Production, Value ($), Price, Gross Margin 2014-2019 Figure Australian Sandalwood Network Production and Growth Rate Figure Australian Sandalwood Network Value ($) Market Share 2014-2019 Figure Australian Sandalwood Network Market Share of Sandalwood Segmented by Region in 2018 Table Company Profiles Table Product Introduction Table TFS Production, Value ($), Price, Gross Margin 2014-2019 Figure TFS Production and Growth Rate Figure TFS Value ($) Market Share 2014-2019 Figure TFS Market Share of Sandalwood Segmented by Region in 2018 Table Company Profiles Table Product Introduction Table WA Sandalwood Plantations Production, Value ($), Price, Gross Margin 2014-2019 Figure WA Sandalwood Plantations Production and Growth Rate Figure WA Sandalwood Plantations Value ($) Market Share 2014-2019 Figure WA Sandalwood Plantations Market Share of Sandalwood Segmented by Region in 2018 Table Company Profiles Table Product Introduction Table Santanol Group Production, Value ($), Price, Gross Margin 2014-2019 Figure Santanol Group Production and Growth Rate Figure Santanol Group Value ($) Market Share 2014-2019 Figure Santanol Group Market Share of Sandalwood Segmented by Region in 2018 Table Company Profiles Table Product Introduction Table FPC Production, Value ($), Price, Gross Margin 2014-2019 Figure FPC Production and Growth Rate Figure FPC Value ($) Market Share 2014-2019 Figure FPC Market Share of Sandalwood Segmented by Region in 2018 Table Company Profiles Table Product Introduction Table KS&DL Production, Value ($), Price, Gross Margin 2014-2019 Figure KS&DL Production and Growth Rate Figure KS&DL Value ($) Market Share 2014-2019 Figure KS&DL Market Share of Sandalwood Segmented by Region in 2018 Table Global Sandalwood Market Value ($) Forecast, by Type Table Global Sandalwood Market Volume Forecast, by Type Figure Global Sandalwood Market Value ($) and Growth Rate Forecast of Santalum paniculatum (2019-2024) Figure Global Sandalwood Market Volume and Growth Rate Forecast of Santalum paniculatum (2019-2024) Figure Global Sandalwood Market Value ($) and Growth Rate Forecast of Santalum spicatum (2019-2024) Figure Global Sandalwood Market Volume and Growth Rate Forecast of Santalum spicatum (2019-2024) Figure Global Sandalwood Market Value ($) and Growth Rate Forecast of Santalum album (2019-2024) Figure Global Sandalwood Market Volume and Growth Rate Forecast of Santalum album (2019-2024) Table Global Market Value ($) Forecast by Application (2019-2024) Table Global Market Volume Forecast by Application (2019-2024) Figure Global Sandalwood Consumption and Growth Rate of Sandalwood Oil (2014-2019) Figure Global Sandalwood Consumption and Growth Rate of Sandalwood Wood (2014-2019) Figure Market Value ($) and Growth Rate Forecast of Sandalwood Wood (2019-2024) Figure Market Volume and Growth Rate Forecast of Sandalwood Wood (2019-2024) Figure North America Market Value ($) and Growth Rate Forecast (2019-2024) Table North America Consumption and Growth Rate Forecast (2019-2024) Figure Europe Market Value ($) and Growth Rate Forecast (2019-2024) Table Europe Consumption and Growth Rate Forecast (2019-2024) Figure China Market Value ($) and Growth Rate Forecast (2019-2024) Table China Consumption and Growth Rate Forecast (2019-2024) Figure Japan Market Value ($) and Growth Rate Forecast (2019-2024) Table Japan Consumption and Growth Rate Forecast (2019-2024) Figure Middle East & Africa Market Value ($) and Growth Rate Forecast (2019-2024) Table Middle East & Africa Consumption and Growth Rate Forecast (2019-2024) Figure India Market Value ($) and Growth Rate Forecast (2019-2024) Table India Consumption and Growth Rate Forecast (2019-2024) Figure South America Market Value ($) and Growth Rate Forecast (2019-2024) Table South America Consumption and Growth Rate Forecast (2019-2024) Figure Industry Resource/Technology/Labor Importance Analysis Table New Entrants SWOT Analysis Table New Project Analysis of Investment Recovery
Inquiry For Buying
Sandalwood
Request Sample
Sandalwood