Tabletop Gaming Market Size, Share, and Trends Analysis Report
CAGR :

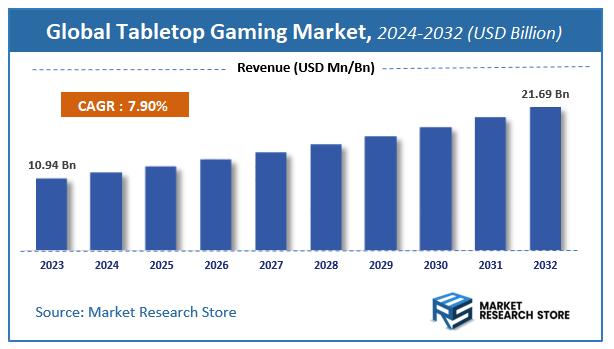
| Market Size 2023 (Base Year) | USD 10.94 Billion |
| Market Size 2032 (Forecast Year) | USD 21.69 Billion |
| CAGR | 7.9% |
| Forecast Period | 2024 - 2032 |
| Historical Period | 2018 - 2023 |
Tabletop Gaming Market Insights
A latest report by Market Research Store estimates that the Global Tabletop Gaming Market was valued at USD 10.94 Billion in 2023 and is expected to reach USD 21.69 Billion by 2032, with a CAGR of 7.9% during the forecast period 2024-2032. The report Tabletop Gaming Market overview, growth factors, restraints, opportunities, segmentation, key developments, competitive landscape, consumer insights, and market growth forecast in terms of value or volume. These structured details offer an all-inclusive market overview, providing valuable insights for investment decisions, business decisions, strategic planning, and competitive analysis.
To Get more Insights, Request a Free Sample
Tabletop Gaming Market: Overview
The growth of the tabletop gaming market is fueled by rising global demand across various industries and applications. The report highlights lucrative opportunities, analyzing cost structures, key segments, emerging trends, regional dynamics, and advancements by leading players to provide comprehensive market insights. The tabletop gaming market report offers a detailed industry analysis from 2024 to 2032, combining quantitative and qualitative insights. It examines key factors such as pricing, market penetration, GDP impact, industry dynamics, major players, consumer behavior, and socio-economic conditions. Structured into multiple sections, the report provides a comprehensive perspective on the market from all angles.
Key sections of the tabletop gaming market report include market segments, outlook, competitive landscape, and company profiles. Market Segments offer in-depth details based on Type, Application, and other relevant classifications to support strategic marketing initiatives. Market Outlook thoroughly analyzes market trends, growth drivers, restraints, opportunities, challenges, Porter’s Five Forces framework, macroeconomic factors, value chain analysis, and pricing trends shaping the market now and in the future. The Competitive Landscape and Company Profiles section highlights major players, their strategies, and market positioning to guide investment and business decisions. The report also identifies innovation trends, new business opportunities, and investment prospects for the forecast period.
Key Highlights:
- As per the analysis shared by our research analyst, the global tabletop gaming market is estimated to grow annually at a CAGR of around 7.9% over the forecast period (2024-2032).
- In terms of revenue, the global tabletop gaming market size was valued at around USD 10.94 Billion in 2023 and is projected to reach USD 21.69 Billion by 2032.
- The market is projected to grow at a significant rate due to growing popularity of board games, increasing social gaming trends, rising disposable incomes, and the expansion of crowdfunding platforms and digital integrations.
- Based on the Type, the Miniature Wargames segment is growing at a high rate and will continue to dominate the global market as per industry projections.
- On the basis of Application, the Children segment is anticipated to command the largest market share.
- Based on region, North America is projected to dominate the global market during the forecast period.
Tabletop Gaming Market: Report Scope
This report thoroughly analyzes the tabletop gaming market, exploring its historical trends, current state, and future projections. The market estimates presented result from a robust research methodology, incorporating primary research, secondary sources, and expert opinions. These estimates are influenced by the prevailing market dynamics as well as key economic, social, and political factors. Furthermore, the report considers the impact of regulations, government expenditures, and advancements in research and development on the market. Both positive and negative shifts are evaluated to ensure a comprehensive and accurate market outlook.
| Report Attributes | Report Details |
|---|---|
| Report Name | Tabletop Gaming Market |
| Market Size in 2023 | USD 10.94 Billion |
| Market Forecast in 2032 | USD 21.69 Billion |
| Growth Rate | CAGR of 7.9% |
| Number of Pages | 180 |
| Key Companies Covered | Mattel Inc., Asmodee Group, Australian Design Group, Buffalo Games, Ravensburger, NSF Boardgames and Puzzles, Lifestyle Boardgames Ltd., Goliath Games LLC, Korea Boardgames Co. Ltd., Hasbro Inc. |
| Segments Covered | By Type, By Application, and By Region |
| Regions Covered | North America, Europe, Asia Pacific (APAC), Latin America, Middle East, and Africa (MEA) |
| Base Year | 2023 |
| Historical Year | 2018 to 2023 |
| Forecast Year | 2024 to 2032 |
| Customization Scope | Avail customized purchase options to meet your exact research needs. Request For Customization |
Tabletop Gaming Market: Dynamics
Key Growth Drivers
The tabletop gaming market in India is experiencing a significant surge in popularity, driven by the increasing disposable incomes and leisure spending of a young and digitally connected population seeking offline social experiences. The growing awareness and accessibility of diverse game genres beyond traditional board games, including strategy games, role-playing games (RPGs), and miniature wargames, fueled by online communities and content creators, is attracting a wider audience. Furthermore, the rise of dedicated board game cafes and communities in urban centers provides physical spaces for enthusiasts to gather, play, and discover new games. The nostalgia factor associated with classic board games, coupled with the appeal of face-to-face interaction and strategic thinking, also contributes to market growth.
Restraints
Despite the burgeoning interest, the tabletop gaming market in India faces certain restraints. The relatively high cost of imported and specialized board games, often due to import duties and limited local manufacturing, can be a significant barrier for many potential consumers. The lack of widespread availability and distribution channels for a diverse range of tabletop games outside of major metropolitan cities limits accessibility. Furthermore, the perception of tabletop gaming as a niche hobby can hinder mainstream adoption. Time constraints in busy urban lifestyles and competition from digital entertainment options also pose challenges to dedicated playtime. The need for a group of committed players for many tabletop games can also be a logistical hurdle for individuals in smaller social circles.
Opportunities
The tabletop gaming market in India presents numerous opportunities for expansion and localization. The increasing demand for local content and themes provides an opportunity for Indian game designers and publishers to create games rooted in Indian mythology, history, and culture. The growth of e-commerce platforms offers a wider distribution channel to reach consumers across the country. Furthermore, the development of more affordable and beginner-friendly game options can attract a larger segment of the population. The potential for integrating tabletop gaming with educational initiatives and corporate team-building activities offers new avenues for market growth. The rise of crowdfunding platforms can also empower independent Indian game developers to bring their creations to market.
Challenges
The tabletop gaming market in India faces challenges related to building a strong local manufacturing ecosystem to reduce costs and improve availability. Educating a wider audience about the diverse and engaging experiences offered by modern tabletop games beyond traditional perceptions is crucial for mainstream adoption. Overcoming logistical hurdles in distribution and reaching consumers in Tier-II and Tier-III cities requires innovative solutions. Furthermore, fostering a vibrant community of game designers, publishers, and retailers is essential for the long-term growth of the market. Addressing the perception of high complexity associated with some strategy and RPG titles by offering accessible entry points and tutorials is also important. Finally, competing with the deeply ingrained culture of digital entertainment requires highlighting the unique social and cognitive benefits of tabletop gaming.
Tabletop Gaming Market: Segmentation Insights
The global tabletop gaming market is segmented based on Type, Application, and Region. All the segments of the tabletop gaming market have been analyzed based on present & future trends and the market is estimated from 2024 to 2032.
Based on Type, the global tabletop gaming market is divided into Miniature Wargames, Role Playing Games.
On the basis of Application, the global tabletop gaming market is bifurcated into Children, Adults, Family, Party.
Tabletop Gaming Market: Regional Insights
The North American region dominates the global tabletop gaming market, accounting for the largest revenue share due to high consumer spending on hobby games, strong retail networks, and a vibrant culture of board game cafes and conventions. In 2023, North America held over 42% of the market, with the U.S. as the primary driver, supported by major publishers like Wizards of the Coast (Magic: The Gathering, Dungeons & Dragons) and Asmodee. Europe follows as the second-largest market, led by Germany (the "board game capital" with Spiel Essen) and the UK, fueled by indie game innovation and strategic game preferences.
The Asia-Pacific region shows rapid growth, particularly in Japan and China, due to rising popularity of collectible card games (e.g., Yu-Gi-Oh!) and localization of Western titles, though piracy challenges limit revenue. Latin America and the Middle East & Africa remain niche markets, constrained by lower disposable incomes. North America’s dominance is expected to continue, driven by crowdfunded game successes (e.g., Kickstarter), hybrid digital-physical gameplay trends, and premium collector’s editions.
Tabletop Gaming Market: Competitive Landscape
The tabletop gaming market report offers a thorough analysis of both established and emerging players within the market. It includes a detailed list of key companies, categorized based on the types of products they offer and other relevant factors. The report also highlights the market entry year for each player, providing further context for the research analysis.
The "Global Tabletop Gaming Market" study offers valuable insights, focusing on the global market landscape, with an emphasis on major industry players such as;
- Mattel Inc.
- Asmodee Group
- Australian Design Group
- Buffalo Games
- Ravensburger
- NSF Boardgames and Puzzles
- Lifestyle Boardgames Ltd.
- Goliath Games LLC
- Korea Boardgames Co. Ltd.
- Hasbro Inc.
The Global Tabletop Gaming Market is Segmented as Follows:
By Type
- Miniature Wargames
- Role Playing Games
By Application
- Children
- Adults
- Family
- Party
By Region
- North America
- The U.S.
- Canada
- Mexico
- Europe
- France
- The UK
- Spain
- Germany
- Italy
- Rest of Europe
- Asia Pacific
- China
- Japan
- India
- Australia
- South Korea
- Rest of Asia Pacific
- The Middle East & Africa
- Saudi Arabia
- UAE
- Egypt
- Kuwait
- South Africa
- Rest of the Middle East & Africa
- Latin America
- Brazil
- Argentina
- Rest of Latin America
Market Evolution
This section evaluates the market position of the product or service by examining its development pathway and competitive dynamics. It provides a detailed overview of the product's growth stages, including the early (historical) phase, the mid-stage, and anticipated future advancements influenced by innovation and emerging technologies.
Porter’s Analysis
Porter’s Five Forces framework offers a strategic lens for assessing competitor behavior and the positioning of key players in the tabletop gaming industry. This section explores the external factors shaping competitive dynamics and influencing market strategies in the years ahead. The analysis focuses on five critical forces:
- Competitive Rivalry
- Threat of New Entrants
- Threat of Substitutes
- Supplier Bargaining Power
- Buyer Bargaining Power
Value Chain & Market Attractiveness Analysis
The value chain analysis helps businesses optimize operations by mapping the product flow from suppliers to end consumers, identifying opportunities to streamline processes and gain a competitive edge. Segment-wise market attractiveness analysis evaluates key dimensions like product categories, demographics, and regions, assessing growth potential, market size, and profitability. This enables businesses to focus resources on high-potential segments for better ROI and long-term value.
PESTEL Analysis
PESTEL analysis is a powerful tool in market research reports that enhances market understanding by systematically examining the external macro-environmental factors influencing a business or industry. The acronym stands for Political, Economic, Social, Technological, Environmental, and Legal factors. By evaluating these dimensions, PESTEL analysis provides a comprehensive overview of the broader context within which a market operates, helping businesses identify potential opportunities and threats.
- Political factors assess government policies, stability, trade regulations, and political risks that could impact market operations.
- Economic factors examine variables like inflation, exchange rates, economic growth, and consumer spending power to determine market viability.
- Social factors explore cultural trends, demographics, and lifestyle changes that shape consumer behavior and preferences.
- Technological factors evaluate innovation, R&D, and technological advancements affecting product development and operational efficiencies.
- Environmental factors focus on sustainability, climate change impacts, and eco-friendly practices shaping market trends.
- Legal factors address compliance requirements, industry regulations, and intellectual property laws impacting market entry and operations.
Import-Export Analysis & Pricing Analysis
An import-export analysis is vital for market research, revealing global trade dynamics, trends, and opportunities. It examines trade volumes, product categories, and regional competitiveness, offering insights into supply chains and market demand. This section also analyzes past and future pricing trends, helping businesses optimize strategies and enabling consumers to assess product value effectively.
Tabletop Gaming Market: Company Profiles
The report identifies key players in the tabletop gaming market through competitive landscape and company profiles, evaluating their offerings, financial performance, strategies, and market positioning. It includes a SWOT analysis of the top 3-5 companies, assessing strengths, weaknesses, opportunities, and threats. The competitive landscape highlights rankings, recent activities (mergers, acquisitions, partnerships, product launches), and regional footprints using the Ace matrix. Customization is available to meet client-specific needs.
Regional & Industry Footprint
This section details the geographic reach, sales networks, and market penetration of companies profiled in the tabletop gaming report, showcasing their operations and distribution across regions. It analyzes the alignment of companies with specific industry verticals, highlighting the industries they serve and the scope of their products and services within those sectors.
Ace Matrix
This section categorizes companies into four distinct groups—Active, Cutting Edge, Innovator, and Emerging—based on their product and business strategies. The evaluation of product strategy focuses on aspects such as the range and depth of offerings, commitment to innovation, product functionalities, and scalability. Key elements like global reach, sector coverage, strategic acquisitions, and long-term growth plans are considered for business strategy. This analysis provides a detailed view of companies' position within the market and highlights their potential for future growth and development.
Research Methodology
The qualitative and quantitative insights for the tabletop gaming market are derived through a multi-faceted research approach, combining input from subject matter experts, primary research, and secondary data sources. Primary research includes gathering critical information via face-to-face or telephonic interviews, surveys, questionnaires, and feedback from industry professionals, key opinion leaders (KOLs), and customers. Regular interviews with industry experts are conducted to deepen the analysis and reinforce the existing data, ensuring a robust and well-rounded market understanding.
Secondary research for this report was carried out by the Market Research Store team, drawing on a variety of authoritative sources, such as:
- Official company websites, annual reports, financial statements, investor presentations, and SEC filings
- Internal and external proprietary databases, as well as relevant patent and regulatory databases
- Government publications, national statistical databases, and industry-specific market reports
- Media coverage, including news articles, press releases, and webcasts about market participants
- Paid industry databases for detailed market insights
Market Research Store conducted in-depth consultations with various key opinion leaders in the industry, including senior executives from top companies and regional leaders from end-user organizations. This effort aimed to gather critical insights on factors such as the market share of dominant brands in specific countries and regions, along with pricing strategies for products and services.
To determine total sales data, the research team conducted primary interviews across multiple countries with influential stakeholders, including:
- Distributors
- Marketing, Brand, and Product Managers
- Procurement and Production Managers
- Sales and Regional Sales Managers, Country Managers
- Technical Specialists
- C-Level Executives
These subject matter experts, with their extensive industry experience, helped validate and refine the findings. For secondary research, data was sourced from a wide range of materials, including online resources, company annual reports, industry publications, research papers, association reports, and government websites. These various sources provide a comprehensive and well-rounded perspective on the market.
Frequently Asked Questions
Table Of Content
List of Tables and Figures Figure Product Picture of Tabletop Gaming Table Product Specification of Tabletop Gaming Figure Market Concentration Ratio and Market Maturity Analysis of Tabletop Gaming Figure Global Tabletop Gaming Value ($) and Growth Rate from 2014-2024 Table Different Types of Tabletop Gaming Figure Global Tabletop Gaming Value ($) Segment by Type from 2014-2019 Figure Adventure games Picture Figure Board games Picture Figure Card games Picture Figure Dice games Picture Figure Paper and pencil games Picture Figure Role-playing games Picture Figure Strategy games Picture Figure Tile-based games Picture Table Different Applications of Tabletop Gaming Figure Global Tabletop Gaming Value ($) Segment by Applications from 2014-2019 Figure Retail Picture Figure Specialty Store Picture Figure Mass Market Players Picture Figure Other Stores Picture Figure Online Picture Table Research Regions of Tabletop Gaming Figure North America Tabletop Gaming Production Value ($) and Growth Rate (2014-2019) Figure Europe Tabletop Gaming Production Value ($) and Growth Rate (2014-2019) Table China Tabletop Gaming Production Value ($) and Growth Rate (2014-2019) Table Japan Tabletop Gaming Production Value ($) and Growth Rate (2014-2019) Table Middle East & Africa Tabletop Gaming Production Value ($) and Growth Rate (2014-2019) Table India Tabletop Gaming Production Value ($) and Growth Rate (2014-2019) Table South America Tabletop Gaming Production Value ($) and Growth Rate (2014-2019) Table Emerging Countries of Tabletop Gaming Table Growing Market of Tabletop Gaming Figure Industry Chain Analysis of Tabletop Gaming Table Upstream Raw Material Suppliers of Tabletop Gaming with Contact Information Table Major Players Manufacturing Base and Market Share ($) of Tabletop Gaming in 2018 Table Major Players Tabletop Gaming Product Types in 2018 Figure Production Process of Tabletop Gaming Figure Manufacturing Cost Structure of Tabletop Gaming Figure Channel Status of Tabletop Gaming Table Major Distributors of Tabletop Gaming with Contact Information Table Major Downstream Buyers of Tabletop Gaming with Contact Information Table Global Tabletop Gaming Value ($) by Type (2014-2019) Table Global Tabletop Gaming Value ($) Share by Type (2014-2019) Figure Global Tabletop Gaming Value ($) Share by Type (2014-2019) Table Global Tabletop Gaming Production by Type (2014-2019) Table Global Tabletop Gaming Production Share by Type (2014-2019) Figure Global Tabletop Gaming Production Share by Type (2014-2019) Figure Global Tabletop Gaming Value ($) and Growth Rate of Adventure games Figure Global Tabletop Gaming Value ($) and Growth Rate of Board games Figure Global Tabletop Gaming Value ($) and Growth Rate of Card games Figure Global Tabletop Gaming Value ($) and Growth Rate of Dice games Figure Global Tabletop Gaming Value ($) and Growth Rate of Paper and pencil games Figure Global Tabletop Gaming Value ($) and Growth Rate of Role-playing games Figure Global Tabletop Gaming Value ($) and Growth Rate of Strategy games Figure Global Tabletop Gaming Value ($) and Growth Rate of Tile-based games Figure Global Tabletop Gaming Price by Type (2014-2019) Table Global Tabletop Gaming Consumption by Application (2014-2019) Table Global Tabletop Gaming Consumption Market Share by Application (2014-2019) Figure Global Tabletop Gaming Consumption Market Share by Application (2014-2019) Table Downstream Buyers Introduction by Application Figure Global Tabletop Gaming Consumption and Growth Rate of Retail (2014-2019) Figure Global Tabletop Gaming Consumption and Growth Rate of Specialty Store (2014-2019) Figure Global Tabletop Gaming Consumption and Growth Rate of Mass Market Players (2014-2019) Figure Global Tabletop Gaming Consumption and Growth Rate of Other Stores (2014-2019) Figure Global Tabletop Gaming Consumption and Growth Rate of Online (2014-2019) Table Global Tabletop Gaming Value ($) by Region (2014-2019) Table Global Tabletop Gaming Value ($) Market Share by Region (2014-2019) Figure Global Tabletop Gaming Value ($) Market Share by Region (2014-2019) Table Global Tabletop Gaming Production by Region (2014-2019) Table Global Tabletop Gaming Production Market Share by Region (2014-2019) Figure Global Tabletop Gaming Production Market Share by Region (2014-2019) Table Global Tabletop Gaming Production, Value ($), Price and Gross Margin (2014-2019) Table North America Tabletop Gaming Production, Value ($), Price and Gross Margin (2014-2019) Table Europe Tabletop Gaming Production, Value ($), Price and Gross Margin (2014-2019) Table China Tabletop Gaming Production, Value ($), Price and Gross Margin (2014-2019) Table Japan Tabletop Gaming Production, Value ($), Price and Gross Margin (2014-2019) Table Middle East & Africa Tabletop Gaming Production, Value ($), Price and Gross Margin (2014-2019) Table India Tabletop Gaming Production, Value ($), Price and Gross Margin (2014-2019) Table South America Tabletop Gaming Production, Value ($), Price and Gross Margin (2014-2019) Table Global Tabletop Gaming Consumption by Regions (2014-2019) Figure Global Tabletop Gaming Consumption Share by Regions (2014-2019) Table North America Tabletop Gaming Production, Consumption, Export, Import (2014-2019) Table Europe Tabletop Gaming Production, Consumption, Export, Import (2014-2019) Table China Tabletop Gaming Production, Consumption, Export, Import (2014-2019) Table Japan Tabletop Gaming Production, Consumption, Export, Import (2014-2019) Table Middle East & Africa Tabletop Gaming Production, Consumption, Export, Import (2014-2019) Table India Tabletop Gaming Production, Consumption, Export, Import (2014-2019) Table South America Tabletop Gaming Production, Consumption, Export, Import (2014-2019) Figure North America Tabletop Gaming Production and Growth Rate Analysis Figure North America Tabletop Gaming Consumption and Growth Rate Analysis Figure North America Tabletop Gaming SWOT Analysis Figure Europe Tabletop Gaming Production and Growth Rate Analysis Figure Europe Tabletop Gaming Consumption and Growth Rate Analysis Figure Europe Tabletop Gaming SWOT Analysis Figure China Tabletop Gaming Production and Growth Rate Analysis Figure China Tabletop Gaming Consumption and Growth Rate Analysis Figure China Tabletop Gaming SWOT Analysis Figure Japan Tabletop Gaming Production and Growth Rate Analysis Figure Japan Tabletop Gaming Consumption and Growth Rate Analysis Figure Japan Tabletop Gaming SWOT Analysis Figure Middle East & Africa Tabletop Gaming Production and Growth Rate Analysis Figure Middle East & Africa Tabletop Gaming Consumption and Growth Rate Analysis Figure Middle East & Africa Tabletop Gaming SWOT Analysis Figure India Tabletop Gaming Production and Growth Rate Analysis Figure India Tabletop Gaming Consumption and Growth Rate Analysis Figure India Tabletop Gaming SWOT Analysis Figure South America Tabletop Gaming Production and Growth Rate Analysis Figure South America Tabletop Gaming Consumption and Growth Rate Analysis Figure South America Tabletop Gaming SWOT Analysis Figure Top 3 Market Share of Tabletop Gaming Companies Figure Top 6 Market Share of Tabletop Gaming Companies Table Mergers, Acquisitions and Expansion Analysis Table Company Profiles Table Product Introduction Table The Grey Fox Games Production, Value ($), Price, Gross Margin 2014-2019 Figure The Grey Fox Games Production and Growth Rate Figure The Grey Fox Games Value ($) Market Share 2014-2019 Figure The Grey Fox Games Market Share of Tabletop Gaming Segmented by Region in 2018 Table Company Profiles Table Product Introduction Table Goliath Production, Value ($), Price, Gross Margin 2014-2019 Figure Goliath Production and Growth Rate Figure Goliath Value ($) Market Share 2014-2019 Figure Goliath Market Share of Tabletop Gaming Segmented by Region in 2018 Table Company Profiles Table Product Introduction Table Goliath BV Production, Value ($), Price, Gross Margin 2014-2019 Figure Goliath BV Production and Growth Rate Figure Goliath BV Value ($) Market Share 2014-2019 Figure Goliath BV Market Share of Tabletop Gaming Segmented by Region in 2018 Table Company Profiles Table Product Introduction Table BoardGameDesign.com Production, Value ($), Price, Gross Margin 2014-2019 Figure BoardGameDesign.com Production and Growth Rate Figure BoardGameDesign.com Value ($) Market Share 2014-2019 Figure BoardGameDesign.com Market Share of Tabletop Gaming Segmented by Region in 2018 Table Company Profiles Table Product Introduction Table CMON Production, Value ($), Price, Gross Margin 2014-2019 Figure CMON Production and Growth Rate Figure CMON Value ($) Market Share 2014-2019 Figure CMON Market Share of Tabletop Gaming Segmented by Region in 2018 Table Company Profiles Table Product Introduction Table Buffalo Games Production, Value ($), Price, Gross Margin 2014-2019 Figure Buffalo Games Production and Growth Rate Figure Buffalo Games Value ($) Market Share 2014-2019 Figure Buffalo Games Market Share of Tabletop Gaming Segmented by Region in 2018 Table Company Profiles Table Product Introduction Table Mattel Production, Value ($), Price, Gross Margin 2014-2019 Figure Mattel Production and Growth Rate Figure Mattel Value ($) Market Share 2014-2019 Figure Mattel Market Share of Tabletop Gaming Segmented by Region in 2018 Table Company Profiles Table Product Introduction Table Clementoni Production, Value ($), Price, Gross Margin 2014-2019 Figure Clementoni Production and Growth Rate Figure Clementoni Value ($) Market Share 2014-2019 Figure Clementoni Market Share of Tabletop Gaming Segmented by Region in 2018 Table Company Profiles Table Product Introduction Table The Walt Disney Co. Production, Value ($), Price, Gross Margin 2014-2019 Figure The Walt Disney Co. Production and Growth Rate Figure The Walt Disney Co. Value ($) Market Share 2014-2019 Figure The Walt Disney Co. Market Share of Tabletop Gaming Segmented by Region in 2018 Table Company Profiles Table Product Introduction Table Hasbro Production, Value ($), Price, Gross Margin 2014-2019 Figure Hasbro Production and Growth Rate Figure Hasbro Value ($) Market Share 2014-2019 Figure Hasbro Market Share of Tabletop Gaming Segmented by Region in 2018 Table Company Profiles Table Product Introduction Table Games Workshop Production, Value ($), Price, Gross Margin 2014-2019 Figure Games Workshop Production and Growth Rate Figure Games Workshop Value ($) Market Share 2014-2019 Figure Games Workshop Market Share of Tabletop Gaming Segmented by Region in 2018 Table Company Profiles Table Product Introduction Table Gibsons Games Production, Value ($), Price, Gross Margin 2014-2019 Figure Gibsons Games Production and Growth Rate Figure Gibsons Games Value ($) Market Share 2014-2019 Figure Gibsons Games Market Share of Tabletop Gaming Segmented by Region in 2018 Table Company Profiles Table Product Introduction Table Bezier Games Production, Value ($), Price, Gross Margin 2014-2019 Figure Bezier Games Production and Growth Rate Figure Bezier Games Value ($) Market Share 2014-2019 Figure Bezier Games Market Share of Tabletop Gaming Segmented by Region in 2018 Table Company Profiles Table Product Introduction Table Ravensburger Production, Value ($), Price, Gross Margin 2014-2019 Figure Ravensburger Production and Growth Rate Figure Ravensburger Value ($) Market Share 2014-2019 Figure Ravensburger Market Share of Tabletop Gaming Segmented by Region in 2018 Table Company Profiles Table Product Introduction Table Asmodee Editions Production, Value ($), Price, Gross Margin 2014-2019 Figure Asmodee Editions Production and Growth Rate Figure Asmodee Editions Value ($) Market Share 2014-2019 Figure Asmodee Editions Market Share of Tabletop Gaming Segmented by Region in 2018 Table Company Profiles Table Product Introduction Table IELLO Games Production, Value ($), Price, Gross Margin 2014-2019 Figure IELLO Games Production and Growth Rate Figure IELLO Games Value ($) Market Share 2014-2019 Figure IELLO Games Market Share of Tabletop Gaming Segmented by Region in 2018 Table Company Profiles Table Product Introduction Table Fremont Die Consumer Products Production, Value ($), Price, Gross Margin 2014-2019 Figure Fremont Die Consumer Products Production and Growth Rate Figure Fremont Die Consumer Products Value ($) Market Share 2014-2019 Figure Fremont Die Consumer Products Market Share of Tabletop Gaming Segmented by Region in 2018 Table Company Profiles Table Product Introduction Table Grand Prix International Production, Value ($), Price, Gross Margin 2014-2019 Figure Grand Prix International Production and Growth Rate Figure Grand Prix International Value ($) Market Share 2014-2019 Figure Grand Prix International Market Share of Tabletop Gaming Segmented by Region in 2018 Table Company Profiles Table Product Introduction Table Indie Boards and Cards Production, Value ($), Price, Gross Margin 2014-2019 Figure Indie Boards and Cards Production and Growth Rate Figure Indie Boards and Cards Value ($) Market Share 2014-2019 Figure Indie Boards and Cards Market Share of Tabletop Gaming Segmented by Region in 2018 Table Global Tabletop Gaming Market Value ($) Forecast, by Type Table Global Tabletop Gaming Market Volume Forecast, by Type Figure Global Tabletop Gaming Market Value ($) and Growth Rate Forecast of Adventure games (2019-2024) Figure Global Tabletop Gaming Market Volume and Growth Rate Forecast of Adventure games (2019-2024) Figure Global Tabletop Gaming Market Value ($) and Growth Rate Forecast of Board games (2019-2024) Figure Global Tabletop Gaming Market Volume and Growth Rate Forecast of Board games (2019-2024) Figure Global Tabletop Gaming Market Value ($) and Growth Rate Forecast of Card games (2019-2024) Figure Global Tabletop Gaming Market Volume and Growth Rate Forecast of Card games (2019-2024) Figure Global Tabletop Gaming Market Value ($) and Growth Rate Forecast of Dice games (2019-2024) Figure Global Tabletop Gaming Market Volume and Growth Rate Forecast of Dice games (2019-2024) Figure Global Tabletop Gaming Market Value ($) and Growth Rate Forecast of Paper and pencil games (2019-2024) Figure Global Tabletop Gaming Market Volume and Growth Rate Forecast of Paper and pencil games (2019-2024) Figure Global Tabletop Gaming Market Value ($) and Growth Rate Forecast of Role-playing games (2019-2024) Figure Global Tabletop Gaming Market Volume and Growth Rate Forecast of Role-playing games (2019-2024) Figure Global Tabletop Gaming Market Value ($) and Growth Rate Forecast of Strategy games (2019-2024) Figure Global Tabletop Gaming Market Volume and Growth Rate Forecast of Strategy games (2019-2024) Figure Global Tabletop Gaming Market Value ($) and Growth Rate Forecast of Tile-based games (2019-2024) Figure Global Tabletop Gaming Market Volume and Growth Rate Forecast of Tile-based games (2019-2024) Table Global Market Value ($) Forecast by Application (2019-2024) Table Global Market Volume Forecast by Application (2019-2024) Figure Global Tabletop Gaming Consumption and Growth Rate of Retail (2014-2019) Figure Global Tabletop Gaming Consumption and Growth Rate of Specialty Store (2014-2019) Figure Global Tabletop Gaming Consumption and Growth Rate of Mass Market Players (2014-2019) Figure Global Tabletop Gaming Consumption and Growth Rate of Other Stores (2014-2019) Figure Global Tabletop Gaming Consumption and Growth Rate of Online (2014-2019) Figure Market Value ($) and Growth Rate Forecast of Online (2019-2024) Figure Market Volume and Growth Rate Forecast of Online (2019-2024) Figure North America Market Value ($) and Growth Rate Forecast (2019-2024) Table North America Consumption and Growth Rate Forecast (2019-2024) Figure Europe Market Value ($) and Growth Rate Forecast (2019-2024) Table Europe Consumption and Growth Rate Forecast (2019-2024) Figure China Market Value ($) and Growth Rate Forecast (2019-2024) Table China Consumption and Growth Rate Forecast (2019-2024) Figure Japan Market Value ($) and Growth Rate Forecast (2019-2024) Table Japan Consumption and Growth Rate Forecast (2019-2024) Figure Middle East & Africa Market Value ($) and Growth Rate Forecast (2019-2024) Table Middle East & Africa Consumption and Growth Rate Forecast (2019-2024) Figure India Market Value ($) and Growth Rate Forecast (2019-2024) Table India Consumption and Growth Rate Forecast (2019-2024) Figure South America Market Value ($) and Growth Rate Forecast (2019-2024) Table South America Consumption and Growth Rate Forecast (2019-2024) Figure Industry Resource/Technology/Labor Importance Analysis Table New Entrants SWOT Analysis Table New Project Analysis of Investment Recovery
Inquiry For Buying
Tabletop Gaming
Request Sample
Tabletop Gaming