Thermal Energy Storage Market Size, Share, and Trends Analysis Report
CAGR :

| Market Size 2023 (Base Year) | USD 4.72 Billion |
| Market Size 2032 (Forecast Year) | USD 8.97 Billion |
| CAGR | 7.38% |
| Forecast Period | 2024 - 2032 |
| Historical Period | 2018 - 2023 |
Thermal Energy Storage Market Insights
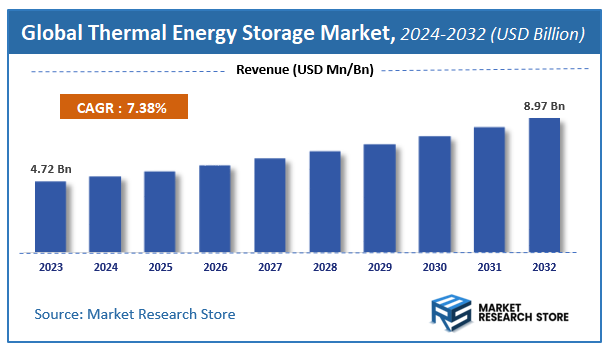
A latest report by Market Research Store estimates that the Global Thermal Energy Storage Market was valued at USD 4.72 Billion in 2023 and is expected to reach USD 8.97 Billion by 2032, with a CAGR of 7.38% during the forecast period 2024-2032. The report Thermal Energy Storage Market overview, growth factors, restraints, opportunities, segmentation, key developments, competitive landscape, consumer insights, and market growth forecast in terms of value or volume. These structured details offer an all-inclusive market overview, providing valuable insights for investment decisions, business decisions, strategic planning, and competitive analysis.
To Get more Insights, Request a Free Sample
Thermal Energy Storage Market: Overview
The growth of the thermal energy storage market is fueled by rising global demand across various industries and applications. The report highlights lucrative opportunities, analyzing cost structures, key segments, emerging trends, regional dynamics, and advancements by leading players to provide comprehensive market insights. The thermal energy storage market report offers a detailed industry analysis from 2024 to 2032, combining quantitative and qualitative insights. It examines key factors such as pricing, market penetration, GDP impact, industry dynamics, major players, consumer behavior, and socio-economic conditions. Structured into multiple sections, the report provides a comprehensive perspective on the market from all angles.
Key sections of the thermal energy storage market report include market segments, outlook, competitive landscape, and company profiles. Market Segments offer in-depth details based on Technology, Storage Medium, Application, End-User, and other relevant classifications to support strategic marketing initiatives. Market Outlook thoroughly analyzes market trends, growth drivers, restraints, opportunities, challenges, Porter’s Five Forces framework, macroeconomic factors, value chain analysis, and pricing trends shaping the market now and in the future. The Competitive Landscape and Company Profiles section highlights major players, their strategies, and market positioning to guide investment and business decisions. The report also identifies innovation trends, new business opportunities, and investment prospects for the forecast period.
Key Highlights:
- As per the analysis shared by our research analyst, the global thermal energy storage market is estimated to grow annually at a CAGR of around 7.38% over the forecast period (2024-2032).
- In terms of revenue, the global thermal energy storage market size was valued at around USD 4.72 Billion in 2023 and is projected to reach USD 8.97 Billion by 2032.
- The market is projected to grow at a significant rate due to growing focus on renewable energy integration, demand for energy efficiency solutions, and advancements in heat storage technologies.
- Based on the Technology, the Sensible Heat Storage segment is growing at a high rate and will continue to dominate the global market as per industry projections.
- On the basis of Storage Medium, the Water segment is anticipated to command the largest market share.
- In terms of Application, the Power Generation segment is projected to lead the global market.
- By End-User, the Utilities segment is predicted to dominate the global market.
- Based on region, North America is projected to dominate the global market during the forecast period.
Thermal Energy Storage Market: Report Scope
This report thoroughly analyzes the thermal energy storage market, exploring its historical trends, current state, and future projections. The market estimates presented result from a robust research methodology, incorporating primary research, secondary sources, and expert opinions. These estimates are influenced by the prevailing market dynamics as well as key economic, social, and political factors. Furthermore, the report considers the impact of regulations, government expenditures, and advancements in research and development on the market. Both positive and negative shifts are evaluated to ensure a comprehensive and accurate market outlook.
| Report Attributes | Report Details |
|---|---|
| Report Name | Thermal Energy Storage Market |
| Market Size in 2023 | USD 4.72 Billion |
| Market Forecast in 2032 | USD 8.97 Billion |
| Growth Rate | CAGR of 7.38% |
| Number of Pages | 181 |
| Key Companies Covered | Steffes Corporation, FAFCO Thermal Storage Systems, Goss Engineering Inc., Abengoa Solar S.A., Baltimore Aircoil Company, EVAPCO Inc., Ice Lings, TAS Energy, BrightSource Energy Inc., Caldwell Energy, Burns & McDonnell, CALMAC, Chicago Bridge & Iron Company (CB&I) |
| Segments Covered | By Technology, By Storage Medium, By Application, By End-User, and By Region |
| Regions Covered | North America, Europe, Asia Pacific (APAC), Latin America, Middle East, and Africa (MEA) |
| Base Year | 2023 |
| Historical Year | 2018 to 2023 |
| Forecast Year | 2024 to 2032 |
| Customization Scope | Avail customized purchase options to meet your exact research needs. Request For Customization |
Thermal Energy Storage Market: Dynamics
Key Growth Drivers
The Thermal Energy Storage (TES) market in Sangli Miraj Kupwad, Maharashtra, and India is experiencing significant growth driven by the increasing integration of renewable energy sources like solar and wind power, which are intermittent and require storage solutions to ensure grid stability and continuous supply. The growing demand for energy efficiency and peak load management in buildings, industrial processes, and district cooling/heating systems is also a major driver, as TES can shift energy demand to off-peak hours. Furthermore, the rising awareness about reducing carbon emissions and combating climate change is promoting the adoption of TES as a key technology for decarbonizing various sectors. Government initiatives and policies supporting renewable energy deployment and energy storage are further accelerating market growth. The decreasing cost of some TES technologies and advancements in material science are making them more economically viable.
Restraints
Despite the strong growth drivers, the Thermal Energy Storage (TES) market in Sangli Miraj Kupwad faces certain restraints. The high upfront capital cost associated with many TES technologies, particularly compared to conventional energy systems, can be a significant barrier to adoption. The space requirements for some TES systems, especially large-scale applications, can be a limitation in densely populated or space-constrained areas. Furthermore, the thermal losses inherent in storage processes over time can reduce overall efficiency. The lack of standardized regulations and performance metrics for TES technologies in India can create uncertainty for investors and end-users. The limited awareness and technical expertise regarding the design, installation, and operation of TES systems among some stakeholders can also hinder market growth.
Opportunities
The Thermal Energy Storage (TES) market in Sangli Miraj Kupwad presents numerous opportunities for innovation and expansion. The development of more cost-effective and efficient TES technologies using locally available materials and advanced designs can improve affordability and performance. The increasing focus on thermal storage for industrial process heat recovery and reuse offers significant energy savings potential. Furthermore, the integration of TES with smart grids and building energy management systems can optimize energy use and enhance grid flexibility. The growing demand for off-grid and microgrid solutions in remote areas can be met by incorporating TES with renewable energy sources. The potential for developing hybrid energy storage systems that combine thermal and electrical storage can provide comprehensive energy management solutions.
Challenges
The Thermal Energy Storage (TES) market in Sangli Miraj Kupwad faces challenges related to reducing the initial capital cost to make TES technologies more competitive with conventional energy solutions. Improving the energy density and reducing thermal losses of storage materials and systems are crucial for enhancing efficiency and reducing space requirements. Furthermore, establishing clear standards and regulations for TES performance and safety is necessary to build confidence and facilitate wider adoption. Promoting awareness and providing training to engineers, installers, and operators about TES technologies and their benefits is essential for market growth. Developing robust and reliable TES systems that can withstand the diverse climatic conditions in India is also important. Finally, scaling up the manufacturing and deployment of TES technologies to meet the growing demand requires significant investment and infrastructure development.
Thermal Energy Storage Market: Segmentation Insights
The global thermal energy storage market is segmented based on Technology, Storage Medium, Application, End-User, and Region. All the segments of the thermal energy storage market have been analyzed based on present & future trends and the market is estimated from 2024 to 2032.
Based on Technology, the global thermal energy storage market is divided into Sensible Heat Storage, Latent Heat Storage, Thermochemical Storage.
On the basis of Storage Medium, the global thermal energy storage market is bifurcated into Water, Molten Salt, Phase Change Materials (PCM), Others.
In terms of Application, the global thermal energy storage market is categorized into Power Generation, HVAC Systems, Process Heating & Cooling, District Heating & Cooling.
Based on End-User, the global thermal energy storage market is split into Utilities, Industrial, Commercial, Residential.
Thermal Energy Storage Market: Regional Insights
The Europe region dominates the global thermal energy storage market, holding over 38% of market share in 2023, driven by stringent renewable energy policies, high adoption of district heating systems, and ambitious EU decarbonization targets. Germany, Spain, and the Nordic countries lead the market, supported by government incentives for concentrated solar power (CSP) and industrial waste heat recovery projects.
North America follows, propelled by utility-scale energy storage deployments in the U.S., while Asia-Pacific shows the fastest growth (CAGR of 12-14% from 2024-2030) with China and India investing in grid stability solutions. Europe's leadership is reinforced by technological advancements in molten salt and phase-change materials, with the market projected to maintain dominance at a 7-8% CAGR through 2030, aligning with the EU's 55% renewable energy mandate.
Thermal Energy Storage Market: Competitive Landscape
The thermal energy storage market report offers a thorough analysis of both established and emerging players within the market. It includes a detailed list of key companies, categorized based on the types of products they offer and other relevant factors. The report also highlights the market entry year for each player, providing further context for the research analysis.
The "Global Thermal Energy Storage Market" study offers valuable insights, focusing on the global market landscape, with an emphasis on major industry players such as;
- Steffes Corporation
- FAFCO Thermal Storage Systems
- Goss Engineering Inc.
- Abengoa Solar S.A.
- Baltimore Aircoil Company
- EVAPCO Inc.
- Ice Lings
- TAS Energy
- BrightSource Energy Inc.
- Caldwell Energy
- Burns & McDonnell
- CALMAC
- Chicago Bridge & Iron Company (CB&I)
The Global Thermal Energy Storage Market is Segmented as Follows:
By Technology
- Sensible Heat Storage
- Latent Heat Storage
- Thermochemical Storage
By Storage Medium
- Water
- Molten Salt
- Phase Change Materials (PCM)
- Others
By Application
- Power Generation
- HVAC Systems
- Process Heating & Cooling
- District Heating & Cooling
By End-User
- Utilities
- Industrial
- Commercial
- Residential
By Region
- North America
- The U.S.
- Canada
- Mexico
- Europe
- France
- The UK
- Spain
- Germany
- Italy
- Rest of Europe
- Asia Pacific
- China
- Japan
- India
- Australia
- South Korea
- Rest of Asia Pacific
- The Middle East & Africa
- Saudi Arabia
- UAE
- Egypt
- Kuwait
- South Africa
- Rest of the Middle East & Africa
- Latin America
- Brazil
- Argentina
- Rest of Latin America
Market Evolution
This section evaluates the market position of the product or service by examining its development pathway and competitive dynamics. It provides a detailed overview of the product's growth stages, including the early (historical) phase, the mid-stage, and anticipated future advancements influenced by innovation and emerging technologies.
Porter’s Analysis
Porter’s Five Forces framework offers a strategic lens for assessing competitor behavior and the positioning of key players in the thermal energy storage industry. This section explores the external factors shaping competitive dynamics and influencing market strategies in the years ahead. The analysis focuses on five critical forces:
- Competitive Rivalry
- Threat of New Entrants
- Threat of Substitutes
- Supplier Bargaining Power
- Buyer Bargaining Power
Value Chain & Market Attractiveness Analysis
The value chain analysis helps businesses optimize operations by mapping the product flow from suppliers to end consumers, identifying opportunities to streamline processes and gain a competitive edge. Segment-wise market attractiveness analysis evaluates key dimensions like product categories, demographics, and regions, assessing growth potential, market size, and profitability. This enables businesses to focus resources on high-potential segments for better ROI and long-term value.
PESTEL Analysis
PESTEL analysis is a powerful tool in market research reports that enhances market understanding by systematically examining the external macro-environmental factors influencing a business or industry. The acronym stands for Political, Economic, Social, Technological, Environmental, and Legal factors. By evaluating these dimensions, PESTEL analysis provides a comprehensive overview of the broader context within which a market operates, helping businesses identify potential opportunities and threats.
- Political factors assess government policies, stability, trade regulations, and political risks that could impact market operations.
- Economic factors examine variables like inflation, exchange rates, economic growth, and consumer spending power to determine market viability.
- Social factors explore cultural trends, demographics, and lifestyle changes that shape consumer behavior and preferences.
- Technological factors evaluate innovation, R&D, and technological advancements affecting product development and operational efficiencies.
- Environmental factors focus on sustainability, climate change impacts, and eco-friendly practices shaping market trends.
- Legal factors address compliance requirements, industry regulations, and intellectual property laws impacting market entry and operations.
Import-Export Analysis & Pricing Analysis
An import-export analysis is vital for market research, revealing global trade dynamics, trends, and opportunities. It examines trade volumes, product categories, and regional competitiveness, offering insights into supply chains and market demand. This section also analyzes past and future pricing trends, helping businesses optimize strategies and enabling consumers to assess product value effectively.
Thermal Energy Storage Market: Company Profiles
The report identifies key players in the thermal energy storage market through a competitive landscape and company profiles, evaluating their offerings, financial performance, strategies, and market positioning. It includes a SWOT analysis of the top 3-5 companies, assessing strengths, weaknesses, opportunities, and threats. The competitive landscape highlights rankings, recent activities (mergers, acquisitions, partnerships, product launches), and regional footprints using the Ace matrix. Customization is available to meet client-specific needs.
Regional & Industry Footprint
This section details the geographic reach, sales networks, and market penetration of companies profiled in the thermal energy storage report, showcasing their operations and distribution across regions. It analyzes the alignment of companies with specific industry verticals, highlighting the industries they serve and the scope of their products and services within those sectors.
Ace Matrix
This section categorizes companies into four distinct groups—Active, Cutting Edge, Innovator, and Emerging—based on their product and business strategies. The evaluation of product strategy focuses on aspects such as the range and depth of offerings, commitment to innovation, product functionalities, and scalability. Key elements like global reach, sector coverage, strategic acquisitions, and long-term growth plans are considered for business strategy. This analysis provides a detailed view of companies' position within the market and highlights their potential for future growth and development.
Research Methodology
The qualitative and quantitative insights for the thermal energy storage market are derived through a multi-faceted research approach, combining input from subject matter experts, primary research, and secondary data sources. Primary research includes gathering critical information via face-to-face or telephonic interviews, surveys, questionnaires, and feedback from industry professionals, key opinion leaders (KOLs), and customers. Regular interviews with industry experts are conducted to deepen the analysis and reinforce the existing data, ensuring a robust and well-rounded market understanding.
Secondary research for this report was carried out by the Market Research Store team, drawing on a variety of authoritative sources, such as:
- Official company websites, annual reports, financial statements, investor presentations, and SEC filings
- Internal and external proprietary databases, as well as relevant patent and regulatory databases
- Government publications, national statistical databases, and industry-specific market reports
- Media coverage, including news articles, press releases, and webcasts about market participants
- Paid industry databases for detailed market insights
Market Research Store conducted in-depth consultations with various key opinion leaders in the industry, including senior executives from top companies and regional leaders from end-user organizations. This effort aimed to gather critical insights on factors such as the market share of dominant brands in specific countries and regions, along with pricing strategies for products and services.
To determine total sales data, the research team conducted primary interviews across multiple countries with influential stakeholders, including:
- Distributors
- Marketing, Brand, and Product Managers
- Procurement and Production Managers
- Sales and Regional Sales Managers, Country Managers
- Technical Specialists
- C-Level Executives
These subject matter experts, with their extensive industry experience, helped validate and refine the findings. For secondary research, data were sourced from a wide range of materials, including online resources, company annual reports, industry publications, research papers, association reports, and government websites. These various sources provide a comprehensive and well-rounded perspective on the market.
Frequently Asked Questions
Table Of Content
List of Tables and Figures Figure Product Picture of Thermal Energy Storage Table Product Specification of Thermal Energy Storage Figure Market Concentration Ratio and Market Maturity Analysis of Thermal Energy Storage Figure Global Thermal Energy Storage Value ($) and Growth Rate from 2014-2024 Table Different Types of Thermal Energy Storage Figure Global Thermal Energy Storage Value ($) Segment by Type from 2014-2019 Figure Water Picture Figure Molten Salt Picture Figure PCM Picture Table Different Applications of Thermal Energy Storage Figure Global Thermal Energy Storage Value ($) Segment by Applications from 2014-2019 Figure Power Generation Picture Figure District Heating and Cooling Picture Figure Process Heating and Cooling Picture Table Research Regions of Thermal Energy Storage Figure North America Thermal Energy Storage Production Value ($) and Growth Rate (2014-2019) Figure Europe Thermal Energy Storage Production Value ($) and Growth Rate (2014-2019) Table China Thermal Energy Storage Production Value ($) and Growth Rate (2014-2019) Table Japan Thermal Energy Storage Production Value ($) and Growth Rate (2014-2019) Table Middle East & Africa Thermal Energy Storage Production Value ($) and Growth Rate (2014-2019) Table India Thermal Energy Storage Production Value ($) and Growth Rate (2014-2019) Table South America Thermal Energy Storage Production Value ($) and Growth Rate (2014-2019) Table Emerging Countries of Thermal Energy Storage Table Growing Market of Thermal Energy Storage Figure Industry Chain Analysis of Thermal Energy Storage Table Upstream Raw Material Suppliers of Thermal Energy Storage with Contact Information Table Major Players Manufacturing Base and Market Share ($) of Thermal Energy Storage in 2018 Table Major Players Thermal Energy Storage Product Types in 2018 Figure Production Process of Thermal Energy Storage Figure Manufacturing Cost Structure of Thermal Energy Storage Figure Channel Status of Thermal Energy Storage Table Major Distributors of Thermal Energy Storage with Contact Information Table Major Downstream Buyers of Thermal Energy Storage with Contact Information Table Global Thermal Energy Storage Value ($) by Type (2014-2019) Table Global Thermal Energy Storage Value ($) Share by Type (2014-2019) Figure Global Thermal Energy Storage Value ($) Share by Type (2014-2019) Table Global Thermal Energy Storage Production by Type (2014-2019) Table Global Thermal Energy Storage Production Share by Type (2014-2019) Figure Global Thermal Energy Storage Production Share by Type (2014-2019) Figure Global Thermal Energy Storage Value ($) and Growth Rate of Water Figure Global Thermal Energy Storage Value ($) and Growth Rate of Molten Salt Figure Global Thermal Energy Storage Value ($) and Growth Rate of PCM Figure Global Thermal Energy Storage Price by Type (2014-2019) Table Global Thermal Energy Storage Consumption by Application (2014-2019) Table Global Thermal Energy Storage Consumption Market Share by Application (2014-2019) Figure Global Thermal Energy Storage Consumption Market Share by Application (2014-2019) Table Downstream Buyers Introduction by Application Figure Global Thermal Energy Storage Consumption and Growth Rate of Power Generation (2014-2019) Figure Global Thermal Energy Storage Consumption and Growth Rate of District Heating and Cooling (2014-2019) Figure Global Thermal Energy Storage Consumption and Growth Rate of Process Heating and Cooling (2014-2019) Table Global Thermal Energy Storage Value ($) by Region (2014-2019) Table Global Thermal Energy Storage Value ($) Market Share by Region (2014-2019) Figure Global Thermal Energy Storage Value ($) Market Share by Region (2014-2019) Table Global Thermal Energy Storage Production by Region (2014-2019) Table Global Thermal Energy Storage Production Market Share by Region (2014-2019) Figure Global Thermal Energy Storage Production Market Share by Region (2014-2019) Table Global Thermal Energy Storage Production, Value ($), Price and Gross Margin (2014-2019) Table North America Thermal Energy Storage Production, Value ($), Price and Gross Margin (2014-2019) Table Europe Thermal Energy Storage Production, Value ($), Price and Gross Margin (2014-2019) Table China Thermal Energy Storage Production, Value ($), Price and Gross Margin (2014-2019) Table Japan Thermal Energy Storage Production, Value ($), Price and Gross Margin (2014-2019) Table Middle East & Africa Thermal Energy Storage Production, Value ($), Price and Gross Margin (2014-2019) Table India Thermal Energy Storage Production, Value ($), Price and Gross Margin (2014-2019) Table South America Thermal Energy Storage Production, Value ($), Price and Gross Margin (2014-2019) Table Global Thermal Energy Storage Consumption by Regions (2014-2019) Figure Global Thermal Energy Storage Consumption Share by Regions (2014-2019) Table North America Thermal Energy Storage Production, Consumption, Export, Import (2014-2019) Table Europe Thermal Energy Storage Production, Consumption, Export, Import (2014-2019) Table China Thermal Energy Storage Production, Consumption, Export, Import (2014-2019) Table Japan Thermal Energy Storage Production, Consumption, Export, Import (2014-2019) Table Middle East & Africa Thermal Energy Storage Production, Consumption, Export, Import (2014-2019) Table India Thermal Energy Storage Production, Consumption, Export, Import (2014-2019) Table South America Thermal Energy Storage Production, Consumption, Export, Import (2014-2019) Figure North America Thermal Energy Storage Production and Growth Rate Analysis Figure North America Thermal Energy Storage Consumption and Growth Rate Analysis Figure North America Thermal Energy Storage SWOT Analysis Figure Europe Thermal Energy Storage Production and Growth Rate Analysis Figure Europe Thermal Energy Storage Consumption and Growth Rate Analysis Figure Europe Thermal Energy Storage SWOT Analysis Figure China Thermal Energy Storage Production and Growth Rate Analysis Figure China Thermal Energy Storage Consumption and Growth Rate Analysis Figure China Thermal Energy Storage SWOT Analysis Figure Japan Thermal Energy Storage Production and Growth Rate Analysis Figure Japan Thermal Energy Storage Consumption and Growth Rate Analysis Figure Japan Thermal Energy Storage SWOT Analysis Figure Middle East & Africa Thermal Energy Storage Production and Growth Rate Analysis Figure Middle East & Africa Thermal Energy Storage Consumption and Growth Rate Analysis Figure Middle East & Africa Thermal Energy Storage SWOT Analysis Figure India Thermal Energy Storage Production and Growth Rate Analysis Figure India Thermal Energy Storage Consumption and Growth Rate Analysis Figure India Thermal Energy Storage SWOT Analysis Figure South America Thermal Energy Storage Production and Growth Rate Analysis Figure South America Thermal Energy Storage Consumption and Growth Rate Analysis Figure South America Thermal Energy Storage SWOT Analysis Figure Top 3 Market Share of Thermal Energy Storage Companies Figure Top 6 Market Share of Thermal Energy Storage Companies Table Mergers, Acquisitions and Expansion Analysis Table Company Profiles Table Product Introduction Table Steffes Corporation Production, Value ($), Price, Gross Margin 2014-2019 Figure Steffes Corporation Production and Growth Rate Figure Steffes Corporation Value ($) Market Share 2014-2019 Figure Steffes Corporation Market Share of Thermal Energy Storage Segmented by Region in 2018 Table Company Profiles Table Product Introduction Table FAFCO Thermal Storage Systems Production, Value ($), Price, Gross Margin 2014-2019 Figure FAFCO Thermal Storage Systems Production and Growth Rate Figure FAFCO Thermal Storage Systems Value ($) Market Share 2014-2019 Figure FAFCO Thermal Storage Systems Market Share of Thermal Energy Storage Segmented by Region in 2018 Table Company Profiles Table Product Introduction Table Goss Engineering, Inc. Production, Value ($), Price, Gross Margin 2014-2019 Figure Goss Engineering, Inc. Production and Growth Rate Figure Goss Engineering, Inc. Value ($) Market Share 2014-2019 Figure Goss Engineering, Inc. Market Share of Thermal Energy Storage Segmented by Region in 2018 Table Company Profiles Table Product Introduction Table Abengoa Solar, S.A. Production, Value ($), Price, Gross Margin 2014-2019 Figure Abengoa Solar, S.A. Production and Growth Rate Figure Abengoa Solar, S.A. Value ($) Market Share 2014-2019 Figure Abengoa Solar, S.A. Market Share of Thermal Energy Storage Segmented by Region in 2018 Table Company Profiles Table Product Introduction Table Baltimore Aircoil Company Production, Value ($), Price, Gross Margin 2014-2019 Figure Baltimore Aircoil Company Production and Growth Rate Figure Baltimore Aircoil Company Value ($) Market Share 2014-2019 Figure Baltimore Aircoil Company Market Share of Thermal Energy Storage Segmented by Region in 2018 Table Company Profiles Table Product Introduction Table EVAPCO, Inc. Production, Value ($), Price, Gross Margin 2014-2019 Figure EVAPCO, Inc. Production and Growth Rate Figure EVAPCO, Inc. Value ($) Market Share 2014-2019 Figure EVAPCO, Inc. Market Share of Thermal Energy Storage Segmented by Region in 2018 Table Company Profiles Table Product Introduction Table Ice Lings Production, Value ($), Price, Gross Margin 2014-2019 Figure Ice Lings Production and Growth Rate Figure Ice Lings Value ($) Market Share 2014-2019 Figure Ice Lings Market Share of Thermal Energy Storage Segmented by Region in 2018 Table Company Profiles Table Product Introduction Table TAS Energy Production, Value ($), Price, Gross Margin 2014-2019 Figure TAS Energy Production and Growth Rate Figure TAS Energy Value ($) Market Share 2014-2019 Figure TAS Energy Market Share of Thermal Energy Storage Segmented by Region in 2018 Table Company Profiles Table Product Introduction Table BrightSource Energy, Inc. Production, Value ($), Price, Gross Margin 2014-2019 Figure BrightSource Energy, Inc. Production and Growth Rate Figure BrightSource Energy, Inc. Value ($) Market Share 2014-2019 Figure BrightSource Energy, Inc. Market Share of Thermal Energy Storage Segmented by Region in 2018 Table Company Profiles Table Product Introduction Table Caldwell Energy Production, Value ($), Price, Gross Margin 2014-2019 Figure Caldwell Energy Production and Growth Rate Figure Caldwell Energy Value ($) Market Share 2014-2019 Figure Caldwell Energy Market Share of Thermal Energy Storage Segmented by Region in 2018 Table Company Profiles Table Product Introduction Table Burns & McDonnell Production, Value ($), Price, Gross Margin 2014-2019 Figure Burns & McDonnell Production and Growth Rate Figure Burns & McDonnell Value ($) Market Share 2014-2019 Figure Burns & McDonnell Market Share of Thermal Energy Storage Segmented by Region in 2018 Table Company Profiles Table Product Introduction Table CALMAC Production, Value ($), Price, Gross Margin 2014-2019 Figure CALMAC Production and Growth Rate Figure CALMAC Value ($) Market Share 2014-2019 Figure CALMAC Market Share of Thermal Energy Storage Segmented by Region in 2018 Table Company Profiles Table Product Introduction Table Chicago Bridge & Iron Company (CB&I) Production, Value ($), Price, Gross Margin 2014-2019 Figure Chicago Bridge & Iron Company (CB&I) Production and Growth Rate Figure Chicago Bridge & Iron Company (CB&I) Value ($) Market Share 2014-2019 Figure Chicago Bridge & Iron Company (CB&I) Market Share of Thermal Energy Storage Segmented by Region in 2018 Table Global Thermal Energy Storage Market Value ($) Forecast, by Type Table Global Thermal Energy Storage Market Volume Forecast, by Type Figure Global Thermal Energy Storage Market Value ($) and Growth Rate Forecast of Water (2019-2024) Figure Global Thermal Energy Storage Market Volume and Growth Rate Forecast of Water (2019-2024) Figure Global Thermal Energy Storage Market Value ($) and Growth Rate Forecast of Molten Salt (2019-2024) Figure Global Thermal Energy Storage Market Volume and Growth Rate Forecast of Molten Salt (2019-2024) Figure Global Thermal Energy Storage Market Value ($) and Growth Rate Forecast of PCM (2019-2024) Figure Global Thermal Energy Storage Market Volume and Growth Rate Forecast of PCM (2019-2024) Table Global Market Value ($) Forecast by Application (2019-2024) Table Global Market Volume Forecast by Application (2019-2024) Figure Global Thermal Energy Storage Consumption and Growth Rate of Power Generation (2014-2019) Figure Global Thermal Energy Storage Consumption and Growth Rate of District Heating and Cooling (2014-2019) Figure Global Thermal Energy Storage Consumption and Growth Rate of Process Heating and Cooling (2014-2019) Figure Market Value ($) and Growth Rate Forecast of Process Heating and Cooling (2019-2024) Figure Market Volume and Growth Rate Forecast of Process Heating and Cooling (2019-2024) Figure North America Market Value ($) and Growth Rate Forecast (2019-2024) Table North America Consumption and Growth Rate Forecast (2019-2024) Figure Europe Market Value ($) and Growth Rate Forecast (2019-2024) Table Europe Consumption and Growth Rate Forecast (2019-2024) Figure China Market Value ($) and Growth Rate Forecast (2019-2024) Table China Consumption and Growth Rate Forecast (2019-2024) Figure Japan Market Value ($) and Growth Rate Forecast (2019-2024) Table Japan Consumption and Growth Rate Forecast (2019-2024) Figure Middle East & Africa Market Value ($) and Growth Rate Forecast (2019-2024) Table Middle East & Africa Consumption and Growth Rate Forecast (2019-2024) Figure India Market Value ($) and Growth Rate Forecast (2019-2024) Table India Consumption and Growth Rate Forecast (2019-2024) Figure South America Market Value ($) and Growth Rate Forecast (2019-2024) Table South America Consumption and Growth Rate Forecast (2019-2024) Figure Industry Resource/Technology/Labor Importance Analysis Table New Entrants SWOT Analysis Table New Project Analysis of Investment Recovery
Inquiry For Buying
Thermal Energy Storage
Request Sample
Thermal Energy Storage