Agar Market Size, Share, and Trends Analysis Report
CAGR :

| Market Size 2023 (Base Year) | USD 502.99 Million |
| Market Size 2032 (Forecast Year) | USD 789.72 Million |
| CAGR | 5.14% |
| Forecast Period | 2024 - 2032 |
| Historical Period | 2018 - 2023 |
Agar Market Insights
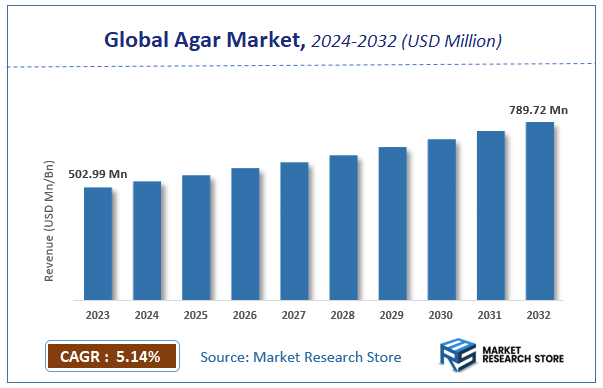
According to Market Research Store, the global agar market size was valued at around USD 502.99 million in 2023 and is estimated to reach USD 789.72 million by 2032, to register a CAGR of approximately 5.14% in terms of revenue during the forecast period 2024-2032.
The agar report provides a comprehensive analysis of the market, including its size, share, growth trends, revenue details, and other crucial information regarding the target market. It also covers the drivers, restraints, opportunities, and challenges till 2032.
Global Agar Market: Overview
Agar is a gelatinous substance derived primarily from red algae, particularly species like Gelidium and Gracilaria. It is widely known for its use as a vegetarian substitute for gelatin and is commonly utilized as a gelling agent in food products, microbiological culture media, pharmaceuticals, and cosmetics. In the food industry, agar is valued for its ability to stabilize, thicken, and improve texture in items such as desserts, jellies, and dairy alternatives. In microbiology, it serves as a solid medium for culturing bacteria and fungi due to its stable gel formation and resistance to degradation by most microorganisms.
Key Highlights
- The agar market is anticipated to grow at a CAGR of 5.14% during the forecast period.
- The global agar market was estimated to be worth approximately USD 502.99 million in 2023 and is projected to reach a value of USD 789.72 million by 2032.
- The growth of the agar market is being driven by increasing consumer preference for plant-based ingredients, rising demand in biotechnology research, and expanding applications in cosmetics and healthcare products.
- Based on the form, the powder form segment is growing at a high rate and is projected to dominate the market.
- On the basis of type, the wild harvest gracilaria agar segment is projected to swipe the largest market share.
- In terms of application, the food and beverage segment is expected to dominate the market.
- By region, Asia Pacific is expected to dominate the global market during the forecast period.
Agar Market: Dynamics
Key Growth Drivers:
- Rising Demand in Food & Beverage Industry: Agar is widely used as a gelling, stabilizing, and thickening agent in products like jellies, bakery fillings, dairy, and plant-based alternatives, driving its market demand.
- Increasing Popularity of Vegan and Plant-Based Products: As consumers shift toward vegetarian and vegan diets, agar serves as a popular substitute for gelatin, which is animal-derived, fueling its adoption.
- Expanding Use in Pharmaceuticals and Biotechnology: Agar’s application in microbiological culture media and drug delivery systems is growing due to its biocompatibility and natural origin.
Restraints:
- Dependence on Limited Raw Material Sources: Agar is mainly derived from specific red algae, which are regionally harvested, making the supply vulnerable to climate conditions and overharvesting.
- Price Volatility Due to Seasonal Harvesting: The cost of agar can fluctuate significantly because it is subject to seasonal changes and marine ecosystem variations.
- Limited Awareness in Developing Markets: In many emerging economies, the benefits and applications of agar remain underutilized due to a lack of consumer and industrial awareness.
Opportunities:
- Growth in Nutraceuticals and Functional Foods: The increasing consumer preference for health-oriented and clean-label ingredients is boosting agar’s use in nutritional supplements and functional beverages.
- Emergence of 3D Bioprinting and Tissue Engineering: Agar is gaining interest in emerging biomedical applications like 3D cell culture and bio-inks, providing new market avenues.
- R&D in Eco-Friendly Packaging Materials: Agar-based bioplastics are being explored as a sustainable alternative to petroleum-based packaging, offering long-term growth prospects.
Challenges:
- Quality and Standardization Issues: Variation in the quality of agar based on geographic source and harvesting practices can impact consistency and limit its use in regulated industries like pharma.
- Competition from Other Hydrocolloids: Alternatives like carrageenan, xanthan gum, and pectin often compete with agar due to their lower cost or better performance in specific formulations.
- Sustainability Concerns Around Overharvesting: Unsustainable seaweed farming and harvesting practices pose ecological risks and threaten long-term agar availability.
Agar Market: Report Scope
| Report Attributes | Report Details |
|---|---|
| Report Name | Agar Market |
| Market Size in 2023 | USD 502.99 Million |
| Market Forecast in 2032 | USD 789.72 Million |
| Growth Rate | CAGR of 5.14% |
| Number of Pages | 165 |
| Key Companies Covered | Neogen Food Safety, AgarGel, HISPANAGAR, Sobigel, AGARMEX, S.A., Meron, INDUSTRIAS ROKO S.A., Hispanagar, PT. Agarindo Bogatama, Merck KGaA, SETEXAM, MARINE SCIENCE CO., LTD., MSC Co.,Ltd., Green Fresh Group, Fujian Wuyi Feiyan Agar, Kingyen, Agar Brasileiro, Shantou Chenghai District Agar Glue Factory, Taike Biotechnology Huey shyang, Fuli Agar Factory, Global BioIngredients, Mingfu Fujian Agar Co., Iberagar, Marine Hydrocolloids, B&V Agar, ROKO, and Others |
| Segments Covered | By Form Type, By Type, By Application, By, And By Region |
| Regions Covered | North America, Europe, Asia Pacific (APAC), Latin America, Middle East, and Africa (MEA) |
| Base Year | 2023 |
| Historical Year | 2018 to 2023 |
| Forecast Year | 2024 to 2032 |
| Customization Scope | Avail customized purchase options to meet your exact research needs. Request For Customization |
Agar Market: Segmentation Insights
The global agar market is divided by form, type, application, and region.
Based on form, the global agar market is divided into powder, strip, and others. In the agar market, powder form is the most dominant segment due to its ease of use, longer shelf life, and high solubility. It is widely preferred in food processing, pharmaceuticals, and microbiology because it can be easily mixed into various formulations and allows precise dosing. The powdered form is ideal for mass production and industrial applications, making it the top choice across both developed and developing markets. Strip form follows as the second most significant segment, commonly used in traditional and household cooking, particularly in Asian countries. Although less convenient than powder for industrial use, agar strips are valued for their purity and are often chosen for recipes that require slow gelling or specific textural qualities. They retain a strong presence in regions with long-established culinary practices involving agar.
On the basis of type, the global agar market is bifurcated into wild harvest gracilaria agar, wild harvest gelidium agar, aquafarm gracilaria agar, aquafarm gelidium agar, and others. Wild Harvest Gracilaria Agar is the most dominant type, primarily due to the widespread availability of Gracilaria species in coastal regions and the cost-effectiveness of harvesting them from natural habitats. This type of agar is commonly used in food processing and industrial applications where moderate gel strength is sufficient. Its broad utility and relatively lower production cost contribute to its leading market share. Wild Harvest Gelidium Agar follows closely behind, known for producing high-quality agar with superior gel strength and clarity. It is preferred for high-end applications, especially in microbiological and pharmaceutical industries where purity and consistency are critical. However, the limited availability and higher cost of Gelidium restrict its use to more specialized sectors.
In terms of application, the global agar market is bifurcated into pharmaceuticals, food & beverage (beverages, meat products, dairy, bakery, snacks/instant noodles, and confectionary), and others. The food and beverage sector is the most dominant application segment, driven by its extensive use across a wide range of products. Within this category, agar is widely used in confectionery and bakery items for its gelling, thickening, and stabilizing properties. In dairy products and meat alternatives, it acts as a texturizer and vegetarian gelatin substitute. It is also used in beverages like plant-based drinks and functional health beverages to improve mouthfeel and consistency. The snacks and instant noodles subsegment use agar for enhancing texture and shelf life, further fueling demand. The pharmaceutical sector follows as the second-largest segment, where agar plays a crucial role in preparing culture media for microbiological testing and in the formulation of capsules, syrups, and topical gels.
Agar Market: Regional Insights
- Asia Pacific is expected to dominates the global market
Asia Pacific dominates the global agar market due to its abundant availability of red algae and the long-standing tradition of using agar in various culinary and industrial applications. Countries such as China, Japan, Indonesia, and South Korea are leading producers and consumers. The region benefits from cost-effective labor, established harvesting and processing infrastructure, and strong demand across food, pharmaceutical, and biotechnology sectors. The growing preference for plant-based ingredients and increased export activity further strengthen Asia Pacific's market position.
Europe holds the second-largest share in the agar market, driven by rising demand for clean-label, vegan, and organic food products. The region has a mature food processing industry that frequently uses agar in confectionery, dairy alternatives, and bakery items. Additionally, strict regulations favoring natural additives and significant use in pharmaceutical and microbiological applications contribute to the consistent demand across European countries such as Germany, France, and the UK.
North America follows closely, with strong demand stemming from the food and beverage industry, as well as the biotechnology and pharmaceutical sectors. The growing trend of veganism and plant-based diets fuels the use of agar in food products, while the presence of advanced life sciences research supports its widespread use in laboratory culture media. The United States leads the region in consumption due to its robust food technology landscape and ongoing innovations in the biotech field.
Latin America represents a growing market for agar, especially in countries like Brazil and Mexico where agar is increasingly being used in processed foods and confections. While production is limited compared to other regions, imports support domestic needs. Gradual industrial development and rising awareness of plant-based and functional ingredients contribute to steady growth in this region’s agar market.
Middle East and Africa currently hold the smallest share of the global agar market. Usage is still in its early stages, mainly limited to niche food applications and select pharmaceutical uses. However, increasing urbanization, health awareness, and evolving food consumption patterns are slowly driving demand. As infrastructure and market awareness develop, this region is expected to show moderate future potential.
Agar Market: Competitive Landscape
The report provides an in-depth analysis of companies operating in the agar market, including their geographic presence, business strategies, product offerings, market share, and recent developments. This analysis helps to understand market competition.
Some of the major players in the global agar market include:
- Neogen Food Safety
- AgarGel
- HISPANAGAR
- Sobigel
- AGARMEX
- S.A.
- Meron
- INDUSTRIAS ROKO S.A.
- Hispanagar
- PT. Agarindo Bogatama
- Merck KGaA
- SETEXAM
- MARINE SCIENCE CO., LTD.
- MSC Co. Ltd.
- Green Fresh Group
- Fujian Wuyi Feiyan Agar
- Kingyen
- Agar Brasileiro
- Shantou Chenghai District Agar Glue Factory
- Taike Biotechnology Huey shyang
- Fuli Agar Factory
- Global BioIngredients
- Mingfu Fujian Agar Co.
- Iberagar
- Marine Hydrocolloids
- B&V Agar
- ROKO
The global agar market is segmented as follows:
By Form
- Powder
- Strip
- Others
By Type
- Wild Harvest Gracilaria Agar
- Wild Harvest Gelidium Agar
- Aquafarm Gracilaria Agar
- Aquafarm Gelidium Agar
- Others
By Application
- Pharmaceuticals
- Food and Beverage
- Beverages
- Meat Products
- Dairy
- Bakery
- Snacks/Instant Noodles
- Confectionary
- and Others
- Others
By Region
- North America
- U.S.
- Canada
- Europe
- U.K.
- France
- Germany
- Rest of Europe
- Asia Pacific
- China
- Japan
- India
- South Korea
- Rest of Asia Pacific
- Latin America
- Brazil
- Rest of Latin America
- The Middle East and Africa
- GCC Countries
- South Africa
- Rest of Middle East Africa
Frequently Asked Questions
Table Of Content
- Chapter 1 Executive Summary
- 1.1. Introduction of Agar
- 1.2. Global Agar Market, 2019 & 2026 (USD Million)
- 1.3. Global Agar Market, 2016 – 2026 (USD Million) (Kilo Tons)
- 1.4. Global Agar Market Absulute Revenue Opportunity, 2016 – 2026 (USD Million)
- 1.5. Global Agar Market Incremental Revenue Opportunity, 2020 – 2026 (USD Million)
- Chapter 2 Agar Market – Form Analysis
- 2.1. Global Agar Market – Form Overview
- 2.2. Global Agar Market Share, by Form, 2019 & 2026 (USD Million)
- 2.3. Global Agar Market share, by Form, 2019 & 2026 (Kilo Tons)
- 2.4. Powder
- 2.4.1. Global Powder Agar Market, 2016 – 2026 (USD Million)
- 2.4.2. Global Powder Agar Market, 2016 – 2026 (Kilo Tons)
- 2.5. Strip
- 2.5.1. Global Strip Agar Market, 2016 – 2026 (USD Million)
- 2.5.2. Global Strip Agar Market, 2016 – 2026 (Kilo Tons)
- 2.6. Others
- 2.6.1. Global Others Agar Market, 2016 – 2026 (USD Million)
- 2.6.2. Global Others Agar Market, 2016 – 2026 (Kilo Tons)
- Chapter 3 Agar Market – Type Analysis
- 3.1. Global Agar Market – Type Overview
- 3.2. Global Agar Market Share, by Type, 2019 & 2026 (USD Million)
- 3.3. Global Agar Market share, by Type, 2019 & 2026 (Kilo Tons)
- 3.4. Wild Harvest Gracilaria Agar
- 3.4.1. Global Wild Harvest Gracilaria Agar Agar Market, 2016 – 2026 (USD Million)
- 3.4.2. Global Wild Harvest Gracilaria Agar Agar Market, 2016 – 2026 (Kilo Tons)
- 3.5. Wild Harvest Gelidium Agar
- 3.5.1. Global Wild Harvest Gelidium Agar Agar Market, 2016 – 2026 (USD Million)
- 3.5.2. Global Wild Harvest Gelidium Agar Agar Market, 2016 – 2026 (Kilo Tons)
- 3.6. Aquafarm Gracilaria Agar
- 3.6.1. Global Aquafarm Gracilaria Agar Agar Market, 2016 – 2026 (USD Million)
- 3.6.2. Global Aquafarm Gracilaria Agar Agar Market, 2016 – 2026 (Kilo Tons)
- 3.7. Aquafarm Gelidium Agar
- 3.7.1. Global Aquafarm Gelidium Agar Agar Market, 2016 – 2026 (USD Million)
- 3.7.2. Global Aquafarm Gelidium Agar Agar Market, 2016 – 2026 (Kilo Tons)
- 3.8. Others
- 3.8.1. Global Others Agar Market, 2016 – 2026 (USD Million)
- 3.8.2. Global Others Agar Market, 2016 – 2026 (Kilo Tons)
- Chapter 4 Agar Market – Application Analysis
- 4.1. Global Agar Market – Application Overview
- 4.2. Global Agar Market Share, by Application, 2019 & 2026 (USD Million)
- 4.3. Global Agar Market share, by Application, 2019 & 2026 (Kilo Tons)
- 4.4. Pharmaceuticals
- 4.4.1. Global Pharmaceuticals Agar Market, 2016 – 2026 (USD Million)
- 4.4.2. Global Pharmaceuticals Agar Market, 2016 – 2026 (Kilo Tons)
- 4.5. Food and Beverage
- 4.5.1. Global Food and Beverage Agar Market, 2016 – 2026 (USD Million)
- 4.5.2. Global Food and Beverage Agar Market, 2016 – 2026 (Kilo Tons)
- 4.6. Others
- 4.6.1. Global Others Agar Market, 2016 – 2026 (USD Million)
- 4.6.2. Global Others Agar Market, 2016 – 2026 (Kilo Tons)
- Chapter 5 Agar Market – Food and Beverage Analysis
- 5.1. Global Agar Market – Food and Beverage Overview
- 5.2. Global Agar Market Share, by Food and Beverage, 2019 & 2026 (USD Million)
- 5.3. Global Agar Market share, by Food and Beverage, 2019 & 2026 (Kilo Tons)
- 5.4. Beverage
- 5.4.1. Global Beverage Agar Market, 2016 – 2026 (USD Million)
- 5.4.2. Global Beverage Agar Market, 2016 – 2026 (Kilo Tons)
- 5.5. Meat Products
- 5.5.1. Global Meat Products Agar Market, 2016 – 2026 (USD Million)
- 5.5.2. Global Meat Products Agar Market, 2016 – 2026 (Kilo Tons)
- 5.6. Dairy
- 5.6.1. Global Dairy Agar Market, 2016 – 2026 (USD Million)
- 5.6.2. Global Dairy Agar Market, 2016 – 2026 (Kilo Tons)
- 5.7. Bakery
- 5.7.1. Global Bakery Agar Market, 2016 – 2026 (USD Million)
- 5.7.2. Global Bakery Agar Market, 2016 – 2026 (Kilo Tons)
- 5.8. Snacks/Instant Noodles
- 5.8.1. Global Snacks/Instant Noodles Agar Market, 2016 – 2026 (USD Million)
- 5.8.2. Global Snacks/Instant Noodles Agar Market, 2016 – 2026 (Kilo Tons)
- 5.9. Confectionary
- 5.9.1. Global Confectionary Agar Market, 2016 – 2026 (USD Million)
- 5.9.2. Global Confectionary Agar Market, 2016 – 2026 (Kilo Tons)
- 5.10. Others
- 5.10.1. Global Others Agar Market, 2016 – 2026 (USD Million)
- 5.10.2. Global Others Agar Market, 2016 – 2026 (Kilo Tons)
- Chapter 6 Agar Market – Regional Analysis
- 6.1. Global Agar Market Regional Overview
- 6.2. Global Agar Market Share, by Region, 2019 & 2026 (USD Million)
- 6.3. Global Agar Market Share, by Region, 2019 & 2026 (Kilo Tons)
- 6.4. North America
- 6.4.1. North America Agar Market, 2016 – 2026 (USD Million)
- 6.4.1.1. North America Agar Market, by Country, 2016 – 2026 (USD Million)
- 6.4.2. North America Market, 2016 – 2026 (Kilo Tons)
- 6.4.2.1. North America Agar Market, by Country, 2016 – 2026 (Kilo Tons)
- 6.4.3. North America Agar Market, by Form, 2016 – 2026
- 6.4.3.1. North America Agar Market, by Form, 2016 – 2026 (USD Million)
- 6.4.3.2. North America Agar Market, by Form, 2016 – 2026 (Kilo Tons)
- 6.4.4. North America Agar Market, by Type, 2016 – 2026
- 6.4.4.1. North America Agar Market, by Type, 2016 – 2026 (USD Million)
- 6.4.4.2. North America Agar Market, by Type, 2016 – 2026 (Kilo Tons)
- 6.4.5. North America Agar Market, by Application, 2016 – 2026
- 6.4.5.1. North America Agar Market, by Application, 2016 – 2026 (USD Million)
- 6.4.5.2. North America Agar Market, by Application, 2016 – 2026 (Kilo Tons)
- 6.4.6. North America Agar Market, by Food and Beverage, 2016 – 2026
- 6.4.6.1. North America Agar Market, by Food and Beverage, 2016 – 2026 (USD Million)
- 6.4.6.2. North America Agar Market, by Food and Beverage, 2016 – 2026 (Kilo Tons)
- 6.4.7. U.S.
- 6.4.7.1. U.S. Agar Market, 2016 – 2026 (USD Million)
- 6.4.7.2. U.S. Agar Market, 2016 – 2026 (Kilo Tons)
- 6.4.8. Canada
- 6.4.8.1. Canada Agar Market, 2016 – 2026 (USD Million)
- 6.4.8.2. Canada Agar Market, 2016 – 2026 (Kilo Tons)
- 6.4.1. North America Agar Market, 2016 – 2026 (USD Million)
- 6.5. Europe
- 6.5.1. Europe Agar Market, 2016 – 2026 (USD Million)
- 6.5.1.1. Europe Agar Market, by Country, 2016 – 2026 (USD Million)
- 6.5.2. Europe Market, 2016 – 2026 (Kilo Tons)
- 6.5.2.1. Europe Agar Market, by Country, 2016 – 2026 (Kilo Tons)
- 6.5.3. Europe Agar Market, by Form, 2016 – 2026
- 6.5.3.1. Europe Agar Market, by Form, 2016 – 2026 (USD Million)
- 6.5.3.2. Europe Agar Market, by Form, 2016 – 2026 (Kilo Tons)
- 6.5.4. Europe Agar Market, by Type, 2016 – 2026
- 6.5.4.1. Europe Agar Market, by Type, 2016 – 2026 (USD Million)
- 6.5.4.2. Europe Agar Market, by Type, 2016 – 2026 (Kilo Tons)
- 6.5.5. Europe Agar Market, by Application, 2016 – 2026
- 6.5.5.1. Europe Agar Market, by Application, 2016 – 2026 (USD Million)
- 6.5.5.2. Europe Agar Market, by Application, 2016 – 2026 (Kilo Tons)
- 6.5.6. Europe Agar Market, by Food and Beverage, 2016 – 2026
- 6.5.6.1. Europe Agar Market, by Food and Beverage, 2016 – 2026 (USD Million)
- 6.5.6.2. Europe Agar Market, by Food and Beverage, 2016 – 2026 (Kilo Tons)
- 6.5.7. Germany
- 6.5.7.1. Germany Agar Market, 2016 – 2026 (USD Million)
- 6.5.7.2. Germany Agar Market, 2016 – 2026 (Kilo Tons)
- 6.5.8. France
- 6.5.8.1. France Agar Market, 2016 – 2026 (USD Million)
- 6.5.8.2. France Agar Market, 2016 – 2026 (Kilo Tons)
- 6.5.9. U.K.
- 6.5.9.1. U.K. Agar Market, 2016 – 2026 (USD Million)
- 6.5.9.2. U.K. Agar Market, 2016 – 2026 (Kilo Tons)
- 6.5.10. Italy
- 6.5.10.1. Italy Agar Market, 2016 – 2026 (USD Million)
- 6.5.10.2. Italy Agar Market, 2016 – 2026 (Kilo Tons)
- 6.5.11. Spain
- 6.5.11.1. Spain Agar Market, 2016 – 2026 (USD Million)
- 6.5.11.2. Spain Agar Market, 2016 – 2026 (Kilo Tons)
- 6.5.12. Rest of Europe
- 6.5.12.1. Rest of Europe Agar Market, 2016 – 2026 (USD Million)
- 6.5.12.2. Rest of Europe Agar Market, 2016 – 2026 (Kilo Tons)
- 6.5.1. Europe Agar Market, 2016 – 2026 (USD Million)
- 6.6. Asia Pacific
- 6.6.1. Asia Pacific Agar Market, 2016 – 2026 (USD Million)
- 6.6.1.1. Asia Pacific Agar Market, by Country, 2016 – 2026 (USD Million)
- 6.6.2. Asia Pacific Market, 2016 – 2026 (Kilo Tons)
- 6.6.2.1. Asia Pacific Agar Market, by Country, 2016 – 2026 (Kilo Tons)
- 6.6.3. Asia Pacific Agar Market, by Form, 2016 – 2026
- 6.6.3.1. Asia Pacific Agar Market, by Form, 2016 – 2026 (USD Million)
- 6.6.3.2. Asia Pacific Agar Market, by Form, 2016 – 2026 (Kilo Tons)
- 6.6.4. Asia Pacific Agar Market, by Type, 2016 – 2026
- 6.6.4.1. Asia Pacific Agar Market, by Type, 2016 – 2026 (USD Million)
- 6.6.4.2. Asia Pacific Agar Market, by Type, 2016 – 2026 (Kilo Tons)
- 6.6.5. Asia Pacific Agar Market, by Application, 2016 – 2026
- 6.6.5.1. Asia Pacific Agar Market, by Application, 2016 – 2026 (USD Million)
- 6.6.5.2. Asia Pacific Agar Market, by Application, 2016 – 2026 (Kilo Tons)
- 6.6.6. Asia Pacific Agar Market, by Food and Beverage, 2016 – 2026
- 6.6.6.1. Asia Pacific Agar Market, by Food and Beverage, 2016 – 2026 (USD Million)
- 6.6.6.2. Asia Pacific Agar Market, by Food and Beverage, 2016 – 2026 (Kilo Tons)
- 6.6.7. China
- 6.6.7.1. China Agar Market, 2016 – 2026 (USD Million)
- 6.6.7.2. China Agar Market, 2016 – 2026 (Kilo Tons)
- 6.6.8. Japan
- 6.6.8.1. Japan Agar Market, 2016 – 2026 (USD Million)
- 6.6.8.2. Japan Agar Market, 2016 – 2026 (Kilo Tons)
- 6.6.9. India
- 6.6.9.1. India Agar Market, 2016 – 2026 (USD Million)
- 6.6.9.2. India Agar Market, 2016 – 2026 (Kilo Tons)
- 6.6.10. South Korea
- 6.6.10.1. South Korea Agar Market, 2016 – 2026 (USD Million)
- 6.6.10.2. South Korea Agar Market, 2016 – 2026 (Kilo Tons)
- 6.6.11. South-East Asia
- 6.6.11.1. South-East Asia Agar Market, 2016 – 2026 (USD Million)
- 6.6.11.2. South-East Asia Agar Market, 2016 – 2026 (Kilo Tons)
- 6.6.12. Rest of Asia Pacific
- 6.6.12.1. Rest of Asia Pacific Agar Market, 2016 – 2026 (USD Million)
- 6.6.12.2. Rest of Asia Pacific Agar Market, 2016 – 2026 (Kilo Tons)
- 6.6.1. Asia Pacific Agar Market, 2016 – 2026 (USD Million)
- 6.7. Latin America
- 6.7.1. Latin America Agar Market, 2016 – 2026 (USD Million)
- 6.7.1.1. Latin America Agar Market, by Country, 2016 – 2026 (USD Million)
- 6.7.2. Latin America Market, 2016 – 2026 (Kilo Tons)
- 6.7.2.1. Latin America Agar Market, by Country, 2016 – 2026 (Kilo Tons)
- 6.7.3. Latin America Agar Market, by Form, 2016 – 2026
- 6.7.3.1. Latin America Agar Market, by Form, 2016 – 2026 (USD Million)
- 6.7.3.2. Latin America Agar Market, by Form, 2016 – 2026 (Kilo Tons)
- 6.7.4. Latin America Agar Market, by Type, 2016 – 2026
- 6.7.4.1. Latin America Agar Market, by Type, 2016 – 2026 (USD Million)
- 6.7.4.2. Latin America Agar Market, by Type, 2016 – 2026 (Kilo Tons)
- 6.7.5. Latin America Agar Market, by Application, 2016 – 2026
- 6.7.5.1. Latin America Agar Market, by Application, 2016 – 2026 (USD Million)
- 6.7.5.2. Latin America Agar Market, by Application, 2016 – 2026 (Kilo Tons)
- 6.7.6. Latin America Agar Market, by Food and Beverage, 2016 – 2026
- 6.7.6.1. Latin America Agar Market, by Food and Beverage, 2016 – 2026 (USD Million)
- 6.7.6.2. Latin America Agar Market, by Food and Beverage, 2016 – 2026 (Kilo Tons)
- 6.7.7. Brazil
- 6.7.7.1. Brazil Agar Market, 2016 – 2026 (USD Million)
- 6.7.7.2. Brazil Agar Market, 2016 – 2026 (Kilo Tons)
- 6.7.8. Mexico
- 6.7.8.1. Mexico Agar Market, 2016 – 2026 (USD Million)
- 6.7.8.2. Mexico Agar Market, 2016 – 2026 (Kilo Tons)
- 6.7.9. Rest of Latin America
- 6.7.9.1. Rest of Latin America Agar Market, 2016 – 2026 (USD Million)
- 6.7.9.2. Rest of Latin America Agar Market, 2016 – 2026 (Kilo Tons)
- 6.7.1. Latin America Agar Market, 2016 – 2026 (USD Million)
- 6.8. The Middle-East and Africa
- 6.8.1. The Middle-East and Africa Agar Market, 2016 – 2026 (USD Million)
- 6.8.1.1. The Middle-East and Africa Agar Market, by Country, 2016 – 2026 (USD Million)
- 6.8.2. The Middle-East and Africa Market, 2016 – 2026 (Kilo Tons)
- 6.8.2.1. The Middle-East and Africa Agar Market, by Country, 2016 – 2026 (Kilo Tons)
- 6.8.3. The Middle-East and Africa Agar Market, by Form, 2016 – 2026
- 6.8.3.1. The Middle-East and Africa Agar Market, by Form, 2016 – 2026 (USD Million)
- 6.8.3.2. The Middle-East and Africa Agar Market, by Form, 2016 – 2026 (Kilo Tons)
- 6.8.4. The Middle-East and Africa Agar Market, by Type, 2016 – 2026
- 6.8.4.1. The Middle-East and Africa Agar Market, by Type, 2016 – 2026 (USD Million)
- 6.8.4.2. The Middle-East and Africa Agar Market, by Type, 2016 – 2026 (Kilo Tons)
- 6.8.5. The Middle-East and Africa Agar Market, by Application, 2016 – 2026
- 6.8.5.1. The Middle-East and Africa Agar Market, by Application, 2016 – 2026 (USD Million)
- 6.8.5.2. The Middle-East and Africa Agar Market, by Application, 2016 – 2026 (Kilo Tons)
- 6.8.6. The Middle-East and Africa Agar Market, by Food and Beverage, 2016 – 2026
- 6.8.6.1. The Middle-East and Africa Agar Market, by Food and Beverage, 2016 – 2026 (USD Million)
- 6.8.6.2. The Middle-East and Africa Agar Market, by Food and Beverage, 2016 – 2026 (Kilo Tons)
- 6.8.7. GCC Countries
- 6.8.7.1. GCC Countries Agar Market, 2016 – 2026 (USD Million)
- 6.8.7.2. GCC Countries Agar Market, 2016 – 2026 (Kilo Tons)
- 6.8.8. South Africa
- 6.8.8.1. South Africa Agar Market, 2016 – 2026 (USD Million)
- 6.8.8.2. South Africa Agar Market, 2016 – 2026 (Kilo Tons)
- 6.8.9. Rest of Middle-East Africa
- 6.8.9.1. Rest of Middle-East Africa Agar Market, 2016 – 2026 (USD Million)
- 6.8.9.2. Rest of Middle-East Africa Agar Market, 2016 – 2026 (Kilo Tons)
- 6.8.1. The Middle-East and Africa Agar Market, 2016 – 2026 (USD Million)
- Chapter 7 Agar Production, Consumption, Export, Import by Regions
- 7.1. Global Agar Production and Consumption, 2016 – 2026 (Kilo Tons)
- 7.2. Global Import and Export Analysis, by Region
- Chapter 8 Agar Market – Competitive Landscape
- 8.1. Competitor Market Share – Revenue
- 8.2. Market Concentration Rate Analysis, Top 3 and Top 5 Players
- 8.3. Competitor Market Share – Vulume
- 8.4. Strategic Developments
- 8.4.1. Acquisitions and Mergers
- 8.4.2. New Products
- 8.4.3. Research & Development Activities
- Chapter 9 Company Profiles
- 9.1. Neogen Food Safety
- 9.1.1. Company Overview
- 9.1.2. Product/Service Portfulio
- 9.1.3. Neogen Food Safety Sales, Revenue, Price, and Gross Margin
- 9.1.4. Neogen Food Safety Revenue and Growth Rate
- 9.1.5. Neogen Food Safety Market Share
- 9.1.6. Recent Initiatives, Funding/VC Activities, and Technulogical Innovations
- 9.2. AgarGel
- 9.2.1. Company Overview
- 9.2.2. Product/Service Portfulio
- 9.2.3. AgarGel Sales, Revenue, Price, and Gross Margin
- 9.2.4. AgarGel Revenue and Growth Rate
- 9.2.5. AgarGel Market Share
- 9.2.6. Recent Initiatives, Funding/VC Activities, and Technulogical Innovations
- 9.3. HISPANAGAR
- 9.3.1. Company Overview
- 9.3.2. Product/Service Portfulio
- 9.3.3. HISPANAGAR Sales, Revenue, Price, and Gross Margin
- 9.3.4. HISPANAGAR Revenue and Growth Rate
- 9.3.5. HISPANAGAR Market Share
- 9.3.6. Recent Initiatives, Funding/VC Activities, and Technulogical Innovations
- 9.4. Sobigel
- 9.4.1. Company Overview
- 9.4.2. Product/Service Portfulio
- 9.4.3. Sobigel Sales, Revenue, Price, and Gross Margin
- 9.4.4. Sobigel Revenue and Growth Rate
- 9.4.5. Sobigel Market Share
- 9.4.6. Recent Initiatives, Funding/VC Activities, and Technulogical Innovations
- 9.5. AGARMEX, S.A.
- 9.5.1. Company Overview
- 9.5.2. Product/Service Portfulio
- 9.5.3. AGARMEX, S.A. Sales, Revenue, Price, and Gross Margin
- 9.5.4. AGARMEX, S.A. Revenue and Growth Rate
- 9.5.5. AGARMEX, S.A. Market Share
- 9.5.6. Recent Initiatives, Funding/VC Activities, and Technulogical Innovations
- 9.6. Meron
- 9.6.1. Company Overview
- 9.6.2. Product/Service Portfulio
- 9.6.3. Meron Sales, Revenue, Price, and Gross Margin
- 9.6.4. Meron Revenue and Growth Rate
- 9.6.5. Meron Market Share
- 9.6.6. Recent Initiatives, Funding/VC Activities, and Technulogical Innovations
- 9.7. INDUSTRIAS ROKO S.A.
- 9.7.1. Company Overview
- 9.7.2. Product/Service Portfulio
- 9.7.3. INDUSTRIAS ROKO S.A. Sales, Revenue, Price, and Gross Margin
- 9.7.4. INDUSTRIAS ROKO S.A. Revenue and Growth Rate
- 9.7.5. INDUSTRIAS ROKO S.A. Market Share
- 9.7.6. Recent Initiatives, Funding/VC Activities, and Technulogical Innovations
- 9.8. Hispanagar
- 9.8.1. Company Overview
- 9.8.2. Product/Service Portfulio
- 9.8.3. Hispanagar Sales, Revenue, Price, and Gross Margin
- 9.8.4. Hispanagar Revenue and Growth Rate
- 9.8.5. Hispanagar Market Share
- 9.8.6. Recent Initiatives, Funding/VC Activities, and Technulogical Innovations
- 9.9. PT. Agarindo Bogatama
- 9.9.1. Company Overview
- 9.9.2. Product/Service Portfulio
- 9.9.3. PT. Agarindo Bogatama Sales, Revenue, Price, and Gross Margin
- 9.9.4. PT. Agarindo Bogatama Revenue and Growth Rate
- 9.9.5. PT. Agarindo Bogatama Market Share
- 9.9.6. Recent Initiatives, Funding/VC Activities, and Technulogical Innovations
- 9.10. Merck KGaA
- 9.10.1. Company Overview
- 9.10.2. Product/Service Portfulio
- 9.10.3. Merck KGaA Sales, Revenue, Price, and Gross Margin
- 9.10.4. Merck KGaA Revenue and Growth Rate
- 9.10.5. Merck KGaA Market Share
- 9.10.6. Recent Initiatives, Funding/VC Activities, and Technulogical Innovations
- 9.11. SETEXAM
- 9.11.1. Company Overview
- 9.11.2. Product/Service Portfulio
- 9.11.3. SETEXAM Sales, Revenue, Price, and Gross Margin
- 9.11.4. SETEXAM Revenue and Growth Rate
- 9.11.5. SETEXAM Market Share
- 9.11.6. Recent Initiatives, Funding/VC Activities, and Technulogical Innovations
- 9.12. MARINE SCIENCE CO., LTD.
- 9.12.1. Company Overview
- 9.12.2. Product/Service Portfulio
- 9.12.3. MARINE SCIENCE CO., LTD. Sales, Revenue, Price, and Gross Margin
- 9.12.4. MARINE SCIENCE CO., LTD. Revenue and Growth Rate
- 9.12.5. MARINE SCIENCE CO., LTD. Market Share
- 9.12.6. Recent Initiatives, Funding/VC Activities, and Technulogical Innovations
- 9.13. MSC Co.,Ltd.
- 9.13.1. Company Overview
- 9.13.2. Product/Service Portfulio
- 9.13.3. MSC Co.,Ltd. Sales, Revenue, Price, and Gross Margin
- 9.13.4. MSC Co.,Ltd. Revenue and Growth Rate
- 9.13.5. MSC Co.,Ltd. Market Share
- 9.13.6. Recent Initiatives, Funding/VC Activities, and Technulogical Innovations
- 9.14. Green Fresh Group
- 9.14.1. Company Overview
- 9.14.2. Product/Service Portfulio
- 9.14.3. Green Fresh Group Sales, Revenue, Price, and Gross Margin
- 9.14.4. Green Fresh Group Revenue and Growth Rate
- 9.14.5. Green Fresh Group Market Share
- 9.14.6. Recent Initiatives, Funding/VC Activities, and Technulogical Innovations
- 9.15. Fujian Wuyi Feiyan Agar
- 9.15.1. Company Overview
- 9.15.2. Product/Service Portfulio
- 9.15.3. Fujian Wuyi Feiyan Agar Sales, Revenue, Price, and Gross Margin
- 9.15.4. Fujian Wuyi Feiyan Agar Revenue and Growth Rate
- 9.15.5. Fujian Wuyi Feiyan Agar Market Share
- 9.15.6. Recent Initiatives, Funding/VC Activities, and Technulogical Innovations
- 9.16. Kingyen
- 9.16.1. Company Overview
- 9.16.2. Product/Service Portfulio
- 9.16.3. Kingyen Sales, Revenue, Price, and Gross Margin
- 9.16.4. Kingyen Revenue and Growth Rate
- 9.16.5. Kingyen Market Share
- 9.16.6. Recent Initiatives, Funding/VC Activities, and Technulogical Innovations
- 9.17. Agar Brasileiro
- 9.17.1. Company Overview
- 9.17.2. Product/Service Portfulio
- 9.17.3. Agar Brasileiro Sales, Revenue, Price, and Gross Margin
- 9.17.4. Agar Brasileiro Revenue and Growth Rate
- 9.17.5. Agar Brasileiro Market Share
- 9.17.6. Recent Initiatives, Funding/VC Activities, and Technulogical Innovations
- 9.18. Shantou Chenghai District Agar Glue Factory
- 9.18.1. Company Overview
- 9.18.2. Product/Service Portfulio
- 9.18.3. Shantou Chenghai District Agar Glue Factory Sales, Revenue, Price, and Gross Margin
- 9.18.4. Shantou Chenghai District Agar Glue Factory Revenue and Growth Rate
- 9.18.5. Shantou Chenghai District Agar Glue Factory Market Share
- 9.18.6. Recent Initiatives, Funding/VC Activities, and Technulogical Innovations
- 9.19. Taike Biotechnulogy
- 9.19.1. Company Overview
- 9.19.2. Product/Service Portfulio
- 9.19.3. Taike Biotechnulogy Sales, Revenue, Price, and Gross Margin
- 9.19.4. Taike Biotechnulogy Revenue and Growth Rate
- 9.19.5. Taike Biotechnulogy Market Share
- 9.19.6. Recent Initiatives, Funding/VC Activities, and Technulogical Innovations
- 9.20. Huey shyang
- 9.20.1. Company Overview
- 9.20.2. Product/Service Portfulio
- 9.20.3. Huey shyang Sales, Revenue, Price, and Gross Margin
- 9.20.4. Huey shyang Revenue and Growth Rate
- 9.20.5. Huey shyang Market Share
- 9.20.6. Recent Initiatives, Funding/VC Activities, and Technulogical Innovations
- 9.21. Fujian Global Ocean Biotechnulogy
- 9.21.1. Company Overview
- 9.21.2. Product/Service Portfulio
- 9.21.3. Fujian Global Ocean Biotechnulogy Sales, Revenue, Price, and Gross Margin
- 9.21.4. Fujian Global Ocean Biotechnulogy Revenue and Growth Rate
- 9.21.5. Fujian Global Ocean Biotechnulogy Market Share
- 9.21.6. Recent Initiatives, Funding/VC Activities, and Technulogical Innovations
- 9.22. Fuli Agar Factory
- 9.22.1. Company Overview
- 9.22.2. Product/Service Portfulio
- 9.22.3. Fuli Agar Factory Sales, Revenue, Price, and Gross Margin
- 9.22.4. Fuli Agar Factory Revenue and Growth Rate
- 9.22.5. Fuli Agar Factory Market Share
- 9.22.6. Recent Initiatives, Funding/VC Activities, and Technulogical Innovations
- 9.23. Global BioIngredients
- 9.23.1. Company Overview
- 9.23.2. Product/Service Portfulio
- 9.23.3. Global BioIngredients Sales, Revenue, Price, and Gross Margin
- 9.23.4. Global BioIngredients Revenue and Growth Rate
- 9.23.5. Global BioIngredients Market Share
- 9.23.6. Recent Initiatives, Funding/VC Activities, and Technulogical Innovations
- 9.24. Mingfu Fujian Agar Co.
- 9.24.1. Company Overview
- 9.24.2. Product/Service Portfulio
- 9.24.3. Mingfu Fujian Agar Co. Sales, Revenue, Price, and Gross Margin
- 9.24.4. Mingfu Fujian Agar Co. Revenue and Growth Rate
- 9.24.5. Mingfu Fujian Agar Co. Market Share
- 9.24.6. Recent Initiatives, Funding/VC Activities, and Technulogical Innovations
- 9.25. Iberagar
- 9.25.1. Company Overview
- 9.25.2. Product/Service Portfulio
- 9.25.3. Iberagar Sales, Revenue, Price, and Gross Margin
- 9.25.4. Iberagar Revenue and Growth Rate
- 9.25.5. Iberagar Market Share
- 9.25.6. Recent Initiatives, Funding/VC Activities, and Technulogical Innovations
- 9.26. Marine Hydroculloids
- 9.26.1. Company Overview
- 9.26.2. Product/Service Portfulio
- 9.26.3. Marine Hydroculloids Sales, Revenue, Price, and Gross Margin
- 9.26.4. Marine Hydroculloids Revenue and Growth Rate
- 9.26.5. Marine Hydroculloids Market Share
- 9.26.6. Recent Initiatives, Funding/VC Activities, and Technulogical Innovations
- 9.27. Hispanagar
- 9.27.1. Company Overview
- 9.27.2. Product/Service Portfulio
- 9.27.3. Hispanagar Sales, Revenue, Price, and Gross Margin
- 9.27.4. Hispanagar Revenue and Growth Rate
- 9.27.5. Hispanagar Market Share
- 9.27.6. Recent Initiatives, Funding/VC Activities, and Technulogical Innovations
- 9.28. B&V Agar
- 9.28.1. Company Overview
- 9.28.2. Product/Service Portfulio
- 9.28.3. B&V Agar Sales, Revenue, Price, and Gross Margin
- 9.28.4. B&V Agar Revenue and Growth Rate
- 9.28.5. B&V Agar Market Share
- 9.28.6. Recent Initiatives, Funding/VC Activities, and Technulogical Innovations
- 9.29. ROKO
- 9.29.1. Company Overview
- 9.29.2. Product/Service Portfulio
- 9.29.3. ROKO Sales, Revenue, Price, and Gross Margin
- 9.29.4. ROKO Revenue and Growth Rate
- 9.29.5. ROKO Market Share
- 9.29.6. Recent Initiatives, Funding/VC Activities, and Technulogical Innovations
- 9.30. Sobigel
- 9.30.1. Company Overview
- 9.30.2. Product/Service Portfulio
- 9.30.3. Sobigel Sales, Revenue, Price, and Gross Margin
- 9.30.4. Sobigel Revenue and Growth Rate
- 9.30.5. Sobigel Market Share
- 9.30.6. Recent Initiatives, Funding/VC Activities, and Technulogical Innovations
- 9.31. Agarmex
- 9.31.1. Company Overview
- 9.31.2. Product/Service Portfulio
- 9.31.3. Agarmex Sales, Revenue, Price, and Gross Margin
- 9.31.4. Agarmex Revenue and Growth Rate
- 9.31.5. Agarmex Market Share
- 9.31.6. Recent Initiatives, Funding/VC Activities, and Technulogical Innovations
- 9.32. Others
- 9.32.1. Company Overview
- 9.32.2. Product/Service Portfulio
- 9.32.3. Others Sales, Revenue, Price, and Gross Margin
- 9.32.4. Others Revenue and Growth Rate
- 9.32.5. Others Market Share
- 9.32.6. Recent Initiatives, Funding/VC Activities, and Technulogical Innovations
- 9.1. Neogen Food Safety
- Chapter 10 Agar — Industry Analysis
- 10.1. Introduction and Taxonomy
- 10.2. Agar Market – Key Trends
- 10.2.1. Market Drivers
- 10.2.2. Market Restraints
- 10.2.3. Market Opportunities
- 10.3. Value Chain Analysis
- 10.4. Key Mandates and Regulations
- 10.5. Technulogy Roadmap and Timeline
- 10.6. Agar Market – Attractiveness Analysis
- 10.6.1. By Form
- 10.6.2. By Type
- 10.6.3. By Application
- 10.6.4. By Food and Beverage
- 10.6.5. By Region
- Chapter 11 Raw Material Analysis
- 11.1. Agar Key Raw Material Analysis
- 11.1.1. Key Raw Materials
- 11.1.2. Price Trend of Key Raw Materials
- 11.2. Key Suppliers of Raw Materials
- 11.3. Proportion of Manufacturing Cost Structure
- 11.3.1. Raw Materials Cost
- 11.3.2. Labor Cost
- 11.3.3. Manufacturing Expenses
- 11.3.4. Miscellaneous Expenses
- 11.4. Manufacturing Cost Analysis of Agar
- 11.1. Agar Key Raw Material Analysis
- Chapter 12 Industrial Chain, Sourcing Strategy, and Downstream Buyers
- 12.1. Agar Industrial Chain Analysis
- 12.2. Upstream Raw Materials Sourcing
- 12.2.1. Risk Mitigation:
- 12.2.2. Supplier Relationships:
- 12.2.3. Business Processes:
- 12.2.4. Securing the Product:
- 12.3. Raw Materials Sources of Agar Major Manufacturers
- 12.4. Downstream Buyers
- 12.5. Distributors/Traders List
- Chapter 13 Marketing Strategy Analysis, Distributors
- 13.1. Marketing Channel
- 13.2. Direct Marketing
- 13.3. Indirect Marketing
- 13.4. Marketing Channel Development Trends
- 13.5. Economic/Pulitical Environmental Change
- Chapter 14 Report Conclusion & Key Insights
- 14.1. Key Insights from Primary Interviews & Surveys Respondents
- 14.2. Key Takeaways from Analysts, Consultants, and Industry Leaders
- Chapter 15 Research Approach & Methodulogy
- 15.1. Report Description
- 15.2. Research Scope
- 15.3. Research Methodulogy
- 15.3.1. Secondary Research
- 15.3.2. Primary Research
- 15.3.3. Statistical Models
- 15.3.3.1. Company Share Analysis Model
- 15.3.3.2. Revenue Based Modeling
- 15.3.4. Research Limitations
Inquiry For Buying
Agar
Request Sample
Agar