Aluminum Phosphide Fumigation Market Size, Share, and Trends Analysis Report
CAGR :

| Market Size 2024 (Base Year) | USD 1283.2 Million |
| Market Size 2032 (Forecast Year) | USD 2042.9 Million |
| CAGR | 5.4% |
| Forecast Period | 2025 - 2032 |
| Historical Period | 2020 - 2024 |
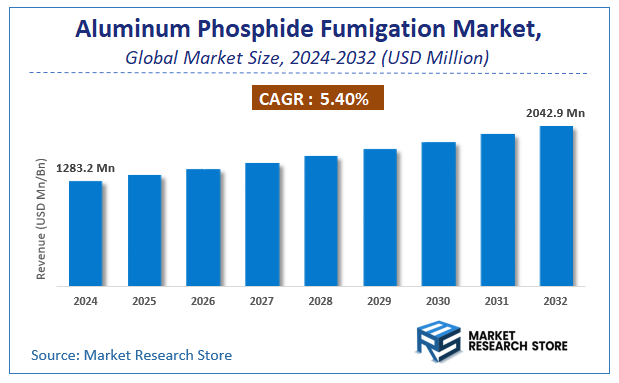
Market Research Store has published a report on the global aluminum phosphide fumigation market, estimating its value at USD 1283.2 Million in 2024, with projections indicating it will reach USD 2042.9 Million by the end of 2032. The market is expected to expand at a compound annual growth rate (CAGR) of around 5.4% over the forecast period. The report examines the factors driving market growth, the obstacles that could hinder this expansion, and the opportunities that may emerge in the aluminum phosphide fumigation industry. Additionally, it offers a detailed analysis of how these elements will affect demand dynamics and market performance throughout the forecast period.
Aluminum Phosphide Fumigation Market: Overview
The growth of the aluminum phosphide fumigation market is fueled by rising global demand across various industries and applications. The report highlights lucrative opportunities, analyzing cost structures, key segments, emerging trends, regional dynamics, and advancements by leading players to provide comprehensive market insights. The aluminum phosphide fumigation market report offers a detailed industry analysis from 2024 to 2032, combining quantitative and qualitative insights. It examines key factors such as pricing, market penetration, GDP impact, industry dynamics, major players, consumer behavior, and socio-economic conditions. Structured into multiple sections, the report provides a comprehensive perspective on the market from all angles.
Key sections of the aluminum phosphide fumigation market report include market segments, outlook, competitive landscape, and company profiles. Market Segments offer in-depth details based on Product Form, Application, Pest Type, End-User, and other relevant classifications to support strategic marketing initiatives. Market Outlook thoroughly analyzes market trends, growth drivers, restraints, opportunities, challenges, Porter’s Five Forces framework, macroeconomic factors, value chain analysis, and pricing trends shaping the market now and in the future. The Competitive Landscape and Company Profiles section highlights major players, their strategies, and market positioning to guide investment and business decisions. The report also identifies innovation trends, new business opportunities, and investment prospects for the forecast period.
Key Highlights:
- As per the analysis shared by our research analyst, the global aluminum phosphide fumigation market is estimated to grow annually at a CAGR of around 5.4% over the forecast period (2025-2032).
- In terms of revenue, the global aluminum phosphide fumigation market size was valued at around USD 1283.2 Million in 2024 and is projected to reach USD 2042.9 Million by 2032.
- The market is projected to grow at a significant rate due to increasing need to protect stored grains and agricultural commodities from pests, the rising demand for food security due to a growing global population, and the cost-effectiveness and efficiency of aluminum phosphide as a fumigant.
- Based on the Product Form, the Tablets segment is growing at a high rate and will continue to dominate the global market as per industry projections.
- On the basis of Application, the Agriculture segment is anticipated to command the largest market share.
- In terms of Pest Type, the Insects segment is projected to lead the global market.
- By End-User, the Farmers segment is predicted to dominate the global market.
- Based on region, Asia Pacific is projected to dominate the global market during the forecast period.
Aluminum Phosphide Fumigation Market: Report Scope
This report thoroughly analyzes the aluminum phosphide fumigation market, exploring its historical trends, current state, and future projections. The market estimates presented result from a robust research methodology, incorporating primary research, secondary sources, and expert opinions. These estimates are influenced by the prevailing market dynamics as well as key economic, social, and political factors. Furthermore, the report considers the impact of regulations, government expenditures, and advancements in research and development on the market. Both positive and negative shifts are evaluated to ensure a comprehensive and accurate market outlook.
| Report Attributes | Report Details |
|---|---|
| Report Name | Aluminum Phosphide Fumigation Market |
| Market Size in 2024 | USD 1283.2 Million |
| Market Forecast in 2032 | USD 2042.9 Million |
| Growth Rate | CAGR of 5.4% |
| Number of Pages | 214 |
| Key Companies Covered | UPL Limited, BASF SE, Nufarm Limited, Degesch America Inc., Detia Degesch GmbH, Royal Agro Organic Pvt. Ltd., Sandhya Group, Excel Crop Care Limited, Cytec Solvay Group, Nippon Chemical Industrial Co., Ltd., Kenvos Biotech Co., Ltd., Shenyang Harvest Agrochemical Co., Ltd., Shandong Shengpeng Technology Co., Ltd., Jiangsu Shuangling Chemical Group Co., Ltd., Shenzhen Chengjie Environmental Technology Co., Ltd., Anhui Shengli Pesticide & Chemicals Co., Ltd., Shandong Weifang Rainbow Chemical Co., Ltd., Zhejiang East Phosphorus Chemical Co., Ltd., Shandong Xingfa Chemical Group Co., Ltd., Shandong Luba Chemical Co., Ltd. |
| Segments Covered | By Product Form, By Application, By Pest Type, By End-User, and By Region |
| Regions Covered | North America, Europe, Asia Pacific (APAC), Latin America, Middle East, and Africa (MEA) |
| Base Year | 2024 |
| Historical Year | 2020 to 2024 |
| Forecast Year | 2025 to 2032 |
| Customization Scope | Avail customized purchase options to meet your exact research needs. Request For Customization |
Aluminum Phosphide Fumigation Market: Dynamics
Key Growth Drivers
The Aluminum Phosphide Fumigation market is primarily driven by the increasing global demand for effective and economical pest control solutions, especially in the agricultural sector to prevent post-harvest losses of stored grains, cereals, pulses, and other food commodities. The rising global population and the subsequent need for enhanced food security necessitate robust methods to protect food supplies from infestation by insects, mites, and rodents. Furthermore, the expansion of global trade and the strict phytosanitary regulations in international shipping and warehousing create a continuous demand for pre-shipment fumigation to ensure pest-free cargo. The ease of handling, storage, and accurate dosing offered by AlP in pellet and tablet forms also contributes to its widespread adoption.
Restraints
Despite its effectiveness, the Aluminum Phosphide Fumigation market faces significant restraints, largely due to its inherent toxicity and associated health risks. Phosphine gas is highly poisonous to humans and animals, requiring strict safety protocols, specialized training, and a Restricted Use Pesticide (RUP) classification in many regions, which limits its application to certified professionals. Concerns about the development of pest resistance due to continuous or improper use of phosphine also pose a long-term challenge to its efficacy. Furthermore, the growing demand for sustainable and eco-friendly pest control methods, alongside the development of alternative non-toxic fumigants and Integrated Pest Management (IPM) systems, presents competitive pressure, as these alternatives are often perceived as safer.
Opportunities
The Aluminum Phosphide Fumigation market presents opportunities stemming from continuous research and development into safer application techniques and formulations. Innovations such as controlled-release formulations and advanced delivery systems aim to minimize environmental impact and improve safety during application. The increasing adoption of AlP in urban pest control, including structural fumigations in residential and commercial buildings, beyond just agriculture, offers new avenues for growth. Furthermore, the global expansion of food storage infrastructure, particularly in developing regions like Asia-Pacific and Africa, creates a sustained demand for effective and cost-efficient fumigation solutions, positioning AlP as a vital tool for preventing widespread food spoilage and ensuring food safety.
Challenges
The Aluminum Phosphide Fumigation market grapples with several intricate challenges. A major hurdle is the stringent and evolving regulatory landscape globally, which often imposes strict guidelines on its handling, application, and residue limits, requiring constant compliance from manufacturers and applicators. Ensuring adequate sealing of fumigated structures to maintain effective gas concentrations and prevent leakage is critical yet can be challenging, especially in older or less-than-ideal storage facilities. The reliance on specific temperature and moisture conditions for optimal phosphine gas release also adds a layer of complexity to its application. Additionally, continuous education and rigorous training are essential for applicators to mitigate the high toxicity risks and ensure safe and effective use, which remains a perpetual challenge for the industry.
Aluminum Phosphide Fumigation Market: Segmentation Insights
The global aluminum phosphide fumigation market is segmented based on Product Form, Application, Pest Type, End-User, and Region. All the segments of the aluminum phosphide fumigation market have been analyzed based on present & future trends and the market is estimated from 2024 to 2032.
Based on Product Form, the global aluminum phosphide fumigation market is divided into Tablets, Pellets, Granules.
On the basis of Application, the global aluminum phosphide fumigation market is bifurcated into Agriculture, Warehouses, Food Processing, Others.
In terms of Pest Type, the global aluminum phosphide fumigation market is categorized into Insects, Rodents, Others.
Based on End-User, the global aluminum phosphide fumigation market is split into Farmers, Grain Storage Facilities, Food Processing Companies, Others.
Aluminum Phosphide Fumigation Market: Regional Insights
The aluminum phosphide fumigation market is currently dominated by the Asia-Pacific (APAC) region, which accounted for over 50% of global revenue in 2023, driven by large-scale agricultural production, stringent pest control regulations, and high demand for grain storage solutions in countries like India, China, and Australia. India leads the market due to its massive food storage infrastructure (e.g., FCI godowns) and widespread use of aluminum phosphide tablets for post-harvest pest management. North America follows as the second-largest market, with the U.S. focusing on phosphine gas generators for bulk grain terminals and regulatory approvals (EPA). Meanwhile, Africa is the fastest-growing region, propelled by Nigeria’s and South Africa’s investments in food security. APAC’s dominance is reinforced by cost-effective fumigation practices and government subsidies for pest control in public granaries.
Aluminum Phosphide Fumigation Market: Competitive Landscape
The aluminum phosphide fumigation market report offers a thorough analysis of both established and emerging players within the market. It includes a detailed list of key companies, categorized based on the types of products they offer and other relevant factors. The report also highlights the market entry year for each player, providing further context for the research analysis.
The "Global Aluminum Phosphide Fumigation Market" study offers valuable insights, focusing on the global market landscape, with an emphasis on major industry players such as;
- UPL Limited
- BASF SE
- Nufarm Limited
- Degesch America Inc.
- Detia Degesch GmbH
- Royal Agro Organic Pvt. Ltd.
- Sandhya Group
- Excel Crop Care Limited
- Cytec Solvay Group
- Nippon Chemical Industrial Co.
- Ltd.
- Kenvos Biotech Co.
- Ltd.
- Shenyang Harvest Agrochemical Co.
- Ltd.
- Shandong Shengpeng Technology Co.
- Ltd.
- Jiangsu Shuangling Chemical Group Co.
- Ltd.
- Shenzhen Chengjie Environmental Technology Co.
- Ltd.
- Anhui Shengli Pesticide & Chemicals Co.
- Ltd.
- Shandong Weifang Rainbow Chemical Co.
- Ltd.
- Zhejiang East Phosphorus Chemical Co.
- Ltd.
- Shandong Xingfa Chemical Group Co.
- Ltd.
- Shandong Luba Chemical Co.
- Ltd.
The Global Aluminum Phosphide Fumigation Market is Segmented as Follows:
By Product Form
- Tablets
- Pellets
- Granules
By Application
- Agriculture
- Warehouses
- Food Processing
- Others
By Pest Type
- Insects
- Rodents
- Others
By End-User
- Farmers
- Grain Storage Facilities
- Food Processing Companies
- Others
By Region
- North America
- The U.S.
- Canada
- Mexico
- Europe
- France
- The UK
- Spain
- Germany
- Italy
- Rest of Europe
- Asia Pacific
- China
- Japan
- India
- Australia
- South Korea
- Rest of Asia Pacific
- The Middle East & Africa
- Saudi Arabia
- UAE
- Egypt
- Kuwait
- South Africa
- Rest of the Middle East & Africa
- Latin America
- Brazil
- Argentina
- Rest of Latin America
Frequently Asked Questions
Table Of Content
List of Tables and Figures Figure Product Picture of Aluminum Phosphide Fumigation Table Product Specification of Aluminum Phosphide Fumigation Figure Market Concentration Ratio and Market Maturity Analysis of Aluminum Phosphide Fumigation Figure Global Aluminum Phosphide Fumigation Value ($) and Growth Rate from 2014-2024 Table Different Types of Aluminum Phosphide Fumigation Figure Global Aluminum Phosphide Fumigation Value ($) Segment by Type from 2014-2019 Figure Liquid Picture Figure Solid Picture Table Different Applications of Aluminum Phosphide Fumigation Figure Global Aluminum Phosphide Fumigation Value ($) Segment by Applications from 2014-2019 Figure Soil Picture Figure Warehouses Picture Table Research Regions of Aluminum Phosphide Fumigation Figure North America Aluminum Phosphide Fumigation Production Value ($) and Growth Rate (2014-2019) Figure Europe Aluminum Phosphide Fumigation Production Value ($) and Growth Rate (2014-2019) Table China Aluminum Phosphide Fumigation Production Value ($) and Growth Rate (2014-2019) Table Japan Aluminum Phosphide Fumigation Production Value ($) and Growth Rate (2014-2019) Table Middle East & Africa Aluminum Phosphide Fumigation Production Value ($) and Growth Rate (2014-2019) Table India Aluminum Phosphide Fumigation Production Value ($) and Growth Rate (2014-2019) Table South America Aluminum Phosphide Fumigation Production Value ($) and Growth Rate (2014-2019) Table Emerging Countries of Aluminum Phosphide Fumigation Table Growing Market of Aluminum Phosphide Fumigation Figure Industry Chain Analysis of Aluminum Phosphide Fumigation Table Upstream Raw Material Suppliers of Aluminum Phosphide Fumigation with Contact Information Table Major Players Manufacturing Base and Market Share ($) of Aluminum Phosphide Fumigation in 2018 Table Major Players Aluminum Phosphide Fumigation Product Types in 2018 Figure Production Process of Aluminum Phosphide Fumigation Figure Manufacturing Cost Structure of Aluminum Phosphide Fumigation Figure Channel Status of Aluminum Phosphide Fumigation Table Major Distributors of Aluminum Phosphide Fumigation with Contact Information Table Major Downstream Buyers of Aluminum Phosphide Fumigation with Contact Information Table Global Aluminum Phosphide Fumigation Value ($) by Type (2014-2019) Table Global Aluminum Phosphide Fumigation Value ($) Share by Type (2014-2019) Figure Global Aluminum Phosphide Fumigation Value ($) Share by Type (2014-2019) Table Global Aluminum Phosphide Fumigation Production by Type (2014-2019) Table Global Aluminum Phosphide Fumigation Production Share by Type (2014-2019) Figure Global Aluminum Phosphide Fumigation Production Share by Type (2014-2019) Figure Global Aluminum Phosphide Fumigation Value ($) and Growth Rate of Liquid Figure Global Aluminum Phosphide Fumigation Value ($) and Growth Rate of Solid Figure Global Aluminum Phosphide Fumigation Price by Type (2014-2019) Table Global Aluminum Phosphide Fumigation Consumption by Application (2014-2019) Table Global Aluminum Phosphide Fumigation Consumption Market Share by Application (2014-2019) Figure Global Aluminum Phosphide Fumigation Consumption Market Share by Application (2014-2019) Table Downstream Buyers Introduction by Application Figure Global Aluminum Phosphide Fumigation Consumption and Growth Rate of Soil (2014-2019) Figure Global Aluminum Phosphide Fumigation Consumption and Growth Rate of Warehouses (2014-2019) Table Global Aluminum Phosphide Fumigation Value ($) by Region (2014-2019) Table Global Aluminum Phosphide Fumigation Value ($) Market Share by Region (2014-2019) Figure Global Aluminum Phosphide Fumigation Value ($) Market Share by Region (2014-2019) Table Global Aluminum Phosphide Fumigation Production by Region (2014-2019) Table Global Aluminum Phosphide Fumigation Production Market Share by Region (2014-2019) Figure Global Aluminum Phosphide Fumigation Production Market Share by Region (2014-2019) Table Global Aluminum Phosphide Fumigation Production, Value ($), Price and Gross Margin (2014-2019) Table North America Aluminum Phosphide Fumigation Production, Value ($), Price and Gross Margin (2014-2019) Table Europe Aluminum Phosphide Fumigation Production, Value ($), Price and Gross Margin (2014-2019) Table China Aluminum Phosphide Fumigation Production, Value ($), Price and Gross Margin (2014-2019) Table Japan Aluminum Phosphide Fumigation Production, Value ($), Price and Gross Margin (2014-2019) Table Middle East & Africa Aluminum Phosphide Fumigation Production, Value ($), Price and Gross Margin (2014-2019) Table India Aluminum Phosphide Fumigation Production, Value ($), Price and Gross Margin (2014-2019) Table South America Aluminum Phosphide Fumigation Production, Value ($), Price and Gross Margin (2014-2019) Table Global Aluminum Phosphide Fumigation Consumption by Regions (2014-2019) Figure Global Aluminum Phosphide Fumigation Consumption Share by Regions (2014-2019) Table North America Aluminum Phosphide Fumigation Production, Consumption, Export, Import (2014-2019) Table Europe Aluminum Phosphide Fumigation Production, Consumption, Export, Import (2014-2019) Table China Aluminum Phosphide Fumigation Production, Consumption, Export, Import (2014-2019) Table Japan Aluminum Phosphide Fumigation Production, Consumption, Export, Import (2014-2019) Table Middle East & Africa Aluminum Phosphide Fumigation Production, Consumption, Export, Import (2014-2019) Table India Aluminum Phosphide Fumigation Production, Consumption, Export, Import (2014-2019) Table South America Aluminum Phosphide Fumigation Production, Consumption, Export, Import (2014-2019) Figure North America Aluminum Phosphide Fumigation Production and Growth Rate Analysis Figure North America Aluminum Phosphide Fumigation Consumption and Growth Rate Analysis Figure North America Aluminum Phosphide Fumigation SWOT Analysis Figure Europe Aluminum Phosphide Fumigation Production and Growth Rate Analysis Figure Europe Aluminum Phosphide Fumigation Consumption and Growth Rate Analysis Figure Europe Aluminum Phosphide Fumigation SWOT Analysis Figure China Aluminum Phosphide Fumigation Production and Growth Rate Analysis Figure China Aluminum Phosphide Fumigation Consumption and Growth Rate Analysis Figure China Aluminum Phosphide Fumigation SWOT Analysis Figure Japan Aluminum Phosphide Fumigation Production and Growth Rate Analysis Figure Japan Aluminum Phosphide Fumigation Consumption and Growth Rate Analysis Figure Japan Aluminum Phosphide Fumigation SWOT Analysis Figure Middle East & Africa Aluminum Phosphide Fumigation Production and Growth Rate Analysis Figure Middle East & Africa Aluminum Phosphide Fumigation Consumption and Growth Rate Analysis Figure Middle East & Africa Aluminum Phosphide Fumigation SWOT Analysis Figure India Aluminum Phosphide Fumigation Production and Growth Rate Analysis Figure India Aluminum Phosphide Fumigation Consumption and Growth Rate Analysis Figure India Aluminum Phosphide Fumigation SWOT Analysis Figure South America Aluminum Phosphide Fumigation Production and Growth Rate Analysis Figure South America Aluminum Phosphide Fumigation Consumption and Growth Rate Analysis Figure South America Aluminum Phosphide Fumigation SWOT Analysis Figure Top 3 Market Share of Aluminum Phosphide Fumigation Companies Figure Top 6 Market Share of Aluminum Phosphide Fumigation Companies Table Mergers, Acquisitions and Expansion Analysis Table Company Profiles Table Product Introduction Table Cytec Solvay Group Production, Value ($), Price, Gross Margin 2014-2019 Figure Cytec Solvay Group Production and Growth Rate Figure Cytec Solvay Group Value ($) Market Share 2014-2019 Figure Cytec Solvay Group Market Share of Aluminum Phosphide Fumigation Segmented by Region in 2018 Table Company Profiles Table Product Introduction Table BASF SE Production, Value ($), Price, Gross Margin 2014-2019 Figure BASF SE Production and Growth Rate Figure BASF SE Value ($) Market Share 2014-2019 Figure BASF SE Market Share of Aluminum Phosphide Fumigation Segmented by Region in 2018 Table Company Profiles Table Product Introduction Table Adama Agricultural Solutions Ltd. Production, Value ($), Price, Gross Margin 2014-2019 Figure Adama Agricultural Solutions Ltd. Production and Growth Rate Figure Adama Agricultural Solutions Ltd. Value ($) Market Share 2014-2019 Figure Adama Agricultural Solutions Ltd. Market Share of Aluminum Phosphide Fumigation Segmented by Region in 2018 Table Company Profiles Table Product Introduction Table United Phosphorus Ltd. Production, Value ($), Price, Gross Margin 2014-2019 Figure United Phosphorus Ltd. Production and Growth Rate Figure United Phosphorus Ltd. Value ($) Market Share 2014-2019 Figure United Phosphorus Ltd. Market Share of Aluminum Phosphide Fumigation Segmented by Region in 2018 Table Company Profiles Table Product Introduction Table Rentokil Initial Plc Production, Value ($), Price, Gross Margin 2014-2019 Figure Rentokil Initial Plc Production and Growth Rate Figure Rentokil Initial Plc Value ($) Market Share 2014-2019 Figure Rentokil Initial Plc Market Share of Aluminum Phosphide Fumigation Segmented by Region in 2018 Table Global Aluminum Phosphide Fumigation Market Value ($) Forecast, by Type Table Global Aluminum Phosphide Fumigation Market Volume Forecast, by Type Figure Global Aluminum Phosphide Fumigation Market Value ($) and Growth Rate Forecast of Liquid (2019-2024) Figure Global Aluminum Phosphide Fumigation Market Volume and Growth Rate Forecast of Liquid (2019-2024) Figure Global Aluminum Phosphide Fumigation Market Value ($) and Growth Rate Forecast of Solid (2019-2024) Figure Global Aluminum Phosphide Fumigation Market Volume and Growth Rate Forecast of Solid (2019-2024) Table Global Market Value ($) Forecast by Application (2019-2024) Table Global Market Volume Forecast by Application (2019-2024) Figure Global Aluminum Phosphide Fumigation Consumption and Growth Rate of Soil (2014-2019) Figure Global Aluminum Phosphide Fumigation Consumption and Growth Rate of Warehouses (2014-2019) Figure Market Value ($) and Growth Rate Forecast of Warehouses (2019-2024) Figure Market Volume and Growth Rate Forecast of Warehouses (2019-2024) Figure North America Market Value ($) and Growth Rate Forecast (2019-2024) Table North America Consumption and Growth Rate Forecast (2019-2024) Figure Europe Market Value ($) and Growth Rate Forecast (2019-2024) Table Europe Consumption and Growth Rate Forecast (2019-2024) Figure China Market Value ($) and Growth Rate Forecast (2019-2024) Table China Consumption and Growth Rate Forecast (2019-2024) Figure Japan Market Value ($) and Growth Rate Forecast (2019-2024) Table Japan Consumption and Growth Rate Forecast (2019-2024) Figure Middle East & Africa Market Value ($) and Growth Rate Forecast (2019-2024) Table Middle East & Africa Consumption and Growth Rate Forecast (2019-2024) Figure India Market Value ($) and Growth Rate Forecast (2019-2024) Table India Consumption and Growth Rate Forecast (2019-2024) Figure South America Market Value ($) and Growth Rate Forecast (2019-2024) Table South America Consumption and Growth Rate Forecast (2019-2024) Figure Industry Resource/Technology/Labor Importance Analysis Table New Entrants SWOT Analysis Table New Project Analysis of Investment Recovery
Inquiry For Buying
Aluminum Phosphide Fumigation
Request Sample
Aluminum Phosphide Fumigation