Automotive Navigation Solutions Market Size, Share, and Trends Analysis Report
CAGR :

| Market Size 2023 (Base Year) | USD 34.82 Billion |
| Market Size 2032 (Forecast Year) | USD 66.76 Billion |
| CAGR | 7.5% |
| Forecast Period | 2024 - 2032 |
| Historical Period | 2018 - 2023 |
Automotive Navigation Solutions Market Insights
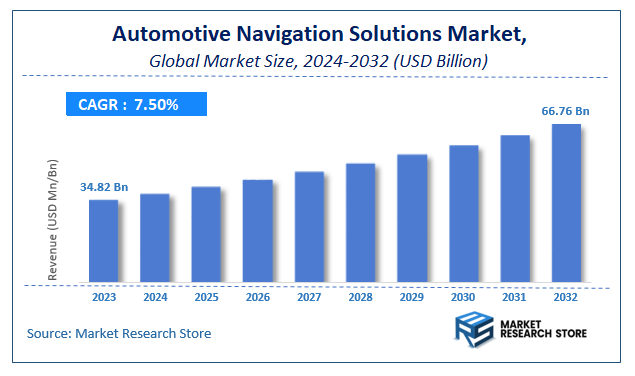
As per the published report by Market Research Store, the Global Automotive Navigation Solutions Market size was estimated at USD 34.82 Billion in 2023 and is anticipated to reach reach USD 66.76 Billion by 2032, growing at a projected CAGR of 7.5% during the forecast period 2024-2032. The report provides a detailed analysis of the global Automotive Navigation Solutions Market, including market trends, market dynamics, and market opportunities during the forecast period (2024-2032). It delves deeper into several market facets, such as market definition, size, growth, forecast, segmentation, competitive analysis, growth drivers, restraints, financial analysis, SWOT analysis, PORTER’s five force analysis, PESTEL analysis, market share analysis, cost-benefit analysis, challenges, restraints, strategic recommendations, and market players.
Automotive Navigation Solutions Market: Overview
The growth of the automotive navigation solutions market is fueled by rising global demand across various industries and applications. The report highlights lucrative opportunities, analyzing cost structures, key segments, emerging trends, regional dynamics, and advancements by leading players to provide comprehensive market insights. The automotive navigation solutions market report offers a detailed industry analysis from 2024 to 2032, combining quantitative and qualitative insights. It examines key factors such as pricing, market penetration, GDP impact, industry dynamics, major players, consumer behavior, and socio-economic conditions. Structured into multiple sections, the report provides a comprehensive perspective on the market from all angles.
Key sections of the automotive navigation solutions market report include market segments, outlook, competitive landscape, and company profiles. Market Segments offer in-depth details based on Component, Vehicle Type, Technology, Application, and other relevant classifications to support strategic marketing initiatives. Market Outlook thoroughly analyzes market trends, growth drivers, restraints, opportunities, challenges, Porter’s Five Forces framework, macroeconomic factors, value chain analysis, and pricing trends shaping the market now and in the future. The Competitive Landscape and Company Profiles section highlights major players, their strategies, and market positioning to guide investment and business decisions. The report also identifies innovation trends, new business opportunities, and investment prospects for the forecast period.
Key Highlights:
- As per the analysis shared by our research analyst, the global automotive navigation solutions market is estimated to grow annually at a CAGR of around 7.5% over the forecast period (2024-2032).
- In terms of revenue, the global automotive navigation solutions market size was valued at around USD 34.82 Billion in 2023 and is projected to reach USD 66.76 Billion by 2032.
- The market is projected to grow at a significant rate due to increasing vehicle connectivity, real-time traffic updates, and smart mobility solutions.
- Based on the Component, the Hardware segment is growing at a high rate and will continue to dominate the global market as per industry projections.
- On the basis of Vehicle Type, the Passenger Cars segment is anticipated to command the largest market share.
- In terms of Technology, the GPS segment is projected to lead the global market.
- By Application, the OEMs segment is predicted to dominate the global market.
- Based on region, Europe is projected to dominate the global market during the forecast period.
Automotive Navigation Solutions Market: Report Scope
This report thoroughly analyzes the automotive navigation solutions market, exploring its historical trends, current state, and future projections. The market estimates presented result from a robust research methodology, incorporating primary research, secondary sources, and expert opinions. These estimates are influenced by the prevailing market dynamics as well as key economic, social, and political factors. Furthermore, the report considers the impact of regulations, government expenditures, and advancements in research and development on the market. Both positive and negative shifts are evaluated to ensure a comprehensive and accurate market outlook.
| Report Attributes | Report Details |
|---|---|
| Report Name | Automotive Navigation Solutions Market |
| Market Size in 2023 | USD 34.82 Billion |
| Market Forecast in 2032 | USD 66.76 Billion |
| Growth Rate | CAGR of 7.5% |
| Number of Pages | 178 |
| Key Companies Covered | DASAN Network Solutions, Ruetz system solutions gmbh, Vector Informatik GmbH, Microchip Technology Inc., B&R Automation, Broadcom Limited, Bosch Rexroth |
| Segments Covered | By Component, By Vehicle Type, By Technology, By Application, and By Region |
| Regions Covered | North America, Europe, Asia Pacific (APAC), Latin America, Middle East, and Africa (MEA) |
| Base Year | 2023 |
| Historical Year | 2018 to 2023 |
| Forecast Year | 2024 to 2032 |
| Customization Scope | Avail customized purchase options to meet your exact research needs. Request For Customization |
Automotive Navigation Solutions Market: Dynamics
Key Growth Drivers
The Automotive Navigation Solutions market in India is experiencing significant growth driven by the increasing vehicle ownership across all segments and a growing awareness among drivers about the convenience and safety benefits of navigation systems. The rising penetration of smartphones and affordable data plans has facilitated the widespread use of map applications, creating familiarity and demand for in-car navigation. Furthermore, the integration of navigation systems into vehicle infotainment units by Original Equipment Manufacturers (OEMs) as a standard or optional feature is a major driver. The increasing demand for connected car features, where navigation plays a crucial role in providing real-time traffic updates, route optimization, and points of interest, is also fueling market expansion. Government initiatives focusing on intelligent transportation systems and road safety further support the adoption of navigation technologies.
Restraints
Despite the strong growth drivers, the Automotive Navigation Solutions market in India faces certain restraints. The widespread availability and increasing accuracy of free smartphone-based navigation apps pose a significant challenge to the adoption of paid or embedded automotive navigation systems. Concerns about the cost of embedded navigation systems as an optional feature can deter price-sensitive consumers, especially in entry-level and mid-range vehicles. Furthermore, inconsistent or limited internet connectivity in certain rural or remote areas can impact the real-time functionality of connected navigation systems. The user interface and ease of use of some embedded systems can be less intuitive compared to familiar smartphone apps. Privacy concerns related to location tracking and data collection by navigation systems can also create hesitancy among some users.
Opportunities
The Automotive Navigation Solutions market in India presents numerous opportunities for innovation and growth. The increasing focus on advanced driver-assistance systems (ADAS) and autonomous driving features will necessitate highly accurate and reliable navigation data. The integration of real-time traffic information, predictive routing, and dynamic rerouting capabilities can enhance the value proposition of automotive navigation. Furthermore, the development of augmented reality (AR) based navigation projected onto the windshield can offer a more intuitive and safer driving experience. The potential for monetizing navigation platforms through location-based services, points of interest information, and targeted advertising exists. The growing adoption of electric vehicles (EVs) creates opportunities for navigation systems that provide optimized routing based on charging infrastructure and range.
Challenges
The Automotive Navigation Solutions market in India faces challenges related to competing with free and widely used smartphone-based navigation apps. Ensuring accurate and up-to-date map data that covers the vast and rapidly changing road network in India is a significant logistical undertaking. Furthermore, integrating navigation systems seamlessly with the vehicle's other electronic systems and ensuring a consistent user experience across different platforms can be complex. Addressing the issue of intermittent internet connectivity and providing reliable offline navigation capabilities is crucial for wider usability. Balancing the cost of embedded systems with the perceived value by consumers remains a key challenge for OEMs. Finally, navigating the diverse linguistic landscape and providing voice guidance and interface options in multiple Indian languages is essential for market penetration.
Automotive Navigation Solutions Market: Segmentation Insights
The global automotive navigation solutions market is segmented based on Component, Vehicle Type, Technology, Application, and Region. All the segments of the automotive navigation solutions market have been analyzed based on present & future trends and the market is estimated from 2024 to 2032.
Based on Component, the global automotive navigation solutions market is divided into Hardware, Software, Services.
On the basis of Vehicle Type, the global automotive navigation solutions market is bifurcated into Passenger Cars, Commercial Vehicles.
In terms of Technology, the global automotive navigation solutions market is categorized into GPS, GNSS, Others.
Based on Application, the global automotive navigation solutions market is split into OEMs, Aftermarket.
Automotive Navigation Solutions Market: Regional Insights
The Asia-Pacific (APAC) region, led by Japan, China, and South Korea, dominates the global automotive navigation solutions market, capturing over 48% of market share in 2024. This leadership is driven by the region's strong automotive electronics industry, high penetration of connected vehicles, and innovation in real-time navigation, AI-powered routing, and integrated infotainment systems. Japan, home to industry leaders like Pioneer, Alpine, and Mitsubishi Electric, excels in precision navigation hardware, while China's Baidu Auto and AutoNavi dominate software with 5G-enabled V2X (vehicle-to-everything) solutions.
North America, particularly the U.S., follows as the second-largest market, fueled by demand for over-the-air (OTA) updates and EV-specific navigation in brands like Tesla and GM's Super Cruise. Europe shows steady growth, with Germany leading in premium OEM systems (e.g., BMW, Mercedes-Benz). APAC's dominance is reinforced by government mandates for smart transportation infrastructure, rising EV adoption (China accounts for 60% of global EV sales), and localized map data ecosystems.
Automotive Navigation Solutions Market: Competitive Landscape
The automotive navigation solutions market report offers a thorough analysis of both established and emerging players within the market. It includes a detailed list of key companies, categorized based on the types of products they offer and other relevant factors. The report also highlights the market entry year for each player, providing further context for the research analysis.
The "Global Automotive Navigation Solutions Market" study offers valuable insights, focusing on the global market landscape, with an emphasis on major industry players such as;
- DASAN Network Solutions
- Ruetz system solutions gmbh
- Vector Informatik GmbH
- Microchip Technology Inc.
- B&R Automation
- Broadcom Limited
- Bosch Rexroth
The Global Automotive Navigation Solutions Market is Segmented as Follows:
By Component
- Hardware
- Software
- Services
By Vehicle Type
- Passenger Cars
- Commercial Vehicles
By Technology
- GPS
- GNSS
- Others
By Application
- OEMs
- Aftermarket
By Region
- North America
- The U.S.
- Canada
- Mexico
- Europe
- France
- The UK
- Spain
- Germany
- Italy
- Rest of Europe
- Asia Pacific
- China
- Japan
- India
- Australia
- South Korea
- Rest of Asia Pacific
- The Middle East & Africa
- Saudi Arabia
- UAE
- Egypt
- Kuwait
- South Africa
- Rest of the Middle East & Africa
- Latin America
- Brazil
- Argentina
- Rest of Latin America
Market Evolution
This section evaluates the market position of the product or service by examining its development pathway and competitive dynamics. It provides a detailed overview of the product's growth stages, including the early (historical) phase, the mid-stage, and anticipated future advancements influenced by innovation and emerging technologies.
Porter’s Analysis
Porter’s Five Forces framework offers a strategic lens for assessing competitor behavior and the positioning of key players in the automotive navigation solutions industry. This section explores the external factors shaping competitive dynamics and influencing market strategies in the years ahead. The analysis focuses on five critical forces:
- Competitive Rivalry
- Threat of New Entrants
- Threat of Substitutes
- Supplier Bargaining Power
- Buyer Bargaining Power
Value Chain & Market Attractiveness Analysis
The value chain analysis helps businesses optimize operations by mapping the product flow from suppliers to end consumers, identifying opportunities to streamline processes and gain a competitive edge. Segment-wise market attractiveness analysis evaluates key dimensions like product categories, demographics, and regions, assessing growth potential, market size, and profitability. This enables businesses to focus resources on high-potential segments for better ROI and long-term value.
PESTEL Analysis
PESTEL analysis is a powerful tool in market research reports that enhances market understanding by systematically examining the external macro-environmental factors influencing a business or industry. The acronym stands for Political, Economic, Social, Technological, Environmental, and Legal factors. By evaluating these dimensions, PESTEL analysis provides a comprehensive overview of the broader context within which a market operates, helping businesses identify potential opportunities and threats.
- Political factors assess government policies, stability, trade regulations, and political risks that could impact market operations.
- Economic factors examine variables like inflation, exchange rates, economic growth, and consumer spending power to determine market viability.
- Social factors explore cultural trends, demographics, and lifestyle changes that shape consumer behavior and preferences.
- Technological factors evaluate innovation, R&D, and technological advancements affecting product development and operational efficiencies.
- Environmental factors focus on sustainability, climate change impacts, and eco-friendly practices shaping market trends.
- Legal factors address compliance requirements, industry regulations, and intellectual property laws impacting market entry and operations.
Import-Export Analysis & Pricing Analysis
An import-export analysis is vital for market research, revealing global trade dynamics, trends, and opportunities. It examines trade volumes, product categories, and regional competitiveness, offering insights into supply chains and market demand. This section also analyzes past and future pricing trends, helping businesses optimize strategies and enabling consumers to assess product value effectively.
Automotive Navigation Solutions Market: Company Profiles
The report identifies key players in the automotive navigation solutions market through a competitive landscape and company profiles, evaluating their offerings, financial performance, strategies, and market positioning. It includes a SWOT analysis of the top 3-5 companies, assessing strengths, weaknesses, opportunities, and threats. The competitive landscape highlights rankings, recent activities (mergers, acquisitions, partnerships, product launches), and regional footprints using the Ace matrix. Customization is available to meet client-specific needs.
Regional & Industry Footprint
This section details the geographic reach, sales networks, and market penetration of companies profiled in the automotive navigation solutions report, showcasing their operations and distribution across regions. It analyzes the alignment of companies with specific industry verticals, highlighting the industries they serve and the scope of their products and services within those sectors.
Ace Matrix
This section categorizes companies into four distinct groups—Active, Cutting Edge, Innovator, and Emerging—based on their product and business strategies. The evaluation of product strategy focuses on aspects such as the range and depth of offerings, commitment to innovation, product functionalities, and scalability. Key elements like global reach, sector coverage, strategic acquisitions, and long-term growth plans are considered for business strategy. This analysis provides a detailed view of companies' position within the market and highlights their potential for future growth and development.
Research Methodology
The qualitative and quantitative insights for the automotive navigation solutions market are derived through a multi-faceted research approach, combining input from subject matter experts, primary research, and secondary data sources. Primary research includes gathering critical information via face-to-face or telephonic interviews, surveys, questionnaires, and feedback from industry professionals, key opinion leaders (KOLs), and customers. Regular interviews with industry experts are conducted to deepen the analysis and reinforce the existing data, ensuring a robust and well-rounded market understanding.
Secondary research for this report was carried out by the Market Research Store team, drawing on a variety of authoritative sources, such as:
- Official company websites, annual reports, financial statements, investor presentations, and SEC filings
- Internal and external proprietary databases, as well as relevant patent and regulatory databases
- Government publications, national statistical databases, and industry-specific market reports
- Media coverage, including news articles, press releases, and webcasts about market participants
- Paid industry databases for detailed market insights
Market Research Store conducted in-depth consultations with various key opinion leaders in the industry, including senior executives from top companies and regional leaders from end-user organizations. This effort aimed to gather critical insights on factors such as the market share of dominant brands in specific countries and regions, along with pricing strategies for products and services.
To determine total sales data, the research team conducted primary interviews across multiple countries with influential stakeholders, including:
- Distributors
- Marketing, Brand, and Product Managers
- Procurement and Production Managers
- Sales and Regional Sales Managers, Country Managers
- Technical Specialists
- C-Level Executives
These subject matter experts, with their extensive industry experience, helped validate and refine the findings. For secondary research, data were sourced from a wide range of materials, including online resources, company annual reports, industry publications, research papers, association reports, and government websites. These various sources provide a comprehensive and well-rounded perspective on the market.
Frequently Asked Questions
Who are the leading players functioning in the global automotive navigation solutions market growth?
Table Of Content
List of Tables and Figures Figure Product Picture of Automotive Navigation Solutions Table Product Specification of Automotive Navigation Solutions Figure Market Concentration Ratio and Market Maturity Analysis of Automotive Navigation Solutions Figure Global Automotive Navigation Solutions Value ($) and Growth Rate from 2014-2024 Table Different Types of Automotive Navigation Solutions Figure Global Automotive Navigation Solutions Value ($) Segment by Type from 2014-2019 Figure One pair Ethernet –OPEN, Picture Figure Energy efficient Ethernet, Picture Figure Power over Ethernet-PoW Picture Figure Gigabit Ethernet –GIG-E Picture Table Different Applications of Automotive Navigation Solutions Figure Global Automotive Navigation Solutions Value ($) Segment by Applications from 2014-2019 Figure Passenger car Picture Figure Light commercial vehicle Picture Figure Heavy commercial vehicle Picture Table Research Regions of Automotive Navigation Solutions Figure North America Automotive Navigation Solutions Production Value ($) and Growth Rate (2014-2019) Figure Europe Automotive Navigation Solutions Production Value ($) and Growth Rate (2014-2019) Table China Automotive Navigation Solutions Production Value ($) and Growth Rate (2014-2019) Table Japan Automotive Navigation Solutions Production Value ($) and Growth Rate (2014-2019) Table Middle East & Africa Automotive Navigation Solutions Production Value ($) and Growth Rate (2014-2019) Table India Automotive Navigation Solutions Production Value ($) and Growth Rate (2014-2019) Table South America Automotive Navigation Solutions Production Value ($) and Growth Rate (2014-2019) Table Emerging Countries of Automotive Navigation Solutions Table Growing Market of Automotive Navigation Solutions Figure Industry Chain Analysis of Automotive Navigation Solutions Table Upstream Raw Material Suppliers of Automotive Navigation Solutions with Contact Information Table Major Players Manufacturing Base and Market Share ($) of Automotive Navigation Solutions in 2018 Table Major Players Automotive Navigation Solutions Product Types in 2018 Figure Production Process of Automotive Navigation Solutions Figure Manufacturing Cost Structure of Automotive Navigation Solutions Figure Channel Status of Automotive Navigation Solutions Table Major Distributors of Automotive Navigation Solutions with Contact Information Table Major Downstream Buyers of Automotive Navigation Solutions with Contact Information Table Global Automotive Navigation Solutions Value ($) by Type (2014-2019) Table Global Automotive Navigation Solutions Value ($) Share by Type (2014-2019) Figure Global Automotive Navigation Solutions Value ($) Share by Type (2014-2019) Table Global Automotive Navigation Solutions Production by Type (2014-2019) Table Global Automotive Navigation Solutions Production Share by Type (2014-2019) Figure Global Automotive Navigation Solutions Production Share by Type (2014-2019) Figure Global Automotive Navigation Solutions Value ($) and Growth Rate of One pair Ethernet –OPEN, Figure Global Automotive Navigation Solutions Value ($) and Growth Rate of Energy efficient Ethernet, Figure Global Automotive Navigation Solutions Value ($) and Growth Rate of Power over Ethernet-PoW Figure Global Automotive Navigation Solutions Value ($) and Growth Rate of Gigabit Ethernet –GIG-E Figure Global Automotive Navigation Solutions Price by Type (2014-2019) Table Global Automotive Navigation Solutions Consumption by Application (2014-2019) Table Global Automotive Navigation Solutions Consumption Market Share by Application (2014-2019) Figure Global Automotive Navigation Solutions Consumption Market Share by Application (2014-2019) Table Downstream Buyers Introduction by Application Figure Global Automotive Navigation Solutions Consumption and Growth Rate of Passenger car (2014-2019) Figure Global Automotive Navigation Solutions Consumption and Growth Rate of Light commercial vehicle (2014-2019) Figure Global Automotive Navigation Solutions Consumption and Growth Rate of Heavy commercial vehicle (2014-2019) Table Global Automotive Navigation Solutions Value ($) by Region (2014-2019) Table Global Automotive Navigation Solutions Value ($) Market Share by Region (2014-2019) Figure Global Automotive Navigation Solutions Value ($) Market Share by Region (2014-2019) Table Global Automotive Navigation Solutions Production by Region (2014-2019) Table Global Automotive Navigation Solutions Production Market Share by Region (2014-2019) Figure Global Automotive Navigation Solutions Production Market Share by Region (2014-2019) Table Global Automotive Navigation Solutions Production, Value ($), Price and Gross Margin (2014-2019) Table North America Automotive Navigation Solutions Production, Value ($), Price and Gross Margin (2014-2019) Table Europe Automotive Navigation Solutions Production, Value ($), Price and Gross Margin (2014-2019) Table China Automotive Navigation Solutions Production, Value ($), Price and Gross Margin (2014-2019) Table Japan Automotive Navigation Solutions Production, Value ($), Price and Gross Margin (2014-2019) Table Middle East & Africa Automotive Navigation Solutions Production, Value ($), Price and Gross Margin (2014-2019) Table India Automotive Navigation Solutions Production, Value ($), Price and Gross Margin (2014-2019) Table South America Automotive Navigation Solutions Production, Value ($), Price and Gross Margin (2014-2019) Table Global Automotive Navigation Solutions Consumption by Regions (2014-2019) Figure Global Automotive Navigation Solutions Consumption Share by Regions (2014-2019) Table North America Automotive Navigation Solutions Production, Consumption, Export, Import (2014-2019) Table Europe Automotive Navigation Solutions Production, Consumption, Export, Import (2014-2019) Table China Automotive Navigation Solutions Production, Consumption, Export, Import (2014-2019) Table Japan Automotive Navigation Solutions Production, Consumption, Export, Import (2014-2019) Table Middle East & Africa Automotive Navigation Solutions Production, Consumption, Export, Import (2014-2019) Table India Automotive Navigation Solutions Production, Consumption, Export, Import (2014-2019) Table South America Automotive Navigation Solutions Production, Consumption, Export, Import (2014-2019) Figure North America Automotive Navigation Solutions Production and Growth Rate Analysis Figure North America Automotive Navigation Solutions Consumption and Growth Rate Analysis Figure North America Automotive Navigation Solutions SWOT Analysis Figure Europe Automotive Navigation Solutions Production and Growth Rate Analysis Figure Europe Automotive Navigation Solutions Consumption and Growth Rate Analysis Figure Europe Automotive Navigation Solutions SWOT Analysis Figure China Automotive Navigation Solutions Production and Growth Rate Analysis Figure China Automotive Navigation Solutions Consumption and Growth Rate Analysis Figure China Automotive Navigation Solutions SWOT Analysis Figure Japan Automotive Navigation Solutions Production and Growth Rate Analysis Figure Japan Automotive Navigation Solutions Consumption and Growth Rate Analysis Figure Japan Automotive Navigation Solutions SWOT Analysis Figure Middle East & Africa Automotive Navigation Solutions Production and Growth Rate Analysis Figure Middle East & Africa Automotive Navigation Solutions Consumption and Growth Rate Analysis Figure Middle East & Africa Automotive Navigation Solutions SWOT Analysis Figure India Automotive Navigation Solutions Production and Growth Rate Analysis Figure India Automotive Navigation Solutions Consumption and Growth Rate Analysis Figure India Automotive Navigation Solutions SWOT Analysis Figure South America Automotive Navigation Solutions Production and Growth Rate Analysis Figure South America Automotive Navigation Solutions Consumption and Growth Rate Analysis Figure South America Automotive Navigation Solutions SWOT Analysis Figure Top 3 Market Share of Automotive Navigation Solutions Companies Figure Top 6 Market Share of Automotive Navigation Solutions Companies Table Mergers, Acquisitions and Expansion Analysis Table Company Profiles Table Product Introduction Table DASAN Network Solutions Production, Value ($), Price, Gross Margin 2014-2019 Figure DASAN Network Solutions Production and Growth Rate Figure DASAN Network Solutions Value ($) Market Share 2014-2019 Figure DASAN Network Solutions Market Share of Automotive Navigation Solutions Segmented by Region in 2018 Table Company Profiles Table Product Introduction Table Ruetz system solutions gmbh Production, Value ($), Price, Gross Margin 2014-2019 Figure Ruetz system solutions gmbh Production and Growth Rate Figure Ruetz system solutions gmbh Value ($) Market Share 2014-2019 Figure Ruetz system solutions gmbh Market Share of Automotive Navigation Solutions Segmented by Region in 2018 Table Company Profiles Table Product Introduction Table Vector Informatik GmbH Production, Value ($), Price, Gross Margin 2014-2019 Figure Vector Informatik GmbH Production and Growth Rate Figure Vector Informatik GmbH Value ($) Market Share 2014-2019 Figure Vector Informatik GmbH Market Share of Automotive Navigation Solutions Segmented by Region in 2018 Table Company Profiles Table Product Introduction Table Microchip Technology Inc. Production, Value ($), Price, Gross Margin 2014-2019 Figure Microchip Technology Inc. Production and Growth Rate Figure Microchip Technology Inc. Value ($) Market Share 2014-2019 Figure Microchip Technology Inc. Market Share of Automotive Navigation Solutions Segmented by Region in 2018 Table Company Profiles Table Product Introduction Table B&R Automation Production, Value ($), Price, Gross Margin 2014-2019 Figure B&R Automation Production and Growth Rate Figure B&R Automation Value ($) Market Share 2014-2019 Figure B&R Automation Market Share of Automotive Navigation Solutions Segmented by Region in 2018 Table Company Profiles Table Product Introduction Table Broadcom Limited Production, Value ($), Price, Gross Margin 2014-2019 Figure Broadcom Limited Production and Growth Rate Figure Broadcom Limited Value ($) Market Share 2014-2019 Figure Broadcom Limited Market Share of Automotive Navigation Solutions Segmented by Region in 2018 Table Company Profiles Table Product Introduction Table Bosch Rexroth Production, Value ($), Price, Gross Margin 2014-2019 Figure Bosch Rexroth Production and Growth Rate Figure Bosch Rexroth Value ($) Market Share 2014-2019 Figure Bosch Rexroth Market Share of Automotive Navigation Solutions Segmented by Region in 2018 Table Global Automotive Navigation Solutions Market Value ($) Forecast, by Type Table Global Automotive Navigation Solutions Market Volume Forecast, by Type Figure Global Automotive Navigation Solutions Market Value ($) and Growth Rate Forecast of One pair Ethernet –OPEN, (2019-2024) Figure Global Automotive Navigation Solutions Market Volume and Growth Rate Forecast of One pair Ethernet –OPEN, (2019-2024) Figure Global Automotive Navigation Solutions Market Value ($) and Growth Rate Forecast of Energy efficient Ethernet, (2019-2024) Figure Global Automotive Navigation Solutions Market Volume and Growth Rate Forecast of Energy efficient Ethernet, (2019-2024) Figure Global Automotive Navigation Solutions Market Value ($) and Growth Rate Forecast of Power over Ethernet-PoW (2019-2024) Figure Global Automotive Navigation Solutions Market Volume and Growth Rate Forecast of Power over Ethernet-PoW (2019-2024) Figure Global Automotive Navigation Solutions Market Value ($) and Growth Rate Forecast of Gigabit Ethernet –GIG-E (2019-2024) Figure Global Automotive Navigation Solutions Market Volume and Growth Rate Forecast of Gigabit Ethernet –GIG-E (2019-2024) Table Global Market Value ($) Forecast by Application (2019-2024) Table Global Market Volume Forecast by Application (2019-2024) Figure Global Automotive Navigation Solutions Consumption and Growth Rate of Passenger car (2014-2019) Figure Global Automotive Navigation Solutions Consumption and Growth Rate of Light commercial vehicle (2014-2019) Figure Global Automotive Navigation Solutions Consumption and Growth Rate of Heavy commercial vehicle (2014-2019) Figure Market Value ($) and Growth Rate Forecast of Heavy commercial vehicle (2019-2024) Figure Market Volume and Growth Rate Forecast of Heavy commercial vehicle (2019-2024) Figure North America Market Value ($) and Growth Rate Forecast (2019-2024) Table North America Consumption and Growth Rate Forecast (2019-2024) Figure Europe Market Value ($) and Growth Rate Forecast (2019-2024) Table Europe Consumption and Growth Rate Forecast (2019-2024) Figure China Market Value ($) and Growth Rate Forecast (2019-2024) Table China Consumption and Growth Rate Forecast (2019-2024) Figure Japan Market Value ($) and Growth Rate Forecast (2019-2024) Table Japan Consumption and Growth Rate Forecast (2019-2024) Figure Middle East & Africa Market Value ($) and Growth Rate Forecast (2019-2024) Table Middle East & Africa Consumption and Growth Rate Forecast (2019-2024) Figure India Market Value ($) and Growth Rate Forecast (2019-2024) Table India Consumption and Growth Rate Forecast (2019-2024) Figure South America Market Value ($) and Growth Rate Forecast (2019-2024) Table South America Consumption and Growth Rate Forecast (2019-2024) Figure Industry Resource/Technology/Labor Importance Analysis Table New Entrants SWOT Analysis Table New Project Analysis of Investment Recovery
Inquiry For Buying
Automotive Navigation Solutions
Request Sample
Automotive Navigation Solutions