Automotive Over-The-Air (OTA) Market Size, Share, and Trends Analysis Report
CAGR :

| Market Size 2023 (Base Year) | USD 5.04 Billion |
| Market Size 2032 (Forecast Year) | USD 30.17 Billion |
| CAGR | 22% |
| Forecast Period | 2024 - 2032 |
| Historical Period | 2018 - 2023 |
Automotive Over-The-Air (OTA) Market Insights
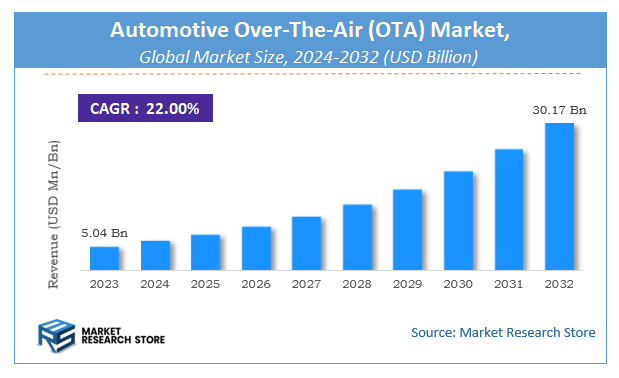
As per the published report by Market Research Store, the Global Automotive Over-The-Air (OTA) Market size was estimated at USD 5.04 Billion in 2023 and is anticipated to reach reach USD 30.17 Billion by 2032, growing at a projected CAGR of 22% during the forecast period 2024-2032. The report provides a detailed analysis of the global Automotive Over-The-Air (OTA) Market, including market trends, market dynamics, and market opportunities during the forecast period (2024-2032). It delves deeper into several market facets, such as market definition, size, growth, forecast, segmentation, competitive analysis, growth drivers, restraints, financial analysis, SWOT analysis, PORTER’s five force analysis, PESTEL analysis, market share analysis, cost-benefit analysis, challenges, restraints, strategic recommendations, and market players.
Automotive Over-The-Air (OTA) Market: Overview
The growth of the automotive over-the-air (OTA) market is fueled by rising global demand across various industries and applications. The report highlights lucrative opportunities, analyzing cost structures, key segments, emerging trends, regional dynamics, and advancements by leading players to provide comprehensive market insights. The automotive over-the-air (OTA) market report offers a detailed industry analysis from 2024 to 2032, combining quantitative and qualitative insights. It examines key factors such as pricing, market penetration, GDP impact, industry dynamics, major players, consumer behavior, and socio-economic conditions. Structured into multiple sections, the report provides a comprehensive perspective on the market from all angles.
Key sections of the automotive over-the-air (OTA) market report include market segments, outlook, competitive landscape, and company profiles. Market Segments offer in-depth details based on Technology, Vehicle Type, Propulsion, Application, Electric Vehicle Type, and other relevant classifications to support strategic marketing initiatives. Market Outlook thoroughly analyzes market trends, growth drivers, restraints, opportunities, challenges, Porter’s Five Forces framework, macroeconomic factors, value chain analysis, and pricing trends shaping the market now and in the future. The Competitive Landscape and Company Profiles section highlights major players, their strategies, and market positioning to guide investment and business decisions. The report also identifies innovation trends, new business opportunities, and investment prospects for the forecast period.
Key Highlights:
- As per the analysis shared by our research analyst, the global automotive over-the-air (OTA) market is estimated to grow annually at a CAGR of around 22% over the forecast period (2024-2032).
- In terms of revenue, the global automotive over-the-air (OTA) market size was valued at around USD 5.04 Billion in 2023 and is projected to reach USD 30.17 Billion by 2032.
- The market is projected to grow at a significant rate due to expanding due to remote software updates, cybersecurity improvements, and growing vehicle digitalization.
- Based on the Technology, the Firmware segment is growing at a high rate and will continue to dominate the global market as per industry projections.
- On the basis of Vehicle Type, the Passenger Car segment is anticipated to command the largest market share.
- In terms of Propulsion, the Internal Combustion Engine segment is projected to lead the global market.
- By Application, the Electronic Control Unit (ECU) segment is predicted to dominate the global market.
- Based on the Electric Vehicle Type, the Battery segment is expected to swipe the largest market share.
- Based on region, North America is projected to dominate the global market during the forecast period.
Automotive Over-The-Air (OTA) Market: Report Scope
This report thoroughly analyzes the automotive over-the-air (OTA) market, exploring its historical trends, current state, and future projections. The market estimates presented result from a robust research methodology, incorporating primary research, secondary sources, and expert opinions. These estimates are influenced by the prevailing market dynamics as well as key economic, social, and political factors. Furthermore, the report considers the impact of regulations, government expenditures, and advancements in research and development on the market. Both positive and negative shifts are evaluated to ensure a comprehensive and accurate market outlook.
| Report Attributes | Report Details |
|---|---|
| Report Name | Automotive Over-The-Air (OTA) Market |
| Market Size in 2023 | USD 5.04 Billion |
| Market Forecast in 2032 | USD 30.17 Billion |
| Growth Rate | CAGR of 22% |
| Number of Pages | 157 |
| Key Companies Covered | Blackberry Limited, Autonet Mobile, Red Bend (Harman International Industries), Movimento Inc, Airbiquity, Excelfore Corporation, Arynga, Escrypt Mobile, ATS Advanced Telematic Systems (HERE Technologies), Continental AG |
| Segments Covered | By Technology, By Vehicle Type, By Propulsion, By Application, By Electric Vehicle Type, and By Region |
| Regions Covered | North America, Europe, Asia Pacific (APAC), Latin America, Middle East, and Africa (MEA) |
| Base Year | 2023 |
| Historical Year | 2018 to 2023 |
| Forecast Year | 2024 to 2032 |
| Customization Scope | Avail customized purchase options to meet your exact research needs. Request For Customization |
Automotive Over-The-Air (OTA) Market: Dynamics
Key Growth Drivers
The mini drone market in April 2025 continues its robust growth trajectory, primarily fueled by the increasing accessibility and affordability of these compact aerial vehicles. Technological advancements have packed sophisticated features like high-resolution cameras, GPS navigation, and obstacle avoidance into increasingly smaller and lighter frames, making them appealing to a broad consumer base, from hobbyists and recreational users to professionals in fields like real estate (for aerial photography), event coverage, and even basic infrastructure inspection. The ease of learning to fly mini drones compared to their larger counterparts also contributes significantly to their popularity. Furthermore, the expanding applications in niche areas such as indoor inspections, aerial videography for social media content creation, and educational purposes are driving demand. The relatively lower regulatory hurdles associated with operating smaller drones in many regions, compared to larger commercial drones, further facilitates market expansion and adoption by individual consumers and small businesses.
Restraints
Despite the strong upward trend, the mini drone market in April 2025 still faces certain limitations. A persistent concern revolves around privacy issues, as the proliferation of camera-equipped mini drones raises anxieties about unauthorized surveillance and data collection, leading to ongoing discussions and evolving regulations in various jurisdictions. The limited battery life and flight range of many mini drones, while improving, still restrict their utility for more demanding or long-duration tasks. Weather dependency remains a significant restraint, as even moderate wind or rain can severely impact the stability and safety of these lightweight aircraft. The potential for misuse, such as flying in restricted airspace (e.g., near airports) or for illicit activities, continues to be a regulatory challenge and can lead to stricter operational guidelines affecting all users. Moreover, the payload capacity of mini drones remains relatively small, limiting their ability to carry heavier sensors or equipment for more specialized professional applications.
Opportunities
The mini drone market in April 2025 presents numerous exciting opportunities for innovation and expansion. The ongoing integration of advanced artificial intelligence (AI) and machine learning algorithms is enabling more autonomous flight capabilities, sophisticated object recognition, and enhanced data analysis from captured imagery and video, opening doors for applications in areas like automated surveillance, precision agriculture (for small-scale monitoring), and even search and rescue operations in confined spaces. The development of more energy-dense and lighter battery technologies promises to significantly extend flight times and operational ranges. Advancements in miniaturized sensor technology are leading to improved obstacle avoidance systems, more accurate indoor navigation, and enhanced stability in GPS-denied environments. The burgeoning interest in drone-based entertainment, such as synchronized light shows and interactive experiences, presents a unique growth avenue. Furthermore, the potential for mini drones to play a role in last-mile delivery for small packages in urban and suburban environments is an area of active development and holds significant future promise.
Challenges
The mini drone market in April 2025 continues to grapple with several key challenges. Harmonizing the regulatory landscape across different countries and even within regions remains a significant hurdle for manufacturers and users alike, creating uncertainty and hindering widespread commercial adoption in some areas. Ensuring the safety and security of drone operations, particularly with increasing numbers of drones in the skies, necessitates robust safety features, effective geofencing technologies, and comprehensive user education. Addressing public concerns regarding privacy and data security requires manufacturers to implement strong data encryption and privacy protection measures. Maintaining a balance between innovation and affordability is a constant challenge, as consumers often demand advanced features at competitive prices. The need for standardization in drone technology, communication protocols, and data formats is becoming increasingly important for interoperability and the development of supporting ecosystems. Finally, ensuring the long-term durability and reliability of these relatively inexpensive devices, which are often subjected to outdoor use and potential crashes, is crucial for building consumer trust and fostering sustained market growth.
Automotive Over-The-Air (OTA) Market: Segmentation Insights
The global automotive over-the-air (OTA) market is segmented based on Technology, Vehicle Type, Propulsion, Application, Electric Vehicle Type, and Region. All the segments of the automotive over-the-air (OTA) market have been analyzed based on present & future trends and the market is estimated from 2024 to 2032.
Based on Technology, the global automotive over-the-air (OTA) market is divided into Firmware, Software.
On the basis of Vehicle Type, the global automotive over-the-air (OTA) market is bifurcated into Passenger Car, Light Commercial Vehicle, Heavy Commercial Vehicle.
In terms of Propulsion, the global automotive over-the-air (OTA) market is categorized into Internal Combustion Engine, Electric.
Based on Application, the global automotive over-the-air (OTA) market is split into Electronic Control Unit (ECU), Infotainment, Safety & Security, Telematics Control Unit (TCU) and 0thers.
By Electric Vehicle Type, the global automotive over-the-air (OTA) market is divided into Battery, Hybrid and Plug-In Hybrid.
Automotive Over-The-Air (OTA) Market: Regional Insights
The Automotive Over-The-Air (OTA) Market is dominated by North America, driven by the region’s advanced automotive technology, high adoption of connected vehicles, and strong presence of leading OEMs and tech firms. The United States holds the largest market share, supported by robust investments in electric and autonomous vehicles, stringent cybersecurity regulations, and consumer demand for seamless software updates. Europe follows closely, with countries like Germany, the UK, and France prioritizing OTA integration for compliance with EU emissions standards and enhanced vehicle safety. The Asia-Pacific region is the fastest-growing market, fueled by rising EV production, government smart mobility initiatives, and expanding 5G infrastructure in China, Japan, and South Korea. However, North America remains the dominant region due to its technological leadership, collaborative ecosystem (e.g., Tesla, GM), and early adoption of OTA solutions.
Automotive Over-The-Air (OTA) Market: Competitive Landscape
The automotive over-the-air (OTA) market Report offers a thorough analysis of both established and emerging players within the market. It includes a detailed list of key companies, categorized based on the types of products they offer and other relevant factors. The report also highlights the market entry year for each player, providing further context for the research analysis.
The "Global Automotive Over-The-Air (OTA) Market" study offers valuable insights, focusing on the global market landscape, with an emphasis on major industry players such as;
- Blackberry Limited
- Autonet Mobile
- Red Bend (Harman International Industries)
- Movimento Inc
- Airbiquity
- Excelfore Corporation
- Arynga
- Escrypt Mobile
- ATS Advanced Telematic Systems (HERE Technologies)
- Continental AG
The Global Automotive Over-The-Air (OTA) Market is Segmented as Follows:
By Technology
- Firmware
- Software
By Vehicle Type
- Passenger Car
- Light Commercial Vehicle
- Heavy Commercial Vehicle
By Propulsion
- Internal Combustion Engine
- Electric
By Application
- Electronic Control Unit (ECU)
- Infotainment
- Safety & Security
- Telematics Control Unit (TCU) and 0thers
By Electric Vehicle Type
- Battery
- Hybrid and Plug-In Hybrid
By Region
- North America
- The U.S.
- Canada
- Mexico
- Europe
- France
- The UK
- Spain
- Germany
- Italy
- Rest of Europe
- Asia Pacific
- China
- Japan
- India
- Australia
- South Korea
- Rest of Asia Pacific
- The Middle East & Africa
- Saudi Arabia
- UAE
- Egypt
- Kuwait
- South Africa
- Rest of the Middle East & Africa
- Latin America
- Brazil
- Argentina
- Rest of Latin America
Market Evolution
This section evaluates the market position of the product or service by examining its development pathway and competitive dynamics. It provides a detailed overview of the product's growth stages, including the early (historical) phase, the mid-stage, and anticipated future advancements influenced by innovation and emerging technologies.
Porter’s Analysis
Porter’s Five Forces framework offers a strategic lens for assessing competitor behavior and the positioning of key players in the automotive over-the-air (OTA) industry. This section explores the external factors shaping competitive dynamics and influencing market strategies in the years ahead. The analysis focuses on five critical forces:
- Competitive Rivalry
- Threat of New Entrants
- Threat of Substitutes
- Supplier Bargaining Power
- Buyer Bargaining Power
Value Chain & Market Attractiveness Analysis
The value chain analysis helps businesses optimize operations by mapping the product flow from suppliers to end consumers, identifying opportunities to streamline processes and gain a competitive edge. Segment-wise market attractiveness analysis evaluates key dimensions like product categories, demographics, and regions, assessing growth potential, market size, and profitability. This enables businesses to focus resources on high-potential segments for better ROI and long-term value.
PESTEL Analysis
PESTEL analysis is a powerful tool in market research reports that enhances market understanding by systematically examining the external macro-environmental factors influencing a business or industry. The acronym stands for Political, Economic, Social, Technological, Environmental, and Legal factors. By evaluating these dimensions, PESTEL analysis provides a comprehensive overview of the broader context within which a market operates, helping businesses identify potential opportunities and threats.
- Political factors assess government policies, stability, trade regulations, and political risks that could impact market operations.
- Economic factors examine variables like inflation, exchange rates, economic growth, and consumer spending power to determine market viability.
- Social factors explore cultural trends, demographics, and lifestyle changes that shape consumer behavior and preferences.
- Technological factors evaluate innovation, R&D, and technological advancements affecting product development and operational efficiencies.
- Environmental factors focus on sustainability, climate change impacts, and eco-friendly practices shaping market trends.
- Legal factors address compliance requirements, industry regulations, and intellectual property laws impacting market entry and operations.
Import-Export Analysis & Pricing Analysis
An import-export analysis is vital for market research, revealing global trade dynamics, trends, and opportunities. It examines trade volumes, product categories, and regional competitiveness, offering insights into supply chains and market demand. This section also analyzes past and future pricing trends, helping businesses optimize strategies and enabling consumers to assess product value effectively.
Automotive Over-The-Air (OTA) Market: Company Profiles
The report identifies key players in the automotive over-the-air (OTA) market through a competitive landscape and company profiles, evaluating their offerings, financial performance, strategies, and market positioning. It includes a SWOT analysis of the top 3-5 companies, assessing strengths, weaknesses, opportunities, and threats. The competitive landscape highlights rankings, recent activities (mergers, acquisitions, partnerships, product launches), and regional footprints using the Ace matrix. Customization is available to meet client-specific needs.
Regional & Industry Footprint
This section details the geographic reach, sales networks, and market penetration of companies profiled in the automotive over-the-air (OTA) report, showcasing their operations and distribution across regions. It analyzes the alignment of companies with specific industry verticals, highlighting the industries they serve and the scope of their products and services within those sectors.
Ace Matrix
This section categorizes companies into four distinct groups—Active, Cutting Edge, Innovator, and Emerging—based on their product and business strategies. The evaluation of product strategy focuses on aspects such as the range and depth of offerings, commitment to innovation, product functionalities, and scalability. Key elements like global reach, sector coverage, strategic acquisitions, and long-term growth plans are considered for business strategy. This analysis provides a detailed view of companies' position within the market and highlights their potential for future growth and development.
Research Methodology
The qualitative and quantitative insights for the automotive over-the-air (OTA) market are derived through a multi-faceted research approach, combining input from subject matter experts, primary research, and secondary data sources. Primary research includes gathering critical information via face-to-face or telephonic interviews, surveys, questionnaires, and feedback from industry professionals, key opinion leaders (KOLs), and customers. Regular interviews with industry experts are conducted to deepen the analysis and reinforce the existing data, ensuring a robust and well-rounded market understanding.
Secondary research for this report was carried out by the Market Research Store team, drawing on a variety of authoritative sources, such as:
- Official company websites, annual reports, financial statements, investor presentations, and SEC filings
- Internal and external proprietary databases, as well as relevant patent and regulatory databases
- Government publications, national statistical databases, and industry-specific market reports
- Media coverage, including news articles, press releases, and webcasts about market participants
- Paid industry databases for detailed market insights
Market Research Store conducted in-depth consultations with various key opinion leaders in the industry, including senior executives from top companies and regional leaders from end-user organizations. This effort aimed to gather critical insights on factors such as the market share of dominant brands in specific countries and regions, along with pricing strategies for products and services.
To determine total sales data, the research team conducted primary interviews across multiple countries with influential stakeholders, including:
- Distributors
- Marketing, Brand, and Product Managers
- Procurement and Production Managers
- Sales and Regional Sales Managers, Country Managers
- Technical Specialists
- C-Level Executives
These subject matter experts, with their extensive industry experience, helped validate and refine the findings. For secondary research, data were sourced from a wide range of materials, including online resources, company annual reports, industry publications, research papers, association reports, and government websites. These various sources provide a comprehensive and well-rounded perspective on the market.
Frequently Asked Questions
Table Of Content
List of Tables and Figures Figure Product Picture of Automotive Over-The-Air (OTA) Table Product Specification of Automotive Over-The-Air (OTA) Figure Market Concentration Ratio and Market Maturity Analysis of Automotive Over-The-Air (OTA) Figure Global Automotive Over-The-Air (OTA) Value ($) and Growth Rate from 2014-2024 Table Different Types of Automotive Over-The-Air (OTA) Figure Global Automotive Over-The-Air (OTA) Value ($) Segment by Type from 2014-2019 Figure Firmware Over-the-air (FOTA) Picture Figure Software Over-the-air (SOTA) Picture Table Different Applications of Automotive Over-The-Air (OTA) Figure Global Automotive Over-The-Air (OTA) Value ($) Segment by Applications from 2014-2019 Figure Passenger Vehicles Picture Figure Commercial Vehicles Picture Table Research Regions of Automotive Over-The-Air (OTA) Figure North America Automotive Over-The-Air (OTA) Production Value ($) and Growth Rate (2014-2019) Figure Europe Automotive Over-The-Air (OTA) Production Value ($) and Growth Rate (2014-2019) Table China Automotive Over-The-Air (OTA) Production Value ($) and Growth Rate (2014-2019) Table Japan Automotive Over-The-Air (OTA) Production Value ($) and Growth Rate (2014-2019) Table Middle East & Africa Automotive Over-The-Air (OTA) Production Value ($) and Growth Rate (2014-2019) Table India Automotive Over-The-Air (OTA) Production Value ($) and Growth Rate (2014-2019) Table South America Automotive Over-The-Air (OTA) Production Value ($) and Growth Rate (2014-2019) Table Emerging Countries of Automotive Over-The-Air (OTA) Table Growing Market of Automotive Over-The-Air (OTA) Figure Industry Chain Analysis of Automotive Over-The-Air (OTA) Table Upstream Raw Material Suppliers of Automotive Over-The-Air (OTA) with Contact Information Table Major Players Manufacturing Base and Market Share ($) of Automotive Over-The-Air (OTA) in 2018 Table Major Players Automotive Over-The-Air (OTA) Product Types in 2018 Figure Production Process of Automotive Over-The-Air (OTA) Figure Manufacturing Cost Structure of Automotive Over-The-Air (OTA) Figure Channel Status of Automotive Over-The-Air (OTA) Table Major Distributors of Automotive Over-The-Air (OTA) with Contact Information Table Major Downstream Buyers of Automotive Over-The-Air (OTA) with Contact Information Table Global Automotive Over-The-Air (OTA) Value ($) by Type (2014-2019) Table Global Automotive Over-The-Air (OTA) Value ($) Share by Type (2014-2019) Figure Global Automotive Over-The-Air (OTA) Value ($) Share by Type (2014-2019) Table Global Automotive Over-The-Air (OTA) Production by Type (2014-2019) Table Global Automotive Over-The-Air (OTA) Production Share by Type (2014-2019) Figure Global Automotive Over-The-Air (OTA) Production Share by Type (2014-2019) Figure Global Automotive Over-The-Air (OTA) Value ($) and Growth Rate of Firmware Over-the-air (FOTA) Figure Global Automotive Over-The-Air (OTA) Value ($) and Growth Rate of Software Over-the-air (SOTA) Figure Global Automotive Over-The-Air (OTA) Price by Type (2014-2019) Table Global Automotive Over-The-Air (OTA) Consumption by Application (2014-2019) Table Global Automotive Over-The-Air (OTA) Consumption Market Share by Application (2014-2019) Figure Global Automotive Over-The-Air (OTA) Consumption Market Share by Application (2014-2019) Table Downstream Buyers Introduction by Application Figure Global Automotive Over-The-Air (OTA) Consumption and Growth Rate of Passenger Vehicles (2014-2019) Figure Global Automotive Over-The-Air (OTA) Consumption and Growth Rate of Commercial Vehicles (2014-2019) Table Global Automotive Over-The-Air (OTA) Value ($) by Region (2014-2019) Table Global Automotive Over-The-Air (OTA) Value ($) Market Share by Region (2014-2019) Figure Global Automotive Over-The-Air (OTA) Value ($) Market Share by Region (2014-2019) Table Global Automotive Over-The-Air (OTA) Production by Region (2014-2019) Table Global Automotive Over-The-Air (OTA) Production Market Share by Region (2014-2019) Figure Global Automotive Over-The-Air (OTA) Production Market Share by Region (2014-2019) Table Global Automotive Over-The-Air (OTA) Production, Value ($), Price and Gross Margin (2014-2019) Table North America Automotive Over-The-Air (OTA) Production, Value ($), Price and Gross Margin (2014-2019) Table Europe Automotive Over-The-Air (OTA) Production, Value ($), Price and Gross Margin (2014-2019) Table China Automotive Over-The-Air (OTA) Production, Value ($), Price and Gross Margin (2014-2019) Table Japan Automotive Over-The-Air (OTA) Production, Value ($), Price and Gross Margin (2014-2019) Table Middle East & Africa Automotive Over-The-Air (OTA) Production, Value ($), Price and Gross Margin (2014-2019) Table India Automotive Over-The-Air (OTA) Production, Value ($), Price and Gross Margin (2014-2019) Table South America Automotive Over-The-Air (OTA) Production, Value ($), Price and Gross Margin (2014-2019) Table Global Automotive Over-The-Air (OTA) Consumption by Regions (2014-2019) Figure Global Automotive Over-The-Air (OTA) Consumption Share by Regions (2014-2019) Table North America Automotive Over-The-Air (OTA) Production, Consumption, Export, Import (2014-2019) Table Europe Automotive Over-The-Air (OTA) Production, Consumption, Export, Import (2014-2019) Table China Automotive Over-The-Air (OTA) Production, Consumption, Export, Import (2014-2019) Table Japan Automotive Over-The-Air (OTA) Production, Consumption, Export, Import (2014-2019) Table Middle East & Africa Automotive Over-The-Air (OTA) Production, Consumption, Export, Import (2014-2019) Table India Automotive Over-The-Air (OTA) Production, Consumption, Export, Import (2014-2019) Table South America Automotive Over-The-Air (OTA) Production, Consumption, Export, Import (2014-2019) Figure North America Automotive Over-The-Air (OTA) Production and Growth Rate Analysis Figure North America Automotive Over-The-Air (OTA) Consumption and Growth Rate Analysis Figure North America Automotive Over-The-Air (OTA) SWOT Analysis Figure Europe Automotive Over-The-Air (OTA) Production and Growth Rate Analysis Figure Europe Automotive Over-The-Air (OTA) Consumption and Growth Rate Analysis Figure Europe Automotive Over-The-Air (OTA) SWOT Analysis Figure China Automotive Over-The-Air (OTA) Production and Growth Rate Analysis Figure China Automotive Over-The-Air (OTA) Consumption and Growth Rate Analysis Figure China Automotive Over-The-Air (OTA) SWOT Analysis Figure Japan Automotive Over-The-Air (OTA) Production and Growth Rate Analysis Figure Japan Automotive Over-The-Air (OTA) Consumption and Growth Rate Analysis Figure Japan Automotive Over-The-Air (OTA) SWOT Analysis Figure Middle East & Africa Automotive Over-The-Air (OTA) Production and Growth Rate Analysis Figure Middle East & Africa Automotive Over-The-Air (OTA) Consumption and Growth Rate Analysis Figure Middle East & Africa Automotive Over-The-Air (OTA) SWOT Analysis Figure India Automotive Over-The-Air (OTA) Production and Growth Rate Analysis Figure India Automotive Over-The-Air (OTA) Consumption and Growth Rate Analysis Figure India Automotive Over-The-Air (OTA) SWOT Analysis Figure South America Automotive Over-The-Air (OTA) Production and Growth Rate Analysis Figure South America Automotive Over-The-Air (OTA) Consumption and Growth Rate Analysis Figure South America Automotive Over-The-Air (OTA) SWOT Analysis Figure Top 3 Market Share of Automotive Over-The-Air (OTA) Companies Figure Top 6 Market Share of Automotive Over-The-Air (OTA) Companies Table Mergers, Acquisitions and Expansion Analysis Table Company Profiles Table Product Introduction Table Blackberry Limited Production, Value ($), Price, Gross Margin 2014-2019 Figure Blackberry Limited Production and Growth Rate Figure Blackberry Limited Value ($) Market Share 2014-2019 Figure Blackberry Limited Market Share of Automotive Over-The-Air (OTA) Segmented by Region in 2018 Table Company Profiles Table Product Introduction Table Autonet Mobile Production, Value ($), Price, Gross Margin 2014-2019 Figure Autonet Mobile Production and Growth Rate Figure Autonet Mobile Value ($) Market Share 2014-2019 Figure Autonet Mobile Market Share of Automotive Over-The-Air (OTA) Segmented by Region in 2018 Table Company Profiles Table Product Introduction Table Red Bend (Harman International Industries) Production, Value ($), Price, Gross Margin 2014-2019 Figure Red Bend (Harman International Industries) Production and Growth Rate Figure Red Bend (Harman International Industries) Value ($) Market Share 2014-2019 Figure Red Bend (Harman International Industries) Market Share of Automotive Over-The-Air (OTA) Segmented by Region in 2018 Table Company Profiles Table Product Introduction Table Movimento Inc Production, Value ($), Price, Gross Margin 2014-2019 Figure Movimento Inc Production and Growth Rate Figure Movimento Inc Value ($) Market Share 2014-2019 Figure Movimento Inc Market Share of Automotive Over-The-Air (OTA) Segmented by Region in 2018 Table Company Profiles Table Product Introduction Table Airbiquity Production, Value ($), Price, Gross Margin 2014-2019 Figure Airbiquity Production and Growth Rate Figure Airbiquity Value ($) Market Share 2014-2019 Figure Airbiquity Market Share of Automotive Over-The-Air (OTA) Segmented by Region in 2018 Table Company Profiles Table Product Introduction Table Excelfore Corporation Production, Value ($), Price, Gross Margin 2014-2019 Figure Excelfore Corporation Production and Growth Rate Figure Excelfore Corporation Value ($) Market Share 2014-2019 Figure Excelfore Corporation Market Share of Automotive Over-The-Air (OTA) Segmented by Region in 2018 Table Company Profiles Table Product Introduction Table Arynga Production, Value ($), Price, Gross Margin 2014-2019 Figure Arynga Production and Growth Rate Figure Arynga Value ($) Market Share 2014-2019 Figure Arynga Market Share of Automotive Over-The-Air (OTA) Segmented by Region in 2018 Table Company Profiles Table Product Introduction Table Escrypt Mobile Production, Value ($), Price, Gross Margin 2014-2019 Figure Escrypt Mobile Production and Growth Rate Figure Escrypt Mobile Value ($) Market Share 2014-2019 Figure Escrypt Mobile Market Share of Automotive Over-The-Air (OTA) Segmented by Region in 2018 Table Company Profiles Table Product Introduction Table ATS Advanced Telematic Systems (HERE Technologies) Production, Value ($), Price, Gross Margin 2014-2019 Figure ATS Advanced Telematic Systems (HERE Technologies) Production and Growth Rate Figure ATS Advanced Telematic Systems (HERE Technologies) Value ($) Market Share 2014-2019 Figure ATS Advanced Telematic Systems (HERE Technologies) Market Share of Automotive Over-The-Air (OTA) Segmented by Region in 2018 Table Company Profiles Table Product Introduction Table Continental AG Production, Value ($), Price, Gross Margin 2014-2019 Figure Continental AG Production and Growth Rate Figure Continental AG Value ($) Market Share 2014-2019 Figure Continental AG Market Share of Automotive Over-The-Air (OTA) Segmented by Region in 2018 Table Global Automotive Over-The-Air (OTA) Market Value ($) Forecast, by Type Table Global Automotive Over-The-Air (OTA) Market Volume Forecast, by Type Figure Global Automotive Over-The-Air (OTA) Market Value ($) and Growth Rate Forecast of Firmware Over-the-air (FOTA) (2019-2024) Figure Global Automotive Over-The-Air (OTA) Market Volume and Growth Rate Forecast of Firmware Over-the-air (FOTA) (2019-2024) Figure Global Automotive Over-The-Air (OTA) Market Value ($) and Growth Rate Forecast of Software Over-the-air (SOTA) (2019-2024) Figure Global Automotive Over-The-Air (OTA) Market Volume and Growth Rate Forecast of Software Over-the-air (SOTA) (2019-2024) Table Global Market Value ($) Forecast by Application (2019-2024) Table Global Market Volume Forecast by Application (2019-2024) Figure Global Automotive Over-The-Air (OTA) Consumption and Growth Rate of Passenger Vehicles (2014-2019) Figure Global Automotive Over-The-Air (OTA) Consumption and Growth Rate of Commercial Vehicles (2014-2019) Figure Market Value ($) and Growth Rate Forecast of Commercial Vehicles (2019-2024) Figure Market Volume and Growth Rate Forecast of Commercial Vehicles (2019-2024) Figure North America Market Value ($) and Growth Rate Forecast (2019-2024) Table North America Consumption and Growth Rate Forecast (2019-2024) Figure Europe Market Value ($) and Growth Rate Forecast (2019-2024) Table Europe Consumption and Growth Rate Forecast (2019-2024) Figure China Market Value ($) and Growth Rate Forecast (2019-2024) Table China Consumption and Growth Rate Forecast (2019-2024) Figure Japan Market Value ($) and Growth Rate Forecast (2019-2024) Table Japan Consumption and Growth Rate Forecast (2019-2024) Figure Middle East & Africa Market Value ($) and Growth Rate Forecast (2019-2024) Table Middle East & Africa Consumption and Growth Rate Forecast (2019-2024) Figure India Market Value ($) and Growth Rate Forecast (2019-2024) Table India Consumption and Growth Rate Forecast (2019-2024) Figure South America Market Value ($) and Growth Rate Forecast (2019-2024) Table South America Consumption and Growth Rate Forecast (2019-2024) Figure Industry Resource/Technology/Labor Importance Analysis Table New Entrants SWOT Analysis Table New Project Analysis of Investment Recovery
Inquiry For Buying
Automotive Over-The-Air (OTA)
Request Sample
Automotive Over-The-Air (OTA)