Automotive Pump Market Size, Share, and Trends Analysis Report
CAGR :

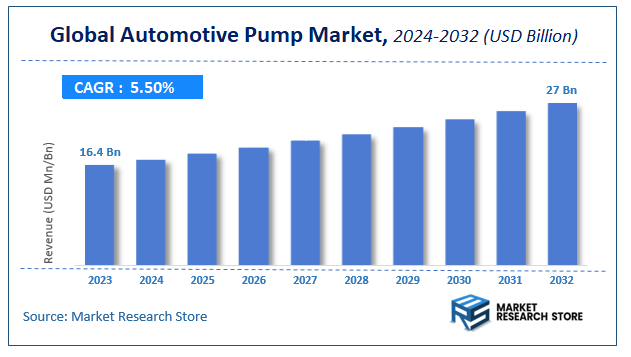
| Market Size 2023 (Base Year) | USD 16.4 Billion |
| Market Size 2032 (Forecast Year) | USD 27 Billion |
| CAGR | 5.5% |
| Forecast Period | 2024 - 2032 |
| Historical Period | 2018 - 2023 |
Automotive Pump Market Insights
As per the published report by Market Research Store, the Global Automotive Pump Market size was estimated at USD 16.4 Billion in 2023 and is anticipated to reach reach USD 27 Billion by 2032, growing at a projected CAGR of 5.5% during the forecast period 2024-2032. The report provides a detailed analysis of the global Automotive Pump Market, including market trends, market dynamics, and market opportunities during the forecast period (2024-2032). It delves deeper into several market facets, such as market definition, size, growth, forecast, segmentation, competitive analysis, growth drivers, restraints, financial analysis, SWOT analysis, PORTER’s five force analysis, PESTEL analysis, market share analysis, cost-benefit analysis, challenges, restraints, strategic recommendations, and market players.
Automotive Pump Market: Overview
The growth of the automotive pump market is fueled by rising global demand across various industries and applications. The report highlights lucrative opportunities, analyzing cost structures, key segments, emerging trends, regional dynamics, and advancements by leading players to provide comprehensive market insights. The automotive pump market report offers a detailed industry analysis from 2024 to 2032, combining quantitative and qualitative insights. It examines key factors such as pricing, market penetration, GDP impact, industry dynamics, major players, consumer behavior, and socio-economic conditions. Structured into multiple sections, the report provides a comprehensive perspective on the market from all angles.
Key sections of the automotive pump market report include market segments, outlook, competitive landscape, and company profiles. Market Segments offer in-depth details based on Pump, Sales Channel, Technology, Vehicle Type, and other relevant classifications to support strategic marketing initiatives. Market Outlook thoroughly analyzes market trends, growth drivers, restraints, opportunities, challenges, Porter’s Five Forces framework, macroeconomic factors, value chain analysis, and pricing trends shaping the market now and in the future. The Competitive Landscape and Company Profiles section highlights major players, their strategies, and market positioning to guide investment and business decisions. The report also identifies innovation trends, new business opportunities, and investment prospects for the forecast period.
Key Highlights:
- As per the analysis shared by our research analyst, the global automotive pump market is estimated to grow annually at a CAGR of around 5.5% over the forecast period (2024-2032).
- In terms of revenue, the global automotive pump market size was valued at around USD 16.4 Billion in 2023 and is projected to reach USD 27 Billion by 2032.
- The market is projected to grow at a significant rate due to increasing vehicle production, the growing demand for fuel-efficient and electric vehicles, and stricter environmental regulations.
- Based on the Pump, the Fuel Supply Pump segment is growing at a high rate and will continue to dominate the global market as per industry projections.
- On the basis of Sales Channel, the OEM segment is anticipated to command the largest market share.
- In terms of Technology, the Electric segment is projected to lead the global market.
- By Vehicle Type, the Passenger Cars segment is predicted to dominate the global market.
- Based on region, Asia-Pacific is projected to dominate the global market during the forecast period.
Automotive Pump Market: Report Scope
This report thoroughly analyzes the automotive pump market, exploring its historical trends, current state, and future projections. The market estimates presented result from a robust research methodology, incorporating primary research, secondary sources, and expert opinions. These estimates are influenced by the prevailing market dynamics as well as key economic, social, and political factors. Furthermore, the report considers the impact of regulations, government expenditures, and advancements in research and development on the market. Both positive and negative shifts are evaluated to ensure a comprehensive and accurate market outlook.
| Report Attributes | Report Details |
|---|---|
| Report Name | Automotive Pump Market |
| Market Size in 2023 | USD 16.4 Billion |
| Market Forecast in 2032 | USD 27 Billion |
| Growth Rate | CAGR of 5.5% |
| Number of Pages | 181 |
| Key Companies Covered | Magna International Inc., Rheinmetall Automotive AG, Pierburg Pump Technology, Johnson Electric Holdings Ltd., Delphi Technologies, Mikuni Corporation, SHW AG, Valeo SA, Hella GmbH & Co. KGaA |
| Segments Covered | By Pump, By Sales Channel, By Technology, By Vehicle Type, and By Region |
| Regions Covered | North America, Europe, Asia Pacific (APAC), Latin America, Middle East, and Africa (MEA) |
| Base Year | 2023 |
| Historical Year | 2018 to 2023 |
| Forecast Year | 2024 to 2032 |
| Customization Scope | Avail customized purchase options to meet your exact research needs. Request For Customization |
Automotive Pump Market: Dynamics
Key Growth Drivers
The Automotive Pump market in India is experiencing robust growth fueled by the increasing vehicle production across various segments, driven by a growing population and rising disposable incomes. Stringent emission regulations are also a key driver, necessitating the use of advanced and efficient pumps for fuel injection, exhaust gas recirculation, and other critical systems. Furthermore, the growing demand for fuel-efficient vehicles is pushing manufacturers to incorporate advanced pump technologies that optimize engine performance and reduce fuel consumption. The increasing adoption of electric and hybrid vehicles is also creating a demand for new types of pumps, such as those used in thermal management systems for batteries and electric motors.
Restraints
Despite the positive growth outlook, the Automotive Pump market in India faces certain restraints. Price sensitivity among a significant portion of vehicle buyers, particularly in the high-volume, cost-competitive segments, can limit the adoption of advanced and potentially more expensive pump technologies. Fluctuations in raw material prices, such as steel, aluminum, and plastics, can impact the manufacturing costs of automotive pumps. The complexity of integrating advanced pump systems with existing vehicle architectures and the need for skilled labor for manufacturing and assembly can also pose challenges. The slowdown in vehicle sales due to economic downturns or other factors can directly impact the demand for automotive pumps.
Opportunities
The Automotive Pump market in India presents significant opportunities for technological advancements and increased localization. The growing demand for electric vehicles offers a substantial opportunity for manufacturers to develop and supply pumps specifically designed for EVs, such as coolant pumps for battery thermal management and vacuum pumps for braking systems. The increasing focus on vehicle safety and comfort can drive the demand for pumps used in power steering, braking systems, and cabin climate control. Furthermore, the "Make in India" initiative encourages domestic manufacturing, providing opportunities for local players to increase their market share and reduce reliance on imports. The development of smarter and more efficient pumps utilizing sensors and electronic controls can also cater to the demand for enhanced vehicle performance and reduced emissions.
Challenges
The Automotive Pump market in India faces challenges related to meeting increasingly stringent emission and fuel efficiency standards while remaining cost-competitive. Ensuring the reliability and durability of pumps under diverse and often harsh operating conditions prevalent in India is crucial. Keeping pace with the rapid technological advancements in the automotive industry, such as the shift towards electrification and autonomous driving, requires continuous innovation and adaptation of pump technologies. Building a skilled workforce capable of designing, manufacturing, and servicing advanced automotive pump systems is also a significant challenge. Finally, navigating the complex and evolving regulatory landscape related to automotive components and emissions requires manufacturers to stay informed and adapt their products accordingly.
Automotive Pump Market: Segmentation Insights
The global automotive pump market is segmented based on Pump, Sales Channel, Technology, Vehicle Type, and Region. All the segments of the automotive pump market have been analyzed based on present & future trends and the market is estimated from 2024 to 2032.
Based on Pump, the global automotive pump market is divided into Fuel Supply Pump, Fuel Injection Pump, Transmission Oil Pump, Conventional Engine Oil Pump, Variable Engine Oil Pump, Steering Pump, Coolant Pump, Windshield Washer Pump, Vacuum Pump.
On the basis of Sales Channel, the global automotive pump market is bifurcated into OEM, Aftermarket, Masterbatch Pellet.
In terms of Technology, the global automotive pump market is categorized into Electric, Mechanical.
Based on Vehicle Type, the global automotive pump market is split into Passenger Cars, Light Commercial Vehicles, Heavy Commercial Vehicles, Two Wheeler.
Automotive Pump Market: Regional Insights
The Asia-Pacific (APAC) region dominates the global automotive pump market, holding the largest revenue share and exhibiting the fastest growth. In 2024, APAC accounted for 58.84% of the market share in automotive electric fuel pumps, driven by robust vehicle production in China, India, Japan, and South Korea . China, the world's largest automotive market, contributed $515.8 million in revenue for fuel transfer pumps alone, fueled by its massive passenger vehicle production (over 26 million units in 2023) and government-backed manufacturing initiatives . India’s automotive sector also saw record sales (2.5 crore units in 2024), with strong demand for fuel-efficient pumps in ICE vehicles.
The region’s growth is further propelled by rising EV adoption, stringent emission norms, and aftermarket demand for replacements, particularly in aging vehicle fleets like Japan’. Key players such as Aisin, Denso, and Bosch leverage APAC’s cost-competitive supply chains and R&D hubs, cementing its leadership. Europe and North America follow, with growth tied to electrification and regulatory compliance, but APAC’s scale and dynamism remain unmatched
Automotive Pump Market: Competitive Landscape
The automotive pump market report offers a thorough analysis of both established and emerging players within the market. It includes a detailed list of key companies, categorized based on the types of products they offer and other relevant factors. The report also highlights the market entry year for each player, providing further context for the research analysis.
The "Global Automotive Pump Market" study offers valuable insights, focusing on the global market landscape, with an emphasis on major industry players such as;
- Magna International Inc.
- Rheinmetall Automotive AG
- Pierburg Pump Technology
- Johnson Electric Holdings Ltd.
- Delphi Technologies
- Mikuni Corporation
- SHW AG
- Valeo SA
- Hella GmbH & Co. KGaA
The Global Automotive Pump Market is Segmented as Follows:
By Pump
- Fuel Supply Pump
- Fuel Injection Pump
- Transmission Oil Pump
- Conventional Engine Oil Pump
- Variable Engine Oil Pump
- Steering Pump
- Coolant Pump
- Windshield Washer Pump
- Vacuum Pump
By Sales Channel
- OEM
- Aftermarket
- Masterbatch Pellet
By Technology
- Electric
- Mechanical
By Vehicle Type
- Passenger Cars
- Light Commercial Vehicles
- Heavy Commercial Vehicles
- Two Wheeler
By Region
- North America
- The U.S.
- Canada
- Mexico
- Europe
- France
- The UK
- Spain
- Germany
- Italy
- Rest of Europe
- Asia Pacific
- China
- Japan
- India
- Australia
- South Korea
- Rest of Asia Pacific
- The Middle East & Africa
- Saudi Arabia
- UAE
- Egypt
- Kuwait
- South Africa
- Rest of the Middle East & Africa
- Latin America
- Brazil
- Argentina
- Rest of Latin America
Market Evolution
This section evaluates the market position of the product or service by examining its development pathway and competitive dynamics. It provides a detailed overview of the product's growth stages, including the early (historical) phase, the mid-stage, and anticipated future advancements influenced by innovation and emerging technologies.
Porter’s Analysis
Porter’s Five Forces framework offers a strategic lens for assessing competitor behavior and the positioning of key players in the automotive pump industry. This section explores the external factors shaping competitive dynamics and influencing market strategies in the years ahead. The analysis focuses on five critical forces:
- Competitive Rivalry
- Threat of New Entrants
- Threat of Substitutes
- Supplier Bargaining Power
- Buyer Bargaining Power
Value Chain & Market Attractiveness Analysis
The value chain analysis helps businesses optimize operations by mapping the product flow from suppliers to end consumers, identifying opportunities to streamline processes and gain a competitive edge. Segment-wise market attractiveness analysis evaluates key dimensions like product categories, demographics, and regions, assessing growth potential, market size, and profitability. This enables businesses to focus resources on high-potential segments for better ROI and long-term value.
PESTEL Analysis
PESTEL analysis is a powerful tool in market research reports that enhances market understanding by systematically examining the external macro-environmental factors influencing a business or industry. The acronym stands for Political, Economic, Social, Technological, Environmental, and Legal factors. By evaluating these dimensions, PESTEL analysis provides a comprehensive overview of the broader context within which a market operates, helping businesses identify potential opportunities and threats.
- Political factors assess government policies, stability, trade regulations, and political risks that could impact market operations.
- Economic factors examine variables like inflation, exchange rates, economic growth, and consumer spending power to determine market viability.
- Social factors explore cultural trends, demographics, and lifestyle changes that shape consumer behavior and preferences.
- Technological factors evaluate innovation, R&D, and technological advancements affecting product development and operational efficiencies.
- Environmental factors focus on sustainability, climate change impacts, and eco-friendly practices shaping market trends.
- Legal factors address compliance requirements, industry regulations, and intellectual property laws impacting market entry and operations.
Import-Export Analysis & Pricing Analysis
An import-export analysis is vital for market research, revealing global trade dynamics, trends, and opportunities. It examines trade volumes, product categories, and regional competitiveness, offering insights into supply chains and market demand. This section also analyzes past and future pricing trends, helping businesses optimize strategies and enabling consumers to assess product value effectively.
Automotive Pump Market: Company Profiles
The report identifies key players in the automotive pump market through a competitive landscape and company profiles, evaluating their offerings, financial performance, strategies, and market positioning. It includes a SWOT analysis of the top 3-5 companies, assessing strengths, weaknesses, opportunities, and threats. The competitive landscape highlights rankings, recent activities (mergers, acquisitions, partnerships, product launches), and regional footprints using the Ace matrix. Customization is available to meet client-specific needs.
Regional & Industry Footprint
This section details the geographic reach, sales networks, and market penetration of companies profiled in the automotive pump report, showcasing their operations and distribution across regions. It analyzes the alignment of companies with specific industry verticals, highlighting the industries they serve and the scope of their products and services within those sectors.
Ace Matrix
This section categorizes companies into four distinct groups—Active, Cutting Edge, Innovator, and Emerging—based on their product and business strategies. The evaluation of product strategy focuses on aspects such as the range and depth of offerings, commitment to innovation, product functionalities, and scalability. Key elements like global reach, sector coverage, strategic acquisitions, and long-term growth plans are considered for business strategy. This analysis provides a detailed view of companies' position within the market and highlights their potential for future growth and development.
Research Methodology
The qualitative and quantitative insights for the automotive pump market are derived through a multi-faceted research approach, combining input from subject matter experts, primary research, and secondary data sources. Primary research includes gathering critical information via face-to-face or telephonic interviews, surveys, questionnaires, and feedback from industry professionals, key opinion leaders (KOLs), and customers. Regular interviews with industry experts are conducted to deepen the analysis and reinforce the existing data, ensuring a robust and well-rounded market understanding.
Secondary research for this report was carried out by the Market Research Store team, drawing on a variety of authoritative sources, such as:
- Official company websites, annual reports, financial statements, investor presentations, and SEC filings
- Internal and external proprietary databases, as well as relevant patent and regulatory databases
- Government publications, national statistical databases, and industry-specific market reports
- Media coverage, including news articles, press releases, and webcasts about market participants
- Paid industry databases for detailed market insights
Market Research Store conducted in-depth consultations with various key opinion leaders in the industry, including senior executives from top companies and regional leaders from end-user organizations. This effort aimed to gather critical insights on factors such as the market share of dominant brands in specific countries and regions, along with pricing strategies for products and services.
To determine total sales data, the research team conducted primary interviews across multiple countries with influential stakeholders, including:
- Distributors
- Marketing, Brand, and Product Managers
- Procurement and Production Managers
- Sales and Regional Sales Managers, Country Managers
- Technical Specialists
- C-Level Executives
These subject matter experts, with their extensive industry experience, helped validate and refine the findings. For secondary research, data were sourced from a wide range of materials, including online resources, company annual reports, industry publications, research papers, association reports, and government websites. These various sources provide a comprehensive and well-rounded perspective on the market.
Frequently Asked Questions
Table Of Content
List of Tables and Figures Figure Product Picture of Automotive Pump Table Product Specification of Automotive Pump Figure Market Concentration Ratio and Market Maturity Analysis of Automotive Pump Figure Global Automotive Pump Value ($) and Growth Rate from 2014-2024 Table Different Types of Automotive Pump Figure Global Automotive Pump Value ($) Segment by Type from 2014-2019 Figure Fuel Pump Picture Figure Oil Pump Picture Figure Water Pump Picture Figure Steering Pump Picture Figure Windshield Washer Pump Picture Table Different Applications of Automotive Pump Figure Global Automotive Pump Value ($) Segment by Applications from 2014-2019 Figure Passenger Cars Picture Figure Light Commercial Vehicles Picture Figure Heavy Commercial Vehicles Picture Table Research Regions of Automotive Pump Figure North America Automotive Pump Production Value ($) and Growth Rate (2014-2019) Figure Europe Automotive Pump Production Value ($) and Growth Rate (2014-2019) Table China Automotive Pump Production Value ($) and Growth Rate (2014-2019) Table Japan Automotive Pump Production Value ($) and Growth Rate (2014-2019) Table Middle East & Africa Automotive Pump Production Value ($) and Growth Rate (2014-2019) Table India Automotive Pump Production Value ($) and Growth Rate (2014-2019) Table South America Automotive Pump Production Value ($) and Growth Rate (2014-2019) Table Emerging Countries of Automotive Pump Table Growing Market of Automotive Pump Figure Industry Chain Analysis of Automotive Pump Table Upstream Raw Material Suppliers of Automotive Pump with Contact Information Table Major Players Manufacturing Base and Market Share ($) of Automotive Pump in 2018 Table Major Players Automotive Pump Product Types in 2018 Figure Production Process of Automotive Pump Figure Manufacturing Cost Structure of Automotive Pump Figure Channel Status of Automotive Pump Table Major Distributors of Automotive Pump with Contact Information Table Major Downstream Buyers of Automotive Pump with Contact Information Table Global Automotive Pump Value ($) by Type (2014-2019) Table Global Automotive Pump Value ($) Share by Type (2014-2019) Figure Global Automotive Pump Value ($) Share by Type (2014-2019) Table Global Automotive Pump Production by Type (2014-2019) Table Global Automotive Pump Production Share by Type (2014-2019) Figure Global Automotive Pump Production Share by Type (2014-2019) Figure Global Automotive Pump Value ($) and Growth Rate of Fuel Pump Figure Global Automotive Pump Value ($) and Growth Rate of Oil Pump Figure Global Automotive Pump Value ($) and Growth Rate of Water Pump Figure Global Automotive Pump Value ($) and Growth Rate of Steering Pump Figure Global Automotive Pump Value ($) and Growth Rate of Windshield Washer Pump Figure Global Automotive Pump Price by Type (2014-2019) Table Global Automotive Pump Consumption by Application (2014-2019) Table Global Automotive Pump Consumption Market Share by Application (2014-2019) Figure Global Automotive Pump Consumption Market Share by Application (2014-2019) Table Downstream Buyers Introduction by Application Figure Global Automotive Pump Consumption and Growth Rate of Passenger Cars (2014-2019) Figure Global Automotive Pump Consumption and Growth Rate of Light Commercial Vehicles (2014-2019) Figure Global Automotive Pump Consumption and Growth Rate of Heavy Commercial Vehicles (2014-2019) Table Global Automotive Pump Value ($) by Region (2014-2019) Table Global Automotive Pump Value ($) Market Share by Region (2014-2019) Figure Global Automotive Pump Value ($) Market Share by Region (2014-2019) Table Global Automotive Pump Production by Region (2014-2019) Table Global Automotive Pump Production Market Share by Region (2014-2019) Figure Global Automotive Pump Production Market Share by Region (2014-2019) Table Global Automotive Pump Production, Value ($), Price and Gross Margin (2014-2019) Table North America Automotive Pump Production, Value ($), Price and Gross Margin (2014-2019) Table Europe Automotive Pump Production, Value ($), Price and Gross Margin (2014-2019) Table China Automotive Pump Production, Value ($), Price and Gross Margin (2014-2019) Table Japan Automotive Pump Production, Value ($), Price and Gross Margin (2014-2019) Table Middle East & Africa Automotive Pump Production, Value ($), Price and Gross Margin (2014-2019) Table India Automotive Pump Production, Value ($), Price and Gross Margin (2014-2019) Table South America Automotive Pump Production, Value ($), Price and Gross Margin (2014-2019) Table Global Automotive Pump Consumption by Regions (2014-2019) Figure Global Automotive Pump Consumption Share by Regions (2014-2019) Table North America Automotive Pump Production, Consumption, Export, Import (2014-2019) Table Europe Automotive Pump Production, Consumption, Export, Import (2014-2019) Table China Automotive Pump Production, Consumption, Export, Import (2014-2019) Table Japan Automotive Pump Production, Consumption, Export, Import (2014-2019) Table Middle East & Africa Automotive Pump Production, Consumption, Export, Import (2014-2019) Table India Automotive Pump Production, Consumption, Export, Import (2014-2019) Table South America Automotive Pump Production, Consumption, Export, Import (2014-2019) Figure North America Automotive Pump Production and Growth Rate Analysis Figure North America Automotive Pump Consumption and Growth Rate Analysis Figure North America Automotive Pump SWOT Analysis Figure Europe Automotive Pump Production and Growth Rate Analysis Figure Europe Automotive Pump Consumption and Growth Rate Analysis Figure Europe Automotive Pump SWOT Analysis Figure China Automotive Pump Production and Growth Rate Analysis Figure China Automotive Pump Consumption and Growth Rate Analysis Figure China Automotive Pump SWOT Analysis Figure Japan Automotive Pump Production and Growth Rate Analysis Figure Japan Automotive Pump Consumption and Growth Rate Analysis Figure Japan Automotive Pump SWOT Analysis Figure Middle East & Africa Automotive Pump Production and Growth Rate Analysis Figure Middle East & Africa Automotive Pump Consumption and Growth Rate Analysis Figure Middle East & Africa Automotive Pump SWOT Analysis Figure India Automotive Pump Production and Growth Rate Analysis Figure India Automotive Pump Consumption and Growth Rate Analysis Figure India Automotive Pump SWOT Analysis Figure South America Automotive Pump Production and Growth Rate Analysis Figure South America Automotive Pump Consumption and Growth Rate Analysis Figure South America Automotive Pump SWOT Analysis Figure Top 3 Market Share of Automotive Pump Companies Figure Top 6 Market Share of Automotive Pump Companies Table Mergers, Acquisitions and Expansion Analysis Table Company Profiles Table Product Introduction Table Robert Bosch GMBH Production, Value ($), Price, Gross Margin 2014-2019 Figure Robert Bosch GMBH Production and Growth Rate Figure Robert Bosch GMBH Value ($) Market Share 2014-2019 Figure Robert Bosch GMBH Market Share of Automotive Pump Segmented by Region in 2018 Table Company Profiles Table Product Introduction Table Magna International Inc. Production, Value ($), Price, Gross Margin 2014-2019 Figure Magna International Inc. Production and Growth Rate Figure Magna International Inc. Value ($) Market Share 2014-2019 Figure Magna International Inc. Market Share of Automotive Pump Segmented by Region in 2018 Table Company Profiles Table Product Introduction Table Melling Production, Value ($), Price, Gross Margin 2014-2019 Figure Melling Production and Growth Rate Figure Melling Value ($) Market Share 2014-2019 Figure Melling Market Share of Automotive Pump Segmented by Region in 2018 Table Company Profiles Table Product Introduction Table HYTEC Automotive Group Production, Value ($), Price, Gross Margin 2014-2019 Figure HYTEC Automotive Group Production and Growth Rate Figure HYTEC Automotive Group Value ($) Market Share 2014-2019 Figure HYTEC Automotive Group Market Share of Automotive Pump Segmented by Region in 2018 Table Company Profiles Table Product Introduction Table SHW AG Production, Value ($), Price, Gross Margin 2014-2019 Figure SHW AG Production and Growth Rate Figure SHW AG Value ($) Market Share 2014-2019 Figure SHW AG Market Share of Automotive Pump Segmented by Region in 2018 Table Company Profiles Table Product Introduction Table TRW Automotive Production, Value ($), Price, Gross Margin 2014-2019 Figure TRW Automotive Production and Growth Rate Figure TRW Automotive Value ($) Market Share 2014-2019 Figure TRW Automotive Market Share of Automotive Pump Segmented by Region in 2018 Table Company Profiles Table Product Introduction Table Gates Corporation Production, Value ($), Price, Gross Margin 2014-2019 Figure Gates Corporation Production and Growth Rate Figure Gates Corporation Value ($) Market Share 2014-2019 Figure Gates Corporation Market Share of Automotive Pump Segmented by Region in 2018 Table Company Profiles Table Product Introduction Table Aisin Seiki Co. Ltd. Production, Value ($), Price, Gross Margin 2014-2019 Figure Aisin Seiki Co. Ltd. Production and Growth Rate Figure Aisin Seiki Co. Ltd. Value ($) Market Share 2014-2019 Figure Aisin Seiki Co. Ltd. Market Share of Automotive Pump Segmented by Region in 2018 Table Company Profiles Table Product Introduction Table Denso Corporation Production, Value ($), Price, Gross Margin 2014-2019 Figure Denso Corporation Production and Growth Rate Figure Denso Corporation Value ($) Market Share 2014-2019 Figure Denso Corporation Market Share of Automotive Pump Segmented by Region in 2018 Table Company Profiles Table Product Introduction Table Delphi Automotive LLP Production, Value ($), Price, Gross Margin 2014-2019 Figure Delphi Automotive LLP Production and Growth Rate Figure Delphi Automotive LLP Value ($) Market Share 2014-2019 Figure Delphi Automotive LLP Market Share of Automotive Pump Segmented by Region in 2018 Table Company Profiles Table Product Introduction Table KSPG AG Production, Value ($), Price, Gross Margin 2014-2019 Figure KSPG AG Production and Growth Rate Figure KSPG AG Value ($) Market Share 2014-2019 Figure KSPG AG Market Share of Automotive Pump Segmented by Region in 2018 Table Company Profiles Table Product Introduction Table FTE automotive Production, Value ($), Price, Gross Margin 2014-2019 Figure FTE automotive Production and Growth Rate Figure FTE automotive Value ($) Market Share 2014-2019 Figure FTE automotive Market Share of Automotive Pump Segmented by Region in 2018 Table Company Profiles Table Product Introduction Table Mikuni Corporation Production, Value ($), Price, Gross Margin 2014-2019 Figure Mikuni Corporation Production and Growth Rate Figure Mikuni Corporation Value ($) Market Share 2014-2019 Figure Mikuni Corporation Market Share of Automotive Pump Segmented by Region in 2018 Table Company Profiles Table Product Introduction Table TI Automotive Production, Value ($), Price, Gross Margin 2014-2019 Figure TI Automotive Production and Growth Rate Figure TI Automotive Value ($) Market Share 2014-2019 Figure TI Automotive Market Share of Automotive Pump Segmented by Region in 2018 Table Company Profiles Table Product Introduction Table Johnson Electric Holding Ltd. Production, Value ($), Price, Gross Margin 2014-2019 Figure Johnson Electric Holding Ltd. Production and Growth Rate Figure Johnson Electric Holding Ltd. Value ($) Market Share 2014-2019 Figure Johnson Electric Holding Ltd. Market Share of Automotive Pump Segmented by Region in 2018 Table Global Automotive Pump Market Value ($) Forecast, by Type Table Global Automotive Pump Market Volume Forecast, by Type Figure Global Automotive Pump Market Value ($) and Growth Rate Forecast of Fuel Pump (2019-2024) Figure Global Automotive Pump Market Volume and Growth Rate Forecast of Fuel Pump (2019-2024) Figure Global Automotive Pump Market Value ($) and Growth Rate Forecast of Oil Pump (2019-2024) Figure Global Automotive Pump Market Volume and Growth Rate Forecast of Oil Pump (2019-2024) Figure Global Automotive Pump Market Value ($) and Growth Rate Forecast of Water Pump (2019-2024) Figure Global Automotive Pump Market Volume and Growth Rate Forecast of Water Pump (2019-2024) Figure Global Automotive Pump Market Value ($) and Growth Rate Forecast of Steering Pump (2019-2024) Figure Global Automotive Pump Market Volume and Growth Rate Forecast of Steering Pump (2019-2024) Figure Global Automotive Pump Market Value ($) and Growth Rate Forecast of Windshield Washer Pump (2019-2024) Figure Global Automotive Pump Market Volume and Growth Rate Forecast of Windshield Washer Pump (2019-2024) Table Global Market Value ($) Forecast by Application (2019-2024) Table Global Market Volume Forecast by Application (2019-2024) Figure Global Automotive Pump Consumption and Growth Rate of Passenger Cars (2014-2019) Figure Global Automotive Pump Consumption and Growth Rate of Light Commercial Vehicles (2014-2019) Figure Global Automotive Pump Consumption and Growth Rate of Heavy Commercial Vehicles (2014-2019) Figure Market Value ($) and Growth Rate Forecast of Heavy Commercial Vehicles (2019-2024) Figure Market Volume and Growth Rate Forecast of Heavy Commercial Vehicles (2019-2024) Figure North America Market Value ($) and Growth Rate Forecast (2019-2024) Table North America Consumption and Growth Rate Forecast (2019-2024) Figure Europe Market Value ($) and Growth Rate Forecast (2019-2024) Table Europe Consumption and Growth Rate Forecast (2019-2024) Figure China Market Value ($) and Growth Rate Forecast (2019-2024) Table China Consumption and Growth Rate Forecast (2019-2024) Figure Japan Market Value ($) and Growth Rate Forecast (2019-2024) Table Japan Consumption and Growth Rate Forecast (2019-2024) Figure Middle East & Africa Market Value ($) and Growth Rate Forecast (2019-2024) Table Middle East & Africa Consumption and Growth Rate Forecast (2019-2024) Figure India Market Value ($) and Growth Rate Forecast (2019-2024) Table India Consumption and Growth Rate Forecast (2019-2024) Figure South America Market Value ($) and Growth Rate Forecast (2019-2024) Table South America Consumption and Growth Rate Forecast (2019-2024) Figure Industry Resource/Technology/Labor Importance Analysis Table New Entrants SWOT Analysis Table New Project Analysis of Investment Recovery
Inquiry For Buying
Automotive Pump
Request Sample
Automotive Pump