Carbon and Energy Software Market Size, Share, and Trends Analysis Report
CAGR :

| Market Size 2023 (Base Year) | USD 1261.04 Million |
| Market Size 2032 (Forecast Year) | USD 2997.89 Million |
| CAGR | 10.1% |
| Forecast Period | 2024 - 2032 |
| Historical Period | 2018 - 2023 |
Carbon and Energy Software Market Insights
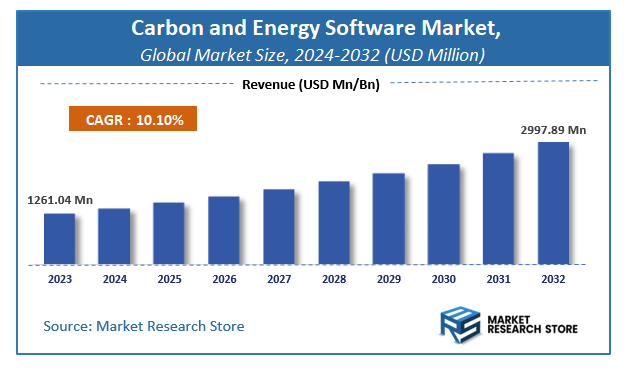
As per the published report by Market Research Store, the Global Carbon and Energy Software Market size was estimated at USD 1261.04 Million in 2023 and is anticipated to reach reach USD 2997.89 Million by 2032, growing at a projected CAGR of 10.1% during the forecast period 2024-2032. The report provides a detailed analysis of the global Carbon and Energy Software Market, including market trends, market dynamics, and market opportunities during the forecast period (2024-2032). It delves deeper into several market facets, such as market definition, size, growth, forecast, segmentation, competitive analysis, growth drivers, restraints, financial analysis, SWOT analysis, PORTER’s five force analysis, PESTEL analysis, market share analysis, cost-benefit analysis, challenges, restraints, strategic recommendations, and market players.
Carbon and Energy Software Market: Overview
The growth of the carbon and energy software market is fueled by rising global demand across various industries and applications. The report highlights lucrative opportunities, analyzing cost structures, key segments, emerging trends, regional dynamics, and advancements by leading players to provide comprehensive market insights. The carbon and energy software market report offers a detailed industry analysis from 2024 to 2032, combining quantitative and qualitative insights. It examines key factors such as pricing, market penetration, GDP impact, industry dynamics, major players, consumer behavior, and socio-economic conditions. Structured into multiple sections, the report provides a comprehensive perspective on the market from all angles.
Key sections of the carbon and energy software market report include market segments, outlook, competitive landscape, and company profiles. Market Segments offer in-depth details based on Deployment Model, Solution Type, Industry Vertical, Functional Area, End-user, and other relevant classifications to support strategic marketing initiatives. Market Outlook thoroughly analyzes market trends, growth drivers, restraints, opportunities, challenges, Porter’s Five Forces framework, macroeconomic factors, value chain analysis, and pricing trends shaping the market now and in the future. The Competitive Landscape and Company Profiles section highlights major players, their strategies, and market positioning to guide investment and business decisions. The report also identifies innovation trends, new business opportunities, and investment prospects for the forecast period.
Key Highlights:
- As per the analysis shared by our research analyst, the global carbon and energy software market is estimated to grow annually at a CAGR of around 10.1% over the forecast period (2024-2032).
- In terms of revenue, the global carbon and energy software market size was valued at around USD 1261.04 Million in 2023 and is projected to reach USD 2997.89 Million by 2032.
- The market is projected to grow at a significant rate due to growing corporate sustainability goals, regulatory compliance requirements, and increasing focus on energy efficiency.
- Based on the Deployment Model, the Cloud-based segment is growing at a high rate and will continue to dominate the global market as per industry projections.
- On the basis of Solution Type, the Carbon Management Software segment is anticipated to command the largest market share.
- In terms of Industry Vertical, the Energy and Utilities segment is projected to lead the global market.
- By Functional Area, the Compliance and Regulatory Management segment is predicted to dominate the global market.
- Based on the End-user, the Large Enterprises segment is expected to swipe the largest market share.
- Based on region, North America is projected to dominate the global market during the forecast period.
Carbon and Energy Software Market: Report Scope
This report thoroughly analyzes the carbon and energy software market, exploring its historical trends, current state, and future projections. The market estimates presented result from a robust research methodology, incorporating primary research, secondary sources, and expert opinions. These estimates are influenced by the prevailing market dynamics as well as key economic, social, and political factors. Furthermore, the report considers the impact of regulations, government expenditures, and advancements in research and development on the market. Both positive and negative shifts are evaluated to ensure a comprehensive and accurate market outlook.
| Report Attributes | Report Details |
|---|---|
| Report Name | Carbon and Energy Software Market |
| Market Size in 2023 | USD 1261.04 Million |
| Market Forecast in 2032 | USD 2997.89 Million |
| Growth Rate | CAGR of 10.1% |
| Number of Pages | 173 |
| Key Companies Covered | Enviance, IBM, CA Technologies, ACCUVIO, SAP, Carbon Clear, Enablon, Verisae, Schneider Electric |
| Segments Covered | By Deployment Model, By Solution Type, By Industry Vertical, By Functional Area, By End-user, and By Region |
| Regions Covered | North America, Europe, Asia Pacific (APAC), Latin America, Middle East, and Africa (MEA) |
| Base Year | 2023 |
| Historical Year | 2018 to 2023 |
| Forecast Year | 2024 to 2032 |
| Customization Scope | Avail customized purchase options to meet your exact research needs. Request For Customization |
Carbon and Energy Software Market: Dynamics
Key Growth Drivers
The escalating global focus on sustainability, driven by increasing awareness of climate change and stricter environmental regulations, is a primary driver for the carbon and energy software market. Governments and corporations worldwide are setting ambitious emission reduction targets and implementing policies that necessitate the tracking, management, and reporting of carbon emissions and energy consumption. The growing pressure from investors, stakeholders, and consumers for greater transparency and accountability regarding environmental performance is also compelling organizations to adopt software solutions for carbon accounting and energy management. Furthermore, the increasing adoption of renewable energy sources and the need to optimize energy usage to reduce costs are driving the demand for software tools that can monitor and analyze energy data, facilitate energy procurement, and support the transition to cleaner energy. The digitization of energy infrastructure and the availability of real-time data through smart grids and IoT devices further enable the effective use of carbon and energy software.
Restraints
One of the significant restraints in the carbon and energy software market is the complexity and lack of standardization in carbon accounting methodologies and reporting frameworks across different regions and industries. This can create challenges for organizations in selecting and implementing software solutions that meet diverse regulatory requirements and stakeholder expectations. The high upfront costs associated with implementing comprehensive carbon and energy management software, as well as the ongoing costs of maintenance and updates, can be a barrier for smaller organizations or those with limited IT budgets. The need for specialized expertise to effectively utilize these software tools and interpret the generated data can also hinder adoption, particularly if organizations lack in-house sustainability or energy management teams. Concerns about data security and privacy related to the collection and storage of sensitive energy and emissions data can also act as a restraint. Furthermore, the integration of carbon and energy software with existing enterprise resource planning (ERP) and other operational systems can be complex and time-consuming.
Opportunities
The increasing sophistication of data analytics and artificial intelligence (AI) presents significant opportunities for the carbon and energy software market. AI-powered solutions can provide advanced insights into energy consumption patterns, identify opportunities for optimization, and forecast future emissions. The growing adoption of cloud-based software delivery models offers scalability, flexibility, and cost-effectiveness, making advanced carbon and energy management tools more accessible to a wider range of organizations. The development of industry-specific software solutions that cater to the unique needs and reporting requirements of different sectors, such as manufacturing, transportation, and energy production, can enhance the value proposition and drive adoption. The integration of carbon accounting and energy management functionalities with other sustainability-focused software, such as environmental, social, and governance (ESG) reporting platforms, presents opportunities for comprehensive sustainability management solutions. Furthermore, the increasing focus on scope 3 emissions (indirect emissions in the value chain) is creating demand for software solutions that can help organizations track and engage with their suppliers and customers on carbon reduction initiatives.
Challenges
Ensuring the accuracy and reliability of carbon and energy data used by software solutions is a critical challenge. Organizations need robust data collection processes and validation mechanisms to generate credible reports and make informed decisions. Keeping pace with the rapidly evolving regulatory landscape and the emergence of new carbon accounting standards requires continuous updates and adaptability of the software. Addressing the interoperability challenges between different software platforms and data formats is crucial for seamless data exchange and integration. Educating organizations about the benefits of carbon and energy software and demonstrating a clear return on investment can be challenging, particularly for those that are new to sustainability initiatives. The potential for greenwashing or the misuse of software to present a misleading picture of environmental performance needs to be addressed through robust verification and transparency mechanisms. Furthermore, the need for user-friendly interfaces and intuitive dashboards to enable effective engagement and decision-making by non-technical users remains a key challenge for software developers.
Carbon and Energy Software Market: Segmentation Insights
The global carbon and energy software market is segmented based on Deployment Model, Solution Type, Industry Vertical, Functional Area, End-user, and Region. All the segments of the carbon and energy software market have been analyzed based on present & future trends and the market is estimated from 2024 to 2032.
Based on Deployment Model, the global carbon and energy software market is divided into Cloud-based, On-premise, Hybrid.
On the basis of Solution Type, the global carbon and energy software market is bifurcated into Carbon Management Software, Energy Management Software, Analytics and Reporting Tools, Compliance Management Software.
In terms of Industry Vertical, the global carbon and energy software market is categorized into Energy and Utilities, Manufacturing, Transportation and Logistics, Commercial Buildings, Agriculture, Telecommunications.
Based on Functional Area, the global carbon and energy software market is split into Compliance and Regulatory Management, Data Management and Analysis, Performance Monitoring, Sustainability Reporting, Risk Management.
By End-user, the global carbon and energy software market is divided into Large Enterprises, Small and Medium-sized Enterprises (SMEs), Government Agencies, Non-Governmental Organizations (NGOs).
Carbon and Energy Software Market: Regional Insights
The Carbon and Energy Software Market is experiencing rapid expansion, with North America dominating the global landscape. This leadership is driven by stringent environmental regulations, corporate sustainability mandates, and high adoption of ESG (Environmental, Social, and Governance) initiatives in the U.S. and Canada. North America benefits from advanced technological infrastructure, the presence of major software providers, and increasing demand for real-time carbon footprint tracking across industries like manufacturing, energy, and transportation. Europe follows closely, supported by the EU’s aggressive carbon neutrality goals and policies like the Green Deal, particularly in Germany, France, and the UK. Meanwhile, the Asia-Pacific region is projected to grow at the fastest CAGR, fueled by industrialization, renewable energy investments, and emerging carbon pricing mechanisms in China, Japan, and Australia. However, North America retains the largest market share (over 40%), owing to early adoption of AI-driven analytics, cloud-based energy management platforms, and stringent corporate disclosure requirements. The region’s dominance is further reinforced by partnerships between tech firms and sustainability consultancies to deliver integrated decarbonization solutions. With global net-zero targets accelerating, North America’s carbon and energy software market is poised to maintain its lead through 2030.
Carbon and Energy Software Market: Competitive Landscape
The carbon and energy software market Report offers a thorough analysis of both established and emerging players within the market. It includes a detailed list of key companies, categorized based on the types of products they offer and other relevant factors. The report also highlights the market entry year for each player, providing further context for the research analysis.
The "Global Carbon and Energy Software Market" study offers valuable insights, focusing on the global market landscape, with an emphasis on major industry players such as;
- Enviance
- IBM
- CA Technologies
- ACCUVIO
- SAP
- Carbon Clear
- Enablon
- Verisae
- Schneider Electric
The Global Carbon and Energy Software Market is Segmented as Follows:
By Deployment Model
- Cloud-based
- On-premise
- Hybrid
By Solution Type
- Carbon Management Software
- Energy Management Software
- Analytics and Reporting Tools
- Compliance Management Software
By Industry Vertical
- Energy and Utilities
- Manufacturing
- Transportation and Logistics
- Commercial Buildings
- Agriculture
- Telecommunications
By Functional Area
- Compliance and Regulatory Management
- Data Management and Analysis
- Performance Monitoring
- Sustainability Reporting
- Risk Management
By End-user
- Large Enterprises
- Small and Medium-sized Enterprises (SMEs)
- Government Agencies
- Non-Governmental Organizations (NGOs)
By Region
- North America
- The U.S.
- Canada
- Mexico
- Europe
- France
- The UK
- Spain
- Germany
- Italy
- Rest of Europe
- Asia Pacific
- China
- Japan
- India
- Australia
- South Korea
- Rest of Asia Pacific
- The Middle East & Africa
- Saudi Arabia
- UAE
- Egypt
- Kuwait
- South Africa
- Rest of the Middle East & Africa
- Latin America
- Brazil
- Argentina
- Rest of Latin America
Market Evolution
This section evaluates the market position of the product or service by examining its development pathway and competitive dynamics. It provides a detailed overview of the product's growth stages, including the early (historical) phase, the mid-stage, and anticipated future advancements influenced by innovation and emerging technologies.
Porter’s Analysis
Porter’s Five Forces framework offers a strategic lens for assessing competitor behavior and the positioning of key players in the carbon and energy software industry. This section explores the external factors shaping competitive dynamics and influencing market strategies in the years ahead. The analysis focuses on five critical forces:
- Competitive Rivalry
- Threat of New Entrants
- Threat of Substitutes
- Supplier Bargaining Power
- Buyer Bargaining Power
Value Chain & Market Attractiveness Analysis
The value chain analysis helps businesses optimize operations by mapping the product flow from suppliers to end consumers, identifying opportunities to streamline processes and gain a competitive edge. Segment-wise market attractiveness analysis evaluates key dimensions like product categories, demographics, and regions, assessing growth potential, market size, and profitability. This enables businesses to focus resources on high-potential segments for better ROI and long-term value.
PESTEL Analysis
PESTEL analysis is a powerful tool in market research reports that enhances market understanding by systematically examining the external macro-environmental factors influencing a business or industry. The acronym stands for Political, Economic, Social, Technological, Environmental, and Legal factors. By evaluating these dimensions, PESTEL analysis provides a comprehensive overview of the broader context within which a market operates, helping businesses identify potential opportunities and threats.
- Political factors assess government policies, stability, trade regulations, and political risks that could impact market operations.
- Economic factors examine variables like inflation, exchange rates, economic growth, and consumer spending power to determine market viability.
- Social factors explore cultural trends, demographics, and lifestyle changes that shape consumer behavior and preferences.
- Technological factors evaluate innovation, R&D, and technological advancements affecting product development and operational efficiencies.
- Environmental factors focus on sustainability, climate change impacts, and eco-friendly practices shaping market trends.
- Legal factors address compliance requirements, industry regulations, and intellectual property laws impacting market entry and operations.
Import-Export Analysis & Pricing Analysis
An import-export analysis is vital for market research, revealing global trade dynamics, trends, and opportunities. It examines trade volumes, product categories, and regional competitiveness, offering insights into supply chains and market demand. This section also analyzes past and future pricing trends, helping businesses optimize strategies and enabling consumers to assess product value effectively.
Carbon and Energy Software Market: Company Profiles
The report identifies key players in the carbon and energy software market through a competitive landscape and company profiles, evaluating their offerings, financial performance, strategies, and market positioning. It includes a SWOT analysis of the top 3-5 companies, assessing strengths, weaknesses, opportunities, and threats. The competitive landscape highlights rankings, recent activities (mergers, acquisitions, partnerships, product launches), and regional footprints using the Ace matrix. Customization is available to meet client-specific needs.
Regional & Industry Footprint
This section details the geographic reach, sales networks, and market penetration of companies profiled in the carbon and energy software report, showcasing their operations and distribution across regions. It analyzes the alignment of companies with specific industry verticals, highlighting the industries they serve and the scope of their products and services within those sectors.
Ace Matrix
This section categorizes companies into four distinct groups—Active, Cutting Edge, Innovator, and Emerging—based on their product and business strategies. The evaluation of product strategy focuses on aspects such as the range and depth of offerings, commitment to innovation, product functionalities, and scalability. Key elements like global reach, sector coverage, strategic acquisitions, and long-term growth plans are considered for business strategy. This analysis provides a detailed view of companies' position within the market and highlights their potential for future growth and development.
Research Methodology
The qualitative and quantitative insights for the carbon and energy software market are derived through a multi-faceted research approach, combining input from subject matter experts, primary research, and secondary data sources. Primary research includes gathering critical information via face-to-face or telephonic interviews, surveys, questionnaires, and feedback from industry professionals, key opinion leaders (KOLs), and customers. Regular interviews with industry experts are conducted to deepen the analysis and reinforce the existing data, ensuring a robust and well-rounded market understanding.
Secondary research for this report was carried out by the Market Research Store team, drawing on a variety of authoritative sources, such as:
- Official company websites, annual reports, financial statements, investor presentations, and SEC filings
- Internal and external proprietary databases, as well as relevant patent and regulatory databases
- Government publications, national statistical databases, and industry-specific market reports
- Media coverage, including news articles, press releases, and webcasts about market participants
- Paid industry databases for detailed market insights
Market Research Store conducted in-depth consultations with various key opinion leaders in the industry, including senior executives from top companies and regional leaders from end-user organizations. This effort aimed to gather critical insights on factors such as the market share of dominant brands in specific countries and regions, along with pricing strategies for products and services.
To determine total sales data, the research team conducted primary interviews across multiple countries with influential stakeholders, including:
- Distributors
- Marketing, Brand, and Product Managers
- Procurement and Production Managers
- Sales and Regional Sales Managers, Country Managers
- Technical Specialists
- C-Level Executives
These subject matter experts, with their extensive industry experience, helped validate and refine the findings. For secondary research, data were sourced from a wide range of materials, including online resources, company annual reports, industry publications, research papers, association reports, and government websites. These various sources provide a comprehensive and well-rounded perspective on the market.
Frequently Asked Questions
Table Of Content
Table of Content 1 Report Overview 1.1 Study Scope 1.2 Key Market Segments 1.3 Regulatory Scenario by Region/Country 1.4 Market Investment Scenario Strategic 1.5 Market Analysis by Type 1.5.1 Global Carbon and Energy Software Market Share by Type (2020-2026) 1.5.2 On-premise 1.5.3 Cloud-based 1.6 Market by Application 1.6.1 Global Carbon and Energy Software Market Share by Application (2020-2026) 1.6.2 Power & utilities 1.6.3 Industrial 1.6.4 Enterprise 1.6.5 Oil & Gas 1.7 Carbon and Energy Software Industry Development Trends under COVID-19 Outbreak 1.7.1 Global COVID-19 Status Overview 1.7.2 Influence of COVID-19 Outbreak on Carbon and Energy Software Industry Development 2. Global Market Growth Trends 2.1 Industry Trends 2.1.1 SWOT Analysis 2.1.2 Porter’s Five Forces Analysis 2.2 Potential Market and Growth Potential Analysis 2.3 Industry News and Policies by Regions 2.3.1 Industry News 2.3.2 Industry Policies 2.4 Industry Trends Under COVID-19 3 Value Chain of Carbon and Energy Software Market 3.1 Value Chain Status 3.2 Carbon and Energy Software Manufacturing Cost Structure Analysis 3.2.1 Production Process Analysis 3.2.2 Manufacturing Cost Structure of Carbon and Energy Software 3.2.3 Labor Cost of Carbon and Energy Software 3.2.3.1 Labor Cost of Carbon and Energy Software Under COVID-19 3.3 Sales and Marketing Model Analysis 3.4 Downstream Major Customer Analysis (by Region) 3.5 Value Chain Status Under COVID-19 4 Players Profiles 4.1 Enviance 4.1.1 Enviance Basic Information 4.1.2 Carbon and Energy Software Product Profiles, Application and Specification 4.1.3 Enviance Carbon and Energy Software Market Performance (2015-2020) 4.1.4 Enviance Business Overview 4.2 IBM 4.2.1 IBM Basic Information 4.2.2 Carbon and Energy Software Product Profiles, Application and Specification 4.2.3 IBM Carbon and Energy Software Market Performance (2015-2020) 4.2.4 IBM Business Overview 4.3 CA Technologies 4.3.1 CA Technologies Basic Information 4.3.2 Carbon and Energy Software Product Profiles, Application and Specification 4.3.3 CA Technologies Carbon and Energy Software Market Performance (2015-2020) 4.3.4 CA Technologies Business Overview 4.4 ACCUVIO 4.4.1 ACCUVIO Basic Information 4.4.2 Carbon and Energy Software Product Profiles, Application and Specification 4.4.3 ACCUVIO Carbon and Energy Software Market Performance (2015-2020) 4.4.4 ACCUVIO Business Overview 4.5 SAP 4.5.1 SAP Basic Information 4.5.2 Carbon and Energy Software Product Profiles, Application and Specification 4.5.3 SAP Carbon and Energy Software Market Performance (2015-2020) 4.5.4 SAP Business Overview 4.6 Carbon Clear 4.6.1 Carbon Clear Basic Information 4.6.2 Carbon and Energy Software Product Profiles, Application and Specification 4.6.3 Carbon Clear Carbon and Energy Software Market Performance (2015-2020) 4.6.4 Carbon Clear Business Overview 4.7 Enablon 4.7.1 Enablon Basic Information 4.7.2 Carbon and Energy Software Product Profiles, Application and Specification 4.7.3 Enablon Carbon and Energy Software Market Performance (2015-2020) 4.7.4 Enablon Business Overview 4.8 Verisae 4.8.1 Verisae Basic Information 4.8.2 Carbon and Energy Software Product Profiles, Application and Specification 4.8.3 Verisae Carbon and Energy Software Market Performance (2015-2020) 4.8.4 Verisae Business Overview 4.9 Schneider Electric 4.9.1 Schneider Electric Basic Information 4.9.2 Carbon and Energy Software Product Profiles, Application and Specification 4.9.3 Schneider Electric Carbon and Energy Software Market Performance (2015-2020) 4.9.4 Schneider Electric Business Overview 5 Global Carbon and Energy Software Market Analysis by Regions 5.1 Global Carbon and Energy Software Sales, Revenue and Market Share by Regions 5.1.1 Global Carbon and Energy Software Sales by Regions (2015-2020) 5.1.2 Global Carbon and Energy Software Revenue by Regions (2015-2020) 5.2 North America Carbon and Energy Software Sales and Growth Rate (2015-2020) 5.3 Europe Carbon and Energy Software Sales and Growth Rate (2015-2020) 5.4 Asia-Pacific Carbon and Energy Software Sales and Growth Rate (2015-2020) 5.5 Middle East and Africa Carbon and Energy Software Sales and Growth Rate (2015-2020) 5.6 South America Carbon and Energy Software Sales and Growth Rate (2015-2020) 6 North America Carbon and Energy Software Market Analysis by Countries 6.1 North America Carbon and Energy Software Sales, Revenue and Market Share by Countries 6.1.1 North America Carbon and Energy Software Sales by Countries (2015-2020) 6.1.2 North America Carbon and Energy Software Revenue by Countries (2015-2020) 6.1.3 North America Carbon and Energy Software Market Under COVID-19 6.2 United States Carbon and Energy Software Sales and Growth Rate (2015-2020) 6.2.1 United States Carbon and Energy Software Market Under COVID-19 6.3 Canada Carbon and Energy Software Sales and Growth Rate (2015-2020) 6.4 Mexico Carbon and Energy Software Sales and Growth Rate (2015-2020) 7 Europe Carbon and Energy Software Market Analysis by Countries 7.1 Europe Carbon and Energy Software Sales, Revenue and Market Share by Countries 7.1.1 Europe Carbon and Energy Software Sales by Countries (2015-2020) 7.1.2 Europe Carbon and Energy Software Revenue by Countries (2015-2020) 7.1.3 Europe Carbon and Energy Software Market Under COVID-19 7.2 Germany Carbon and Energy Software Sales and Growth Rate (2015-2020) 7.2.1 Germany Carbon and Energy Software Market Under COVID-19 7.3 UK Carbon and Energy Software Sales and Growth Rate (2015-2020) 7.3.1 UK Carbon and Energy Software Market Under COVID-19 7.4 France Carbon and Energy Software Sales and Growth Rate (2015-2020) 7.4.1 France Carbon and Energy Software Market Under COVID-19 7.5 Italy Carbon and Energy Software Sales and Growth Rate (2015-2020) 7.5.1 Italy Carbon and Energy Software Market Under COVID-19 7.6 Spain Carbon and Energy Software Sales and Growth Rate (2015-2020) 7.6.1 Spain Carbon and Energy Software Market Under COVID-19 7.7 Russia Carbon and Energy Software Sales and Growth Rate (2015-2020) 7.7.1 Russia Carbon and Energy Software Market Under COVID-19 8 Asia-Pacific Carbon and Energy Software Market Analysis by Countries 8.1 Asia-Pacific Carbon and Energy Software Sales, Revenue and Market Share by Countries 8.1.1 Asia-Pacific Carbon and Energy Software Sales by Countries (2015-2020) 8.1.2 Asia-Pacific Carbon and Energy Software Revenue by Countries (2015-2020) 8.1.3 Asia-Pacific Carbon and Energy Software Market Under COVID-19 8.2 China Carbon and Energy Software Sales and Growth Rate (2015-2020) 8.2.1 China Carbon and Energy Software Market Under COVID-19 8.3 Japan Carbon and Energy Software Sales and Growth Rate (2015-2020) 8.3.1 Japan Carbon and Energy Software Market Under COVID-19 8.4 South Korea Carbon and Energy Software Sales and Growth Rate (2015-2020) 8.4.1 South Korea Carbon and Energy Software Market Under COVID-19 8.5 Australia Carbon and Energy Software Sales and Growth Rate (2015-2020) 8.6 India Carbon and Energy Software Sales and Growth Rate (2015-2020) 8.6.1 India Carbon and Energy Software Market Under COVID-19 8.7 Southeast Asia Carbon and Energy Software Sales and Growth Rate (2015-2020) 8.7.1 Southeast Asia Carbon and Energy Software Market Under COVID-19 9 Middle East and Africa Carbon and Energy Software Market Analysis by Countries 9.1 Middle East and Africa Carbon and Energy Software Sales, Revenue and Market Share by Countries 9.1.1 Middle East and Africa Carbon and Energy Software Sales by Countries (2015-2020) 9.1.2 Middle East and Africa Carbon and Energy Software Revenue by Countries (2015-2020) 9.1.3 Middle East and Africa Carbon and Energy Software Market Under COVID-19 9.2 Saudi Arabia Carbon and Energy Software Sales and Growth Rate (2015-2020) 9.3 UAE Carbon and Energy Software Sales and Growth Rate (2015-2020) 9.4 Egypt Carbon and Energy Software Sales and Growth Rate (2015-2020) 9.5 Nigeria Carbon and Energy Software Sales and Growth Rate (2015-2020) 9.6 South Africa Carbon and Energy Software Sales and Growth Rate (2015-2020) 10 South America Carbon and Energy Software Market Analysis by Countries 10.1 South America Carbon and Energy Software Sales, Revenue and Market Share by Countries 10.1.1 South America Carbon and Energy Software Sales by Countries (2015-2020) 10.1.2 South America Carbon and Energy Software Revenue by Countries (2015-2020) 10.1.3 South America Carbon and Energy Software Market Under COVID-19 10.2 Brazil Carbon and Energy Software Sales and Growth Rate (2015-2020) 10.2.1 Brazil Carbon and Energy Software Market Under COVID-19 10.3 Argentina Carbon and Energy Software Sales and Growth Rate (2015-2020) 10.4 Columbia Carbon and Energy Software Sales and Growth Rate (2015-2020) 10.5 Chile Carbon and Energy Software Sales and Growth Rate (2015-2020) 11 Global Carbon and Energy Software Market Segment by Types 11.1 Global Carbon and Energy Software Sales, Revenue and Market Share by Types (2015-2020) 11.1.1 Global Carbon and Energy Software Sales and Market Share by Types (2015-2020) 11.1.2 Global Carbon and Energy Software Revenue and Market Share by Types (2015-2020) 11.2 On-premise Sales and Price (2015-2020) 11.3 Cloud-based Sales and Price (2015-2020) 12 Global Carbon and Energy Software Market Segment by Applications 12.1 Global Carbon and Energy Software Sales, Revenue and Market Share by Applications (2015-2020) 12.1.1 Global Carbon and Energy Software Sales and Market Share by Applications (2015-2020) 12.1.2 Global Carbon and Energy Software Revenue and Market Share by Applications (2015-2020) 12.2 Power & utilities Sales, Revenue and Growth Rate (2015-2020) 12.3 Industrial Sales, Revenue and Growth Rate (2015-2020) 12.4 Enterprise Sales, Revenue and Growth Rate (2015-2020) 12.5 Oil & Gas Sales, Revenue and Growth Rate (2015-2020) 13 Carbon and Energy Software Market Forecast by Regions (2020-2026) 13.1 Global Carbon and Energy Software Sales, Revenue and Growth Rate (2020-2026) 13.2 Carbon and Energy Software Market Forecast by Regions (2020-2026) 13.2.1 North America Carbon and Energy Software Market Forecast (2020-2026) 13.2.2 Europe Carbon and Energy Software Market Forecast (2020-2026) 13.2.3 Asia-Pacific Carbon and Energy Software Market Forecast (2020-2026) 13.2.4 Middle East and Africa Carbon and Energy Software Market Forecast (2020-2026) 13.2.5 South America Carbon and Energy Software Market Forecast (2020-2026) 13.3 Carbon and Energy Software Market Forecast by Types (2020-2026) 13.4 Carbon and Energy Software Market Forecast by Applications (2020-2026) 13.5 Carbon and Energy Software Market Forecast Under COVID-19 14 Appendix 14.1 Methodology 14.2 Research Data Source
Inquiry For Buying
Carbon and Energy Software
Request Sample
Carbon and Energy Software