Computer Components Market Size, Share, and Trends Analysis Report
CAGR :

| Market Size 2023 (Base Year) | USD 528.13 Billion |
| Market Size 2032 (Forecast Year) | USD 862.41 Billion |
| CAGR | 5.6% |
| Forecast Period | 2024 - 2032 |
| Historical Period | 2018 - 2023 |
Computer Components Market Insights
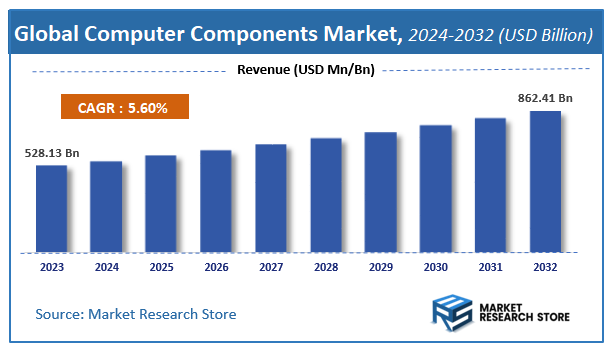
As per the published report by Market Research Store, the Global Computer Components Market size was estimated at USD 528.13 Billion in 2023 and is anticipated to reach reach USD 862.41 Billion by 2032, growing at a projected CAGR of 5.6% during the forecast period 2024-2032. The report provides a detailed analysis of the global Computer Components Market, including market trends, market dynamics, and market opportunities during the forecast period (2024-2032). It delves deeper into several market facets, such as market definition, size, growth, forecast, segmentation, competitive analysis, growth drivers, restraints, financial analysis, SWOT analysis, PORTER’s five force analysis, PESTEL analysis, market share analysis, cost-benefit analysis, challenges, restraints, strategic recommendations, and market players.
Computer Components Market: Overview
The growth of the computer components market is fueled by rising global demand across various industries and applications. The report highlights lucrative opportunities, analyzing cost structures, key segments, emerging trends, regional dynamics, and advancements by leading players to provide comprehensive market insights. The computer components market report offers a detailed industry analysis from 2024 to 2032, combining quantitative and qualitative insights. It examines key factors such as pricing, market penetration, GDP impact, industry dynamics, major players, consumer behavior, and socio-economic conditions. Structured into multiple sections, the report provides a comprehensive perspective on the market from all angles.
Key sections of the computer components market report include market segments, outlook, competitive landscape, and company profiles. Market Segments offer in-depth details based on Processor, Graphics Processing Unit, Storage Devices, Motherboards, Memory, and other relevant classifications to support strategic marketing initiatives. Market Outlook thoroughly analyzes market trends, growth drivers, restraints, opportunities, challenges, Porter’s Five Forces framework, macroeconomic factors, value chain analysis, and pricing trends shaping the market now and in the future. The Competitive Landscape and Company Profiles section highlights major players, their strategies, and market positioning to guide investment and business decisions. The report also identifies innovation trends, new business opportunities, and investment prospects for the forecast period.
Key Highlights:
- As per the analysis shared by our research analyst, the global computer components market is estimated to grow annually at a CAGR of around 5.6% over the forecast period (2024-2032).
- In terms of revenue, the global computer components market size was valued at around USD 528.13 Billion in 2023 and is projected to reach USD 862.41 Billion by 2032.
- The market is projected to grow at a significant rate due to rising demand for high-performance computing, increasing adoption of AI and cloud technologies, and continuous advancements in semiconductor and hardware innovation.
- Based on the Processor, the Consumer CPUs segment is growing at a high rate and will continue to dominate the global market as per industry projections.
- On the basis of Graphics Processing Unit, the Integrated Graphics segment is anticipated to command the largest market share.
- In terms of Storage Devices, the Hard Disk Drives (HDD) segment is projected to lead the global market.
- By Motherboards, the ATX Motherboards segment is predicted to dominate the global market.
- Based on the Memory, the DDR4 RAM segment is expected to swipe the largest market share.
- Based on region, Asia-Pacific is projected to dominate the global market during the forecast period.
Computer Components Market: Report Scope
This report thoroughly analyzes the computer components market, exploring its historical trends, current state, and future projections. The market estimates presented result from a robust research methodology, incorporating primary research, secondary sources, and expert opinions. These estimates are influenced by the prevailing market dynamics as well as key economic, social, and political factors. Furthermore, the report considers the impact of regulations, government expenditures, and advancements in research and development on the market. Both positive and negative shifts are evaluated to ensure a comprehensive and accurate market outlook.
| Report Attributes | Report Details |
|---|---|
| Report Name | Computer Components Market |
| Market Size in 2023 | USD 528.13 Billion |
| Market Forecast in 2032 | USD 862.41 Billion |
| Growth Rate | CAGR of 5.6% |
| Number of Pages | 194 |
| Key Companies Covered | Averatec, CHIMEI, Chunghwa, Elo, eMachines, Fujitsu |
| Segments Covered | By Processor, By Graphics Processing Unit, By Storage Devices, By Motherboards, By Memory, and By Region |
| Regions Covered | North America, Europe, Asia Pacific (APAC), Latin America, Middle East, and Africa (MEA) |
| Base Year | 2023 |
| Historical Year | 2018 to 2023 |
| Forecast Year | 2024 to 2032 |
| Customization Scope | Avail customized purchase options to meet your exact research needs. Request For Customization |
Computer Components Market: Dynamics
Key Growth Drivers:
The computer components market is experiencing continuous evolution, driven by the ever-increasing demand for high-performance computing across various sectors. The gaming industry, with its appetite for powerful GPUs and CPUs, is a major driver. The rise of artificial intelligence (AI) and machine learning (ML) applications necessitates advanced processors and memory. Furthermore, the growing adoption of cloud computing and data centers fuels demand for server-grade components. The increasing use of computers in professional fields like video editing, 3D rendering, and scientific simulations also contributes to market expansion. The continuous innovation in component technology, leading to faster speeds and improved efficiency, further drives market growth.
Restraints:
A significant restraint on the computer components market is the potential for supply chain disruptions, particularly due to geopolitical tensions or manufacturing bottlenecks. The fluctuating prices of raw materials, such as silicon and rare earth metals, can impact component costs. The rapid pace of technological advancements can lead to product obsolescence and inventory management challenges. Furthermore, the potential for compatibility issues between different components and platforms can create complexities for consumers and system builders. The increasing focus on energy efficiency and the need to reduce power consumption can limit the performance of some high-end components. The competition from integrated systems and mobile devices can also affect demand for traditional PC components.
Opportunities:
The computer components market presents considerable growth opportunities by focusing on developing innovative and specialized components. The integration of AI and ML into component design can enhance performance and efficiency. The development of advanced cooling solutions and power management technologies can address the increasing power demands of high-performance computing. Furthermore, the potential for developing specialized components for emerging applications, such as quantum computing and edge computing, can create new market segments. The growing demand for high-bandwidth memory and storage solutions offers opportunities for developing advanced memory modules and SSDs. The increasing focus on sustainability can drive the development of energy-efficient and eco-friendly components. The expansion of the virtual reality (VR) and augmented reality (AR) markets offers opportunities for developing specialized GPUs and processors.
Challenges:
The computer components market faces challenges related to ensuring the reliability and compatibility of components in diverse computing environments. Developing and implementing robust quality control and testing procedures is crucial. Addressing the potential for supply chain disruptions and ensuring a stable supply of raw materials requires advanced logistics and procurement strategies. Competing with established component manufacturers and demonstrating the cost-effectiveness and performance benefits of new technologies is an ongoing challenge. Furthermore, managing the integration of diverse components and ensuring seamless data flow can be technically challenging. Building trust and credibility with consumers and system builders requires robust performance data and transparent communication. Adapting to the rapidly evolving technological landscape and ensuring compatibility with new software and hardware platforms is a continuous challenge. Providing comprehensive technical support and user guides is also a key concern.
Computer Components Market: Segmentation Insights
The global computer components market is segmented based on Processor, Graphics Processing Unit, Storage Devices, Motherboards, Memory, and Region. All the segments of the computer components market have been analyzed based on present & future trends and the market is estimated from 2024 to 2032.
Based on Processor, the global computer components market is divided into Consumer CPUs, Workstation CPUs, Embedded CPUs, Gaming CPUs, Server CPUs.
On the basis of Graphics Processing Unit, the global computer components market is bifurcated into Integrated Graphics, Dedicated Gaming GPUs, Professional GPUs, AI and Machine Learning GPUs, GPUs for Cryptocurrency Mining.
In terms of Storage Devices, the global computer components market is categorized into Hard Disk Drives (HDD), Solid State Drives (SSD), Hybrid Drives, External Storage Devices, Network Attached Storage (NAS).
Based on Motherboards, the global computer components market is split into ATX Motherboards, Micro ATX Motherboards, Mini ITX Motherboards, Gaming Motherboards, Workstation Motherboards.
By Memory, the global computer components market is divided into DDR4 RAM, DDR5 RAM, SO-DIMM RAM, ECC RAM, Gaming RAM Kits.
Computer Components Market: Regional Insights
The Asia-Pacific (APAC) region dominates the global computer components market, holding the largest market share due to its robust electronics manufacturing ecosystem, high demand for consumer electronics, and presence of major semiconductor producers. In 2023, APAC accounted for over 50% of the market revenue, driven by countries like China, Taiwan, South Korea, and Japan, which are hubs for semiconductor fabrication, PCB production, and hardware assembly. China alone contributes significantly due to its massive electronics export industry and domestic demand.
North America follows, led by the U.S., with strong R&D in advanced computing and data center infrastructure. Europe remains a key player, particularly in high-performance components. APAC is projected to maintain dominance, growing at a CAGR of 8-9% (2024-2030), supported by government initiatives in tech self-sufficiency and 5G/AI-driven demand.
Computer Components Market: Competitive Landscape
The computer components market Report offers a thorough analysis of both established and emerging players within the market. It includes a detailed list of key companies, categorized based on the types of products they offer and other relevant factors. The report also highlights the market entry year for each player, providing further context for the research analysis.
The "Global Computer Components Market" study offers valuable insights, focusing on the global market landscape, with an emphasis on major industry players such as;
- Averatec
- CHIMEI
- Chunghwa
- Elo
- eMachines
- Fujitsu
The Global Computer Components Market is Segmented as Follows:
By Processor
- Consumer CPUs
- Workstation CPUs
- Embedded CPUs
- Gaming CPUs
- Server CPUs
By Graphics Processing Unit
- Integrated Graphics
- Dedicated Gaming GPUs
- Professional GPUs
- AI and Machine Learning GPUs
- GPUs for Cryptocurrency Mining
By Storage Devices
- Hard Disk Drives (HDD)
- Solid State Drives (SSD)
- Hybrid Drives
- External Storage Devices
- Network Attached Storage (NAS)
By Motherboards
- ATX Motherboards
- Micro ATX Motherboards
- Mini ITX Motherboards
- Gaming Motherboards
- Workstation Motherboards
By Memory
- DDR4 RAM
- DDR5 RAM
- SO-DIMM RAM
- ECC RAM
- Gaming RAM Kits
By Region
- North America
- The U.S.
- Canada
- Mexico
- Europe
- France
- The UK
- Spain
- Germany
- Italy
- Rest of Europe
- Asia Pacific
- China
- Japan
- India
- Australia
- South Korea
- Rest of Asia Pacific
- The Middle East & Africa
- Saudi Arabia
- UAE
- Egypt
- Kuwait
- South Africa
- Rest of the Middle East & Africa
- Latin America
- Brazil
- Argentina
- Rest of Latin America
Market Evolution
This section evaluates the market position of the product or service by examining its development pathway and competitive dynamics. It provides a detailed overview of the product's growth stages, including the early (historical) phase, the mid-stage, and anticipated future advancements influenced by innovation and emerging technologies.
Porter’s Analysis
Porter’s Five Forces framework offers a strategic lens for assessing competitor behavior and the positioning of key players in the computer components industry. This section explores the external factors shaping competitive dynamics and influencing market strategies in the years ahead. The analysis focuses on five critical forces:
- Competitive Rivalry
- Threat of New Entrants
- Threat of Substitutes
- Supplier Bargaining Power
- Buyer Bargaining Power
Value Chain & Market Attractiveness Analysis
The value chain analysis helps businesses optimize operations by mapping the product flow from suppliers to end consumers, identifying opportunities to streamline processes and gain a competitive edge. Segment-wise market attractiveness analysis evaluates key dimensions like product categories, demographics, and regions, assessing growth potential, market size, and profitability. This enables businesses to focus resources on high-potential segments for better ROI and long-term value.
PESTEL Analysis
PESTEL analysis is a powerful tool in market research reports that enhances market understanding by systematically examining the external macro-environmental factors influencing a business or industry. The acronym stands for Political, Economic, Social, Technological, Environmental, and Legal factors. By evaluating these dimensions, PESTEL analysis provides a comprehensive overview of the broader context within which a market operates, helping businesses identify potential opportunities and threats.
- Political factors assess government policies, stability, trade regulations, and political risks that could impact market operations.
- Economic factors examine variables like inflation, exchange rates, economic growth, and consumer spending power to determine market viability.
- Social factors explore cultural trends, demographics, and lifestyle changes that shape consumer behavior and preferences.
- Technological factors evaluate innovation, R&D, and technological advancements affecting product development and operational efficiencies.
- Environmental factors focus on sustainability, climate change impacts, and eco-friendly practices shaping market trends.
- Legal factors address compliance requirements, industry regulations, and intellectual property laws impacting market entry and operations.
Import-Export Analysis & Pricing Analysis
An import-export analysis is vital for market research, revealing global trade dynamics, trends, and opportunities. It examines trade volumes, product categories, and regional competitiveness, offering insights into supply chains and market demand. This section also analyzes past and future pricing trends, helping businesses optimize strategies and enabling consumers to assess product value effectively.
Computer Components Market: Company Profiles
The report identifies key players in the computer components market through a competitive landscape and company profiles, evaluating their offerings, financial performance, strategies, and market positioning. It includes a SWOT analysis of the top 3-5 companies, assessing strengths, weaknesses, opportunities, and threats. The competitive landscape highlights rankings, recent activities (mergers, acquisitions, partnerships, product launches), and regional footprints using the Ace matrix. Customization is available to meet client-specific needs.
Regional & Industry Footprint
This section details the geographic reach, sales networks, and market penetration of companies profiled in the computer components report, showcasing their operations and distribution across regions. It analyzes the alignment of companies with specific industry verticals, highlighting the industries they serve and the scope of their products and services within those sectors.
Ace Matrix
This section categorizes companies into four distinct groups—Active, Cutting Edge, Innovator, and Emerging—based on their product and business strategies. The evaluation of product strategy focuses on aspects such as the range and depth of offerings, commitment to innovation, product functionalities, and scalability. Key elements like global reach, sector coverage, strategic acquisitions, and long-term growth plans are considered for business strategy. This analysis provides a detailed view of companies' position within the market and highlights their potential for future growth and development.
Research Methodology
The qualitative and quantitative insights for the computer components market are derived through a multi-faceted research approach, combining input from subject matter experts, primary research, and secondary data sources. Primary research includes gathering critical information via face-to-face or telephonic interviews, surveys, questionnaires, and feedback from industry professionals, key opinion leaders (KOLs), and customers. Regular interviews with industry experts are conducted to deepen the analysis and reinforce the existing data, ensuring a robust and well-rounded market understanding.
Secondary research for this report was carried out by the Market Research Store team, drawing on a variety of authoritative sources, such as:
- Official company websites, annual reports, financial statements, investor presentations, and SEC filings
- Internal and external proprietary databases, as well as relevant patent and regulatory databases
- Government publications, national statistical databases, and industry-specific market reports
- Media coverage, including news articles, press releases, and webcasts about market participants
- Paid industry databases for detailed market insights
Market Research Store conducted in-depth consultations with various key opinion leaders in the industry, including senior executives from top companies and regional leaders from end-user organizations. This effort aimed to gather critical insights on factors such as the market share of dominant brands in specific countries and regions, along with pricing strategies for products and services.
To determine total sales data, the research team conducted primary interviews across multiple countries with influential stakeholders, including:
- Distributors
- Marketing, Brand, and Product Managers
- Procurement and Production Managers
- Sales and Regional Sales Managers, Country Managers
- Technical Specialists
- C-Level Executives
These subject matter experts, with their extensive industry experience, helped validate and refine the findings. For secondary research, data were sourced from a wide range of materials, including online resources, company annual reports, industry publications, research papers, association reports, and government websites. These various sources provide a comprehensive and well-rounded perspective on the market.
Frequently Asked Questions
Table Of Content
List of Tables and Figures Figure Product Picture of Computer Components Table Product Specification of Computer Components Figure Market Concentration Ratio and Market Maturity Analysis of Computer Components Figure Global Computer Components Value ($) and Growth Rate from 2014-2024 Table Different Types of Computer Components Figure Global Computer Components Value ($) Segment by Type from 2014-2019 Figure Computer Host Picture Figure Input Device Picture Figure Output Device Picture Figure Storage Device Picture Figure Others Picture Table Different Applications of Computer Components Figure Global Computer Components Value ($) Segment by Applications from 2014-2019 Figure Residential Picture Figure Commercial Picture Figure Industrial Picture Table Research Regions of Computer Components Figure North America Computer Components Production Value ($) and Growth Rate (2014-2019) Figure Europe Computer Components Production Value ($) and Growth Rate (2014-2019) Table China Computer Components Production Value ($) and Growth Rate (2014-2019) Table Japan Computer Components Production Value ($) and Growth Rate (2014-2019) Table Middle East & Africa Computer Components Production Value ($) and Growth Rate (2014-2019) Table India Computer Components Production Value ($) and Growth Rate (2014-2019) Table South America Computer Components Production Value ($) and Growth Rate (2014-2019) Table Emerging Countries of Computer Components Table Growing Market of Computer Components Figure Industry Chain Analysis of Computer Components Table Upstream Raw Material Suppliers of Computer Components with Contact Information Table Major Players Manufacturing Base and Market Share ($) of Computer Components in 2018 Table Major Players Computer Components Product Types in 2018 Figure Production Process of Computer Components Figure Manufacturing Cost Structure of Computer Components Figure Channel Status of Computer Components Table Major Distributors of Computer Components with Contact Information Table Major Downstream Buyers of Computer Components with Contact Information Table Global Computer Components Value ($) by Type (2014-2019) Table Global Computer Components Value ($) Share by Type (2014-2019) Figure Global Computer Components Value ($) Share by Type (2014-2019) Table Global Computer Components Production by Type (2014-2019) Table Global Computer Components Production Share by Type (2014-2019) Figure Global Computer Components Production Share by Type (2014-2019) Figure Global Computer Components Value ($) and Growth Rate of Computer Host Figure Global Computer Components Value ($) and Growth Rate of Input Device Figure Global Computer Components Value ($) and Growth Rate of Output Device Figure Global Computer Components Value ($) and Growth Rate of Storage Device Figure Global Computer Components Value ($) and Growth Rate of Others Figure Global Computer Components Price by Type (2014-2019) Table Global Computer Components Consumption by Application (2014-2019) Table Global Computer Components Consumption Market Share by Application (2014-2019) Figure Global Computer Components Consumption Market Share by Application (2014-2019) Table Downstream Buyers Introduction by Application Figure Global Computer Components Consumption and Growth Rate of Residential (2014-2019) Figure Global Computer Components Consumption and Growth Rate of Commercial (2014-2019) Figure Global Computer Components Consumption and Growth Rate of Industrial (2014-2019) Table Global Computer Components Value ($) by Region (2014-2019) Table Global Computer Components Value ($) Market Share by Region (2014-2019) Figure Global Computer Components Value ($) Market Share by Region (2014-2019) Table Global Computer Components Production by Region (2014-2019) Table Global Computer Components Production Market Share by Region (2014-2019) Figure Global Computer Components Production Market Share by Region (2014-2019) Table Global Computer Components Production, Value ($), Price and Gross Margin (2014-2019) Table North America Computer Components Production, Value ($), Price and Gross Margin (2014-2019) Table Europe Computer Components Production, Value ($), Price and Gross Margin (2014-2019) Table China Computer Components Production, Value ($), Price and Gross Margin (2014-2019) Table Japan Computer Components Production, Value ($), Price and Gross Margin (2014-2019) Table Middle East & Africa Computer Components Production, Value ($), Price and Gross Margin (2014-2019) Table India Computer Components Production, Value ($), Price and Gross Margin (2014-2019) Table South America Computer Components Production, Value ($), Price and Gross Margin (2014-2019) Table Global Computer Components Consumption by Regions (2014-2019) Figure Global Computer Components Consumption Share by Regions (2014-2019) Table North America Computer Components Production, Consumption, Export, Import (2014-2019) Table Europe Computer Components Production, Consumption, Export, Import (2014-2019) Table China Computer Components Production, Consumption, Export, Import (2014-2019) Table Japan Computer Components Production, Consumption, Export, Import (2014-2019) Table Middle East & Africa Computer Components Production, Consumption, Export, Import (2014-2019) Table India Computer Components Production, Consumption, Export, Import (2014-2019) Table South America Computer Components Production, Consumption, Export, Import (2014-2019) Figure North America Computer Components Production and Growth Rate Analysis Figure North America Computer Components Consumption and Growth Rate Analysis Figure North America Computer Components SWOT Analysis Figure Europe Computer Components Production and Growth Rate Analysis Figure Europe Computer Components Consumption and Growth Rate Analysis Figure Europe Computer Components SWOT Analysis Figure China Computer Components Production and Growth Rate Analysis Figure China Computer Components Consumption and Growth Rate Analysis Figure China Computer Components SWOT Analysis Figure Japan Computer Components Production and Growth Rate Analysis Figure Japan Computer Components Consumption and Growth Rate Analysis Figure Japan Computer Components SWOT Analysis Figure Middle East & Africa Computer Components Production and Growth Rate Analysis Figure Middle East & Africa Computer Components Consumption and Growth Rate Analysis Figure Middle East & Africa Computer Components SWOT Analysis Figure India Computer Components Production and Growth Rate Analysis Figure India Computer Components Consumption and Growth Rate Analysis Figure India Computer Components SWOT Analysis Figure South America Computer Components Production and Growth Rate Analysis Figure South America Computer Components Consumption and Growth Rate Analysis Figure South America Computer Components SWOT Analysis Figure Top 3 Market Share of Computer Components Companies Figure Top 6 Market Share of Computer Components Companies Table Mergers, Acquisitions and Expansion Analysis Table Company Profiles Table Product Introduction Table Quanta Production, Value ($), Price, Gross Margin 2014-2019 Figure Quanta Production and Growth Rate Figure Quanta Value ($) Market Share 2014-2019 Figure Quanta Market Share of Computer Components Segmented by Region in 2018 Table Company Profiles Table Product Introduction Table Toshiba Production, Value ($), Price, Gross Margin 2014-2019 Figure Toshiba Production and Growth Rate Figure Toshiba Value ($) Market Share 2014-2019 Figure Toshiba Market Share of Computer Components Segmented by Region in 2018 Table Company Profiles Table Product Introduction Table Lenovo Production, Value ($), Price, Gross Margin 2014-2019 Figure Lenovo Production and Growth Rate Figure Lenovo Value ($) Market Share 2014-2019 Figure Lenovo Market Share of Computer Components Segmented by Region in 2018 Table Company Profiles Table Product Introduction Table EMachines Production, Value ($), Price, Gross Margin 2014-2019 Figure EMachines Production and Growth Rate Figure EMachines Value ($) Market Share 2014-2019 Figure EMachines Market Share of Computer Components Segmented by Region in 2018 Table Company Profiles Table Product Introduction Table Elo Production, Value ($), Price, Gross Margin 2014-2019 Figure Elo Production and Growth Rate Figure Elo Value ($) Market Share 2014-2019 Figure Elo Market Share of Computer Components Segmented by Region in 2018 Table Company Profiles Table Product Introduction Table Chunghwa Production, Value ($), Price, Gross Margin 2014-2019 Figure Chunghwa Production and Growth Rate Figure Chunghwa Value ($) Market Share 2014-2019 Figure Chunghwa Market Share of Computer Components Segmented by Region in 2018 Table Company Profiles Table Product Introduction Table Innolux Production, Value ($), Price, Gross Margin 2014-2019 Figure Innolux Production and Growth Rate Figure Innolux Value ($) Market Share 2014-2019 Figure Innolux Market Share of Computer Components Segmented by Region in 2018 Table Company Profiles Table Product Introduction Table CHIMEI Production, Value ($), Price, Gross Margin 2014-2019 Figure CHIMEI Production and Growth Rate Figure CHIMEI Value ($) Market Share 2014-2019 Figure CHIMEI Market Share of Computer Components Segmented by Region in 2018 Table Company Profiles Table Product Introduction Table Unbranded/Generic Production, Value ($), Price, Gross Margin 2014-2019 Figure Unbranded/Generic Production and Growth Rate Figure Unbranded/Generic Value ($) Market Share 2014-2019 Figure Unbranded/Generic Market Share of Computer Components Segmented by Region in 2018 Table Company Profiles Table Product Introduction Table Averatec Production, Value ($), Price, Gross Margin 2014-2019 Figure Averatec Production and Growth Rate Figure Averatec Value ($) Market Share 2014-2019 Figure Averatec Market Share of Computer Components Segmented by Region in 2018 Table Company Profiles Table Product Introduction Table LG Display Production, Value ($), Price, Gross Margin 2014-2019 Figure LG Display Production and Growth Rate Figure LG Display Value ($) Market Share 2014-2019 Figure LG Display Market Share of Computer Components Segmented by Region in 2018 Table Company Profiles Table Product Introduction Table Fujitsu Production, Value ($), Price, Gross Margin 2014-2019 Figure Fujitsu Production and Growth Rate Figure Fujitsu Value ($) Market Share 2014-2019 Figure Fujitsu Market Share of Computer Components Segmented by Region in 2018 Table Global Computer Components Market Value ($) Forecast, by Type Table Global Computer Components Market Volume Forecast, by Type Figure Global Computer Components Market Value ($) and Growth Rate Forecast of Computer Host (2019-2024) Figure Global Computer Components Market Volume and Growth Rate Forecast of Computer Host (2019-2024) Figure Global Computer Components Market Value ($) and Growth Rate Forecast of Input Device (2019-2024) Figure Global Computer Components Market Volume and Growth Rate Forecast of Input Device (2019-2024) Figure Global Computer Components Market Value ($) and Growth Rate Forecast of Output Device (2019-2024) Figure Global Computer Components Market Volume and Growth Rate Forecast of Output Device (2019-2024) Figure Global Computer Components Market Value ($) and Growth Rate Forecast of Storage Device (2019-2024) Figure Global Computer Components Market Volume and Growth Rate Forecast of Storage Device (2019-2024) Figure Global Computer Components Market Value ($) and Growth Rate Forecast of Others (2019-2024) Figure Global Computer Components Market Volume and Growth Rate Forecast of Others (2019-2024) Table Global Market Value ($) Forecast by Application (2019-2024) Table Global Market Volume Forecast by Application (2019-2024) Figure Global Computer Components Consumption and Growth Rate of Residential (2014-2019) Figure Global Computer Components Consumption and Growth Rate of Commercial (2014-2019) Figure Global Computer Components Consumption and Growth Rate of Industrial (2014-2019) Figure Market Value ($) and Growth Rate Forecast of Industrial (2019-2024) Figure Market Volume and Growth Rate Forecast of Industrial (2019-2024) Figure North America Market Value ($) and Growth Rate Forecast (2019-2024) Table North America Consumption and Growth Rate Forecast (2019-2024) Figure Europe Market Value ($) and Growth Rate Forecast (2019-2024) Table Europe Consumption and Growth Rate Forecast (2019-2024) Figure China Market Value ($) and Growth Rate Forecast (2019-2024) Table China Consumption and Growth Rate Forecast (2019-2024) Figure Japan Market Value ($) and Growth Rate Forecast (2019-2024) Table Japan Consumption and Growth Rate Forecast (2019-2024) Figure Middle East & Africa Market Value ($) and Growth Rate Forecast (2019-2024) Table Middle East & Africa Consumption and Growth Rate Forecast (2019-2024) Figure India Market Value ($) and Growth Rate Forecast (2019-2024) Table India Consumption and Growth Rate Forecast (2019-2024) Figure South America Market Value ($) and Growth Rate Forecast (2019-2024) Table South America Consumption and Growth Rate Forecast (2019-2024) Figure Industry Resource/Technology/Labor Importance Analysis Table New Entrants SWOT Analysis Table New Project Analysis of Investment Recovery
Inquiry For Buying
Computer Components
Request Sample
Computer Components