Float Level Sensors Market Size, Share, and Trends Analysis Report
CAGR :

| Market Size 2023 (Base Year) | USD 702.36 Million |
| Market Size 2032 (Forecast Year) | USD 1040.18 Million |
| CAGR | 4.46% |
| Forecast Period | 2024 - 2032 |
| Historical Period | 2018 - 2023 |
Float Level Sensors Market Insights
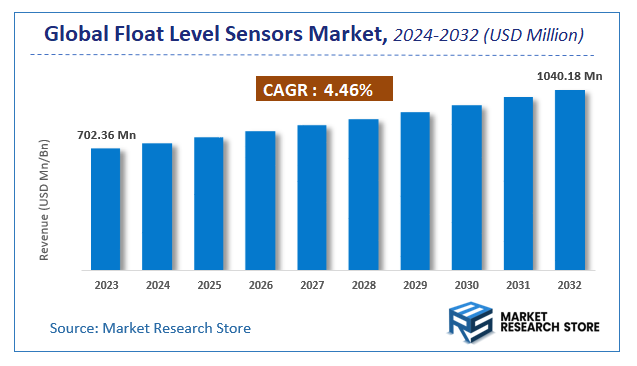
As per the published report by Market Research Store, the Global Float Level Sensors Market size was estimated at USD 702.36 Million in 2023 and is anticipated to reach reach USD 1040.18 Million by 2032, growing at a projected CAGR of 4.46% during the forecast period 2024-2032. The report provides a detailed analysis of the global Float Level Sensors Market, including market trends, market dynamics, and market opportunities during the forecast period (2024-2032). It delves deeper into several market facets, such as market definition, size, growth, forecast, segmentation, competitive analysis, growth drivers, restraints, financial analysis, SWOT analysis, PORTER’s five force analysis, PESTEL analysis, market share analysis, cost-benefit analysis, challenges, restraints, strategic recommendations, and market players.
Float Level Sensors Market: Overview
The growth of the float level sensors market is fueled by rising global demand across various industries and applications. The report highlights lucrative opportunities, analyzing cost structures, key segments, emerging trends, regional dynamics, and advancements by leading players to provide comprehensive market insights. The float level sensors market report offers a detailed industry analysis from 2024 to 2032, combining quantitative and qualitative insights. It examines key factors such as pricing, market penetration, GDP impact, industry dynamics, major players, consumer behavior, and socio-economic conditions. Structured into multiple sections, the report provides a comprehensive perspective on the market from all angles.
Key sections of the float level sensors market report include market segments, outlook, competitive landscape, and company profiles. Market Segments offer in-depth details based on Technology, Material, End-User Industry, Measurement Type, Installation Type, and other relevant classifications to support strategic marketing initiatives. Market Outlook thoroughly analyzes market trends, growth drivers, restraints, opportunities, challenges, Porter’s Five Forces framework, macroeconomic factors, value chain analysis, and pricing trends shaping the market now and in the future. The Competitive Landscape and Company Profiles section highlights major players, their strategies, and market positioning to guide investment and business decisions. The report also identifies innovation trends, new business opportunities, and investment prospects for the forecast period.
Key Highlights:
- As per the analysis shared by our research analyst, the global float level sensors market is estimated to grow annually at a CAGR of around 4.46% over the forecast period (2024-2032).
- In terms of revenue, the global float level sensors market size was valued at around USD 702.36 Million in 2023 and is projected to reach USD 1040.18 Million by 2032.
- The market is projected to grow at a significant rate due to growing demand for automated liquid level monitoring, advancements in industrial automation, and increasing applications in various industries such as oil & gas, water treatment, and automotive.
- Based on the Technology, the Magnetostrictive Level Sensors segment is growing at a high rate and will continue to dominate the global market as per industry projections.
- On the basis of Material, the Plastic Float Level Sensors segment is anticipated to command the largest market share.
- In terms of End-User Industry, the Oil and Gas segment is projected to lead the global market.
- By Measurement Type, the Continuous Level Measurement segment is predicted to dominate the global market.
- Based on the Installation Type, the Top-Mounted Float Level Sensors segment is expected to swipe the largest market share.
- Based on region, Europe is projected to dominate the global market during the forecast period.
Float Level Sensors Market: Report Scope
This report thoroughly analyzes the float level sensors market, exploring its historical trends, current state, and future projections. The market estimates presented result from a robust research methodology, incorporating primary research, secondary sources, and expert opinions. These estimates are influenced by the prevailing market dynamics as well as key economic, social, and political factors. Furthermore, the report considers the impact of regulations, government expenditures, and advancements in research and development on the market. Both positive and negative shifts are evaluated to ensure a comprehensive and accurate market outlook.
| Report Attributes | Report Details |
|---|---|
| Report Name | Float Level Sensors Market |
| Market Size in 2023 | USD 702.36 Million |
| Market Forecast in 2032 | USD 1040.18 Million |
| Growth Rate | CAGR of 4.46% |
| Number of Pages | 189 |
| Key Companies Covered | WIKA, Valcom, Gems Sensors & Controls, Gentech Inteational, FAFNIR, ABB Measurement, Barksdale, AMETEK Drexelbrook, FineTek, Dandong Top |
| Segments Covered | By Technology, By Material, By End-User Industry, By Measurement Type, By Installation Type, and By Region |
| Regions Covered | North America, Europe, Asia Pacific (APAC), Latin America, Middle East, and Africa (MEA) |
| Base Year | 2023 |
| Historical Year | 2018 to 2023 |
| Forecast Year | 2024 to 2032 |
| Customization Scope | Avail customized purchase options to meet your exact research needs. Request For Customization |
Float Level Sensors Market: Dynamics
Key Growth Drivers:
The float level sensors market is experiencing steady growth, primarily driven by the increasing demand for reliable and cost-effective liquid level monitoring in various industrial and commercial applications. The need for accurate level measurement in tanks, reservoirs, and process vessels across sectors like chemical, oil & gas, and water treatment is a significant driver. The growing adoption of automation and process control systems, which require precise level sensing, further fuels market expansion. Furthermore, the increasing focus on safety and environmental compliance, particularly in hazardous liquid storage and transportation, contributes to market growth. The expanding use of float level sensors in marine applications, such as ballast tanks and fuel tanks, also drives demand. The growing demand for simple and robust level sensing solutions in agriculture and food processing further supports market expansion.
Restraints:
A significant restraint on the float level sensors market is the potential for mechanical failures and wear and tear, particularly in harsh operating conditions or with corrosive liquids. The potential for inaccuracies and drift due to float buoyancy variations and liquid density changes can also pose challenges. The limitations of float level sensors in handling certain types of liquids, such as viscous or sticky substances, can restrict their application. Furthermore, the potential for interference from debris or obstructions in the liquid can affect sensor performance. The potential for signal noise and electrical interference in industrial environments can also limit accuracy. The competition from alternative level sensing technologies, such as ultrasonic and radar sensors, can also limit market growth.
Opportunities:
The float level sensors market presents considerable growth opportunities by focusing on developing innovative and robust sensor designs. The integration of smart technologies, such as wireless communication and remote monitoring, can enhance data accessibility and improve process control. The development of corrosion-resistant and high-temperature float level sensors can expand their application in challenging environments. Furthermore, the potential for developing compact and miniaturized float level sensors for portable and mobile applications is promising. The growing demand for low-cost and reliable level sensing solutions in developing economies offers significant growth potential. The development of customized float level sensors for specific liquid types and tank geometries can create niche markets. The increasing focus on predictive maintenance and asset monitoring can drive the adoption of smart float level sensors.
Challenges:
The float level sensors market faces challenges related to ensuring the reliability and accuracy of sensors in diverse liquid types and operating conditions. Developing and implementing robust quality control and testing procedures is crucial. Addressing the potential for mechanical failures and wear and tear requires advanced material selection and design. Competing with established level sensor manufacturers and demonstrating the cost-effectiveness and performance benefits of new designs is an ongoing challenge. Furthermore, managing the integration of smart technologies and ensuring seamless data flow can be technically challenging. Building trust and credibility with industrial customers requires robust performance data and transparent communication. Adapting to the rapidly evolving automation and digitization trends is a continuous challenge. Providing comprehensive installation guides and maintenance instructions is also a key concern.
Float Level Sensors Market: Segmentation Insights
The global float level sensors market is segmented based on Technology, Material, End-User Industry, Measurement Type, Installation Type, and Region. All the segments of the float level sensors market have been analyzed based on present & future trends and the market is estimated from 2024 to 2032.
Based on Technology, the global float level sensors market is divided into Magnetostrictive Level Sensors, Optical Level Sensors, Ultrasonic Level Sensors, Capacitive Level Sensors, Conductive Level Sensors.
On the basis of Material, the global float level sensors market is bifurcated into Plastic Float Level Sensors, Stainless Steel Float Level Sensors, Brass Float Level Sensors, Ceramic Float Level Sensors, Composite Material Float Level Sensors.
In terms of End-User Industry, the global float level sensors market is categorized into Oil and Gas, Chemical Processing, Water and Wastewater Treatment, Food and Beverage, Pharmaceuticals.
Based on Measurement Type, the global float level sensors market is split into Continuous Level Measurement, Point Level Measurement, Level Detection, Level Monitoring, Level Control.
By Installation Type, the global float level sensors market is divided into Top-Mounted Float Level Sensors, Side-Mounted Float Level Sensors, Submersible Float Level Sensors, Inline Float Level Sensors, Portable Float Level Sensors.
Float Level Sensors Market: Regional Insights
North America dominates the global float level sensors market, holding 38.2% of market share in 2024 (valued at $465 million), driven by robust industrial automation adoption and stringent liquid management regulations across U.S. oil & gas, water treatment, and chemical sectors. Europe follows with 28.5% share, led by Germany’s advanced manufacturing and the EU’s emphasis on process control efficiency.
The Asia-Pacific region is the fastest-growing market (CAGR 9.1%), fueled by China’s industrial expansion and India’s infrastructure modernization in pharmaceuticals and agriculture. Latin America and MEA show niche growth in mining and energy applications. North America’s dominance reflects its technological edge in IoT-integrated sensors and replacement demand in aging industrial infrastructure.
Float Level Sensors Market: Competitive Landscape
The float level sensors market Report offers a thorough analysis of both established and emerging players within the market. It includes a detailed list of key companies, categorized based on the types of products they offer and other relevant factors. The report also highlights the market entry year for each player, providing further context for the research analysis.
The "Global Float Level Sensors Market" study offers valuable insights, focusing on the global market landscape, with an emphasis on major industry players such as;
- WIKA
- Valcom
- Gems Sensors & Controls
- Gentech Inteational
- FAFNIR
- ABB Measurement
- Barksdale
- AMETEK Drexelbrook
- FineTek
- Dandong Top
The Global Float Level Sensors Market is Segmented as Follows:
By Technology
- Magnetostrictive Level Sensors
- Optical Level Sensors
- Ultrasonic Level Sensors
- Capacitive Level Sensors
- Conductive Level Sensors
By Material
- Plastic Float Level Sensors
- Stainless Steel Float Level Sensors
- Brass Float Level Sensors
- Ceramic Float Level Sensors
- Composite Material Float Level Sensors
By End-User Industry
- Oil and Gas
- Chemical Processing
- Water and Wastewater Treatment
- Food and Beverage
- Pharmaceuticals
By Measurement Type
- Continuous Level Measurement
- Point Level Measurement
- Level Detection
- Level Monitoring
- Level Control
By Installation Type
- Top-Mounted Float Level Sensors
- Side-Mounted Float Level Sensors
- Submersible Float Level Sensors
- Inline Float Level Sensors
- Portable Float Level Sensors
By Region
- North America
- The U.S.
- Canada
- Mexico
- Europe
- France
- The UK
- Spain
- Germany
- Italy
- Rest of Europe
- Asia Pacific
- China
- Japan
- India
- Australia
- South Korea
- Rest of Asia Pacific
- The Middle East & Africa
- Saudi Arabia
- UAE
- Egypt
- Kuwait
- South Africa
- Rest of the Middle East & Africa
- Latin America
- Brazil
- Argentina
- Rest of Latin America
Market Evolution
This section evaluates the market position of the product or service by examining its development pathway and competitive dynamics. It provides a detailed overview of the product's growth stages, including the early (historical) phase, the mid-stage, and anticipated future advancements influenced by innovation and emerging technologies.
Porter’s Analysis
Porter’s Five Forces framework offers a strategic lens for assessing competitor behavior and the positioning of key players in the float level sensors industry. This section explores the external factors shaping competitive dynamics and influencing market strategies in the years ahead. The analysis focuses on five critical forces:
- Competitive Rivalry
- Threat of New Entrants
- Threat of Substitutes
- Supplier Bargaining Power
- Buyer Bargaining Power
Value Chain & Market Attractiveness Analysis
The value chain analysis helps businesses optimize operations by mapping the product flow from suppliers to end consumers, identifying opportunities to streamline processes and gain a competitive edge. Segment-wise market attractiveness analysis evaluates key dimensions like product categories, demographics, and regions, assessing growth potential, market size, and profitability. This enables businesses to focus resources on high-potential segments for better ROI and long-term value.
PESTEL Analysis
PESTEL analysis is a powerful tool in market research reports that enhances market understanding by systematically examining the external macro-environmental factors influencing a business or industry. The acronym stands for Political, Economic, Social, Technological, Environmental, and Legal factors. By evaluating these dimensions, PESTEL analysis provides a comprehensive overview of the broader context within which a market operates, helping businesses identify potential opportunities and threats.
- Political factors assess government policies, stability, trade regulations, and political risks that could impact market operations.
- Economic factors examine variables like inflation, exchange rates, economic growth, and consumer spending power to determine market viability.
- Social factors explore cultural trends, demographics, and lifestyle changes that shape consumer behavior and preferences.
- Technological factors evaluate innovation, R&D, and technological advancements affecting product development and operational efficiencies.
- Environmental factors focus on sustainability, climate change impacts, and eco-friendly practices shaping market trends.
- Legal factors address compliance requirements, industry regulations, and intellectual property laws impacting market entry and operations.
Import-Export Analysis & Pricing Analysis
An import-export analysis is vital for market research, revealing global trade dynamics, trends, and opportunities. It examines trade volumes, product categories, and regional competitiveness, offering insights into supply chains and market demand. This section also analyzes past and future pricing trends, helping businesses optimize strategies and enabling consumers to assess product value effectively.
Float Level Sensors Market: Company Profiles
The report identifies key players in the float level sensors market through a competitive landscape and company profiles, evaluating their offerings, financial performance, strategies, and market positioning. It includes a SWOT analysis of the top 3-5 companies, assessing strengths, weaknesses, opportunities, and threats. The competitive landscape highlights rankings, recent activities (mergers, acquisitions, partnerships, product launches), and regional footprints using the Ace matrix. Customization is available to meet client-specific needs.
Regional & Industry Footprint
This section details the geographic reach, sales networks, and market penetration of companies profiled in the float level sensors report, showcasing their operations and distribution across regions. It analyzes the alignment of companies with specific industry verticals, highlighting the industries they serve and the scope of their products and services within those sectors.
Ace Matrix
This section categorizes companies into four distinct groups—Active, Cutting Edge, Innovator, and Emerging—based on their product and business strategies. The evaluation of product strategy focuses on aspects such as the range and depth of offerings, commitment to innovation, product functionalities, and scalability. Key elements like global reach, sector coverage, strategic acquisitions, and long-term growth plans are considered for business strategy. This analysis provides a detailed view of companies' position within the market and highlights their potential for future growth and development.
Research Methodology
The qualitative and quantitative insights for the float level sensors market are derived through a multi-faceted research approach, combining input from subject matter experts, primary research, and secondary data sources. Primary research includes gathering critical information via face-to-face or telephonic interviews, surveys, questionnaires, and feedback from industry professionals, key opinion leaders (KOLs), and customers. Regular interviews with industry experts are conducted to deepen the analysis and reinforce the existing data, ensuring a robust and well-rounded market understanding.
Secondary research for this report was carried out by the Market Research Store team, drawing on a variety of authoritative sources, such as:
- Official company websites, annual reports, financial statements, investor presentations, and SEC filings
- Internal and external proprietary databases, as well as relevant patent and regulatory databases
- Government publications, national statistical databases, and industry-specific market reports
- Media coverage, including news articles, press releases, and webcasts about market participants
- Paid industry databases for detailed market insights
Market Research Store conducted in-depth consultations with various key opinion leaders in the industry, including senior executives from top companies and regional leaders from end-user organizations. This effort aimed to gather critical insights on factors such as the market share of dominant brands in specific countries and regions, along with pricing strategies for products and services.
To determine total sales data, the research team conducted primary interviews across multiple countries with influential stakeholders, including:
- Distributors
- Marketing, Brand, and Product Managers
- Procurement and Production Managers
- Sales and Regional Sales Managers, Country Managers
- Technical Specialists
- C-Level Executives
These subject matter experts, with their extensive industry experience, helped validate and refine the findings. For secondary research, data were sourced from a wide range of materials, including online resources, company annual reports, industry publications, research papers, association reports, and government websites. These various sources provide a comprehensive and well-rounded perspective on the market.
Frequently Asked Questions
Table Of Content
List of Tables and Figures Figure Product Picture of Float Level Sensors Table Product Specification of Float Level Sensors Figure Market Concentration Ratio and Market Maturity Analysis of Float Level Sensors Figure Global Float Level Sensors Value ($) and Growth Rate from 2014-2024 Table Different Types of Float Level Sensors Figure Global Float Level Sensors Value ($) Segment by Type from 2014-2019 Figure Magnetic Float Level Sensors Picture Figure Mechanical Float Level Sensors Picture Figure Others Picture Table Different Applications of Float Level Sensors Figure Global Float Level Sensors Value ($) Segment by Applications from 2014-2019 Figure Petroleum Industry Picture Figure Chemical Industry Picture Figure Food Industry Picture Figure Others Picture Table Research Regions of Float Level Sensors Figure North America Float Level Sensors Production Value ($) and Growth Rate (2014-2019) Figure Europe Float Level Sensors Production Value ($) and Growth Rate (2014-2019) Table China Float Level Sensors Production Value ($) and Growth Rate (2014-2019) Table Japan Float Level Sensors Production Value ($) and Growth Rate (2014-2019) Table Middle East & Africa Float Level Sensors Production Value ($) and Growth Rate (2014-2019) Table India Float Level Sensors Production Value ($) and Growth Rate (2014-2019) Table South America Float Level Sensors Production Value ($) and Growth Rate (2014-2019) Table Emerging Countries of Float Level Sensors Table Growing Market of Float Level Sensors Figure Industry Chain Analysis of Float Level Sensors Table Upstream Raw Material Suppliers of Float Level Sensors with Contact Information Table Major Players Manufacturing Base and Market Share ($) of Float Level Sensors in 2018 Table Major Players Float Level Sensors Product Types in 2018 Figure Production Process of Float Level Sensors Figure Manufacturing Cost Structure of Float Level Sensors Figure Channel Status of Float Level Sensors Table Major Distributors of Float Level Sensors with Contact Information Table Major Downstream Buyers of Float Level Sensors with Contact Information Table Global Float Level Sensors Value ($) by Type (2014-2019) Table Global Float Level Sensors Value ($) Share by Type (2014-2019) Figure Global Float Level Sensors Value ($) Share by Type (2014-2019) Table Global Float Level Sensors Production by Type (2014-2019) Table Global Float Level Sensors Production Share by Type (2014-2019) Figure Global Float Level Sensors Production Share by Type (2014-2019) Figure Global Float Level Sensors Value ($) and Growth Rate of Magnetic Float Level Sensors Figure Global Float Level Sensors Value ($) and Growth Rate of Mechanical Float Level Sensors Figure Global Float Level Sensors Value ($) and Growth Rate of Others Figure Global Float Level Sensors Price by Type (2014-2019) Table Global Float Level Sensors Consumption by Application (2014-2019) Table Global Float Level Sensors Consumption Market Share by Application (2014-2019) Figure Global Float Level Sensors Consumption Market Share by Application (2014-2019) Table Downstream Buyers Introduction by Application Figure Global Float Level Sensors Consumption and Growth Rate of Petroleum Industry (2014-2019) Figure Global Float Level Sensors Consumption and Growth Rate of Chemical Industry (2014-2019) Figure Global Float Level Sensors Consumption and Growth Rate of Food Industry (2014-2019) Figure Global Float Level Sensors Consumption and Growth Rate of Others (2014-2019) Table Global Float Level Sensors Value ($) by Region (2014-2019) Table Global Float Level Sensors Value ($) Market Share by Region (2014-2019) Figure Global Float Level Sensors Value ($) Market Share by Region (2014-2019) Table Global Float Level Sensors Production by Region (2014-2019) Table Global Float Level Sensors Production Market Share by Region (2014-2019) Figure Global Float Level Sensors Production Market Share by Region (2014-2019) Table Global Float Level Sensors Production, Value ($), Price and Gross Margin (2014-2019) Table North America Float Level Sensors Production, Value ($), Price and Gross Margin (2014-2019) Table Europe Float Level Sensors Production, Value ($), Price and Gross Margin (2014-2019) Table China Float Level Sensors Production, Value ($), Price and Gross Margin (2014-2019) Table Japan Float Level Sensors Production, Value ($), Price and Gross Margin (2014-2019) Table Middle East & Africa Float Level Sensors Production, Value ($), Price and Gross Margin (2014-2019) Table India Float Level Sensors Production, Value ($), Price and Gross Margin (2014-2019) Table South America Float Level Sensors Production, Value ($), Price and Gross Margin (2014-2019) Table Global Float Level Sensors Consumption by Regions (2014-2019) Figure Global Float Level Sensors Consumption Share by Regions (2014-2019) Table North America Float Level Sensors Production, Consumption, Export, Import (2014-2019) Table Europe Float Level Sensors Production, Consumption, Export, Import (2014-2019) Table China Float Level Sensors Production, Consumption, Export, Import (2014-2019) Table Japan Float Level Sensors Production, Consumption, Export, Import (2014-2019) Table Middle East & Africa Float Level Sensors Production, Consumption, Export, Import (2014-2019) Table India Float Level Sensors Production, Consumption, Export, Import (2014-2019) Table South America Float Level Sensors Production, Consumption, Export, Import (2014-2019) Figure North America Float Level Sensors Production and Growth Rate Analysis Figure North America Float Level Sensors Consumption and Growth Rate Analysis Figure North America Float Level Sensors SWOT Analysis Figure Europe Float Level Sensors Production and Growth Rate Analysis Figure Europe Float Level Sensors Consumption and Growth Rate Analysis Figure Europe Float Level Sensors SWOT Analysis Figure China Float Level Sensors Production and Growth Rate Analysis Figure China Float Level Sensors Consumption and Growth Rate Analysis Figure China Float Level Sensors SWOT Analysis Figure Japan Float Level Sensors Production and Growth Rate Analysis Figure Japan Float Level Sensors Consumption and Growth Rate Analysis Figure Japan Float Level Sensors SWOT Analysis Figure Middle East & Africa Float Level Sensors Production and Growth Rate Analysis Figure Middle East & Africa Float Level Sensors Consumption and Growth Rate Analysis Figure Middle East & Africa Float Level Sensors SWOT Analysis Figure India Float Level Sensors Production and Growth Rate Analysis Figure India Float Level Sensors Consumption and Growth Rate Analysis Figure India Float Level Sensors SWOT Analysis Figure South America Float Level Sensors Production and Growth Rate Analysis Figure South America Float Level Sensors Consumption and Growth Rate Analysis Figure South America Float Level Sensors SWOT Analysis Figure Top 3 Market Share of Float Level Sensors Companies Figure Top 6 Market Share of Float Level Sensors Companies Table Mergers, Acquisitions and Expansion Analysis Table Company Profiles Table Product Introduction Table Barksdale Production, Value ($), Price, Gross Margin 2014-2019 Figure Barksdale Production and Growth Rate Figure Barksdale Value ($) Market Share 2014-2019 Figure Barksdale Market Share of Float Level Sensors Segmented by Region in 2018 Table Company Profiles Table Product Introduction Table Gems Sensors & Controls Production, Value ($), Price, Gross Margin 2014-2019 Figure Gems Sensors & Controls Production and Growth Rate Figure Gems Sensors & Controls Value ($) Market Share 2014-2019 Figure Gems Sensors & Controls Market Share of Float Level Sensors Segmented by Region in 2018 Table Company Profiles Table Product Introduction Table FAFNIR Production, Value ($), Price, Gross Margin 2014-2019 Figure FAFNIR Production and Growth Rate Figure FAFNIR Value ($) Market Share 2014-2019 Figure FAFNIR Market Share of Float Level Sensors Segmented by Region in 2018 Table Company Profiles Table Product Introduction Table AMETEK Drexelbrook Production, Value ($), Price, Gross Margin 2014-2019 Figure AMETEK Drexelbrook Production and Growth Rate Figure AMETEK Drexelbrook Value ($) Market Share 2014-2019 Figure AMETEK Drexelbrook Market Share of Float Level Sensors Segmented by Region in 2018 Table Company Profiles Table Product Introduction Table WIKA Production, Value ($), Price, Gross Margin 2014-2019 Figure WIKA Production and Growth Rate Figure WIKA Value ($) Market Share 2014-2019 Figure WIKA Market Share of Float Level Sensors Segmented by Region in 2018 Table Company Profiles Table Product Introduction Table Gentech International Production, Value ($), Price, Gross Margin 2014-2019 Figure Gentech International Production and Growth Rate Figure Gentech International Value ($) Market Share 2014-2019 Figure Gentech International Market Share of Float Level Sensors Segmented by Region in 2018 Table Company Profiles Table Product Introduction Table ABB Measurement Production, Value ($), Price, Gross Margin 2014-2019 Figure ABB Measurement Production and Growth Rate Figure ABB Measurement Value ($) Market Share 2014-2019 Figure ABB Measurement Market Share of Float Level Sensors Segmented by Region in 2018 Table Company Profiles Table Product Introduction Table Valcom Production, Value ($), Price, Gross Margin 2014-2019 Figure Valcom Production and Growth Rate Figure Valcom Value ($) Market Share 2014-2019 Figure Valcom Market Share of Float Level Sensors Segmented by Region in 2018 Table Company Profiles Table Product Introduction Table Dandong Top Production, Value ($), Price, Gross Margin 2014-2019 Figure Dandong Top Production and Growth Rate Figure Dandong Top Value ($) Market Share 2014-2019 Figure Dandong Top Market Share of Float Level Sensors Segmented by Region in 2018 Table Company Profiles Table Product Introduction Table FineTek Production, Value ($), Price, Gross Margin 2014-2019 Figure FineTek Production and Growth Rate Figure FineTek Value ($) Market Share 2014-2019 Figure FineTek Market Share of Float Level Sensors Segmented by Region in 2018 Table Global Float Level Sensors Market Value ($) Forecast, by Type Table Global Float Level Sensors Market Volume Forecast, by Type Figure Global Float Level Sensors Market Value ($) and Growth Rate Forecast of Magnetic Float Level Sensors (2019-2024) Figure Global Float Level Sensors Market Volume and Growth Rate Forecast of Magnetic Float Level Sensors (2019-2024) Figure Global Float Level Sensors Market Value ($) and Growth Rate Forecast of Mechanical Float Level Sensors (2019-2024) Figure Global Float Level Sensors Market Volume and Growth Rate Forecast of Mechanical Float Level Sensors (2019-2024) Figure Global Float Level Sensors Market Value ($) and Growth Rate Forecast of Others (2019-2024) Figure Global Float Level Sensors Market Volume and Growth Rate Forecast of Others (2019-2024) Table Global Market Value ($) Forecast by Application (2019-2024) Table Global Market Volume Forecast by Application (2019-2024) Figure Global Float Level Sensors Consumption and Growth Rate of Petroleum Industry (2014-2019) Figure Global Float Level Sensors Consumption and Growth Rate of Chemical Industry (2014-2019) Figure Global Float Level Sensors Consumption and Growth Rate of Food Industry (2014-2019) Figure Global Float Level Sensors Consumption and Growth Rate of Others (2014-2019) Figure Market Value ($) and Growth Rate Forecast of Others (2019-2024) Figure Market Volume and Growth Rate Forecast of Others (2019-2024) Figure North America Market Value ($) and Growth Rate Forecast (2019-2024) Table North America Consumption and Growth Rate Forecast (2019-2024) Figure Europe Market Value ($) and Growth Rate Forecast (2019-2024) Table Europe Consumption and Growth Rate Forecast (2019-2024) Figure China Market Value ($) and Growth Rate Forecast (2019-2024) Table China Consumption and Growth Rate Forecast (2019-2024) Figure Japan Market Value ($) and Growth Rate Forecast (2019-2024) Table Japan Consumption and Growth Rate Forecast (2019-2024) Figure Middle East & Africa Market Value ($) and Growth Rate Forecast (2019-2024) Table Middle East & Africa Consumption and Growth Rate Forecast (2019-2024) Figure India Market Value ($) and Growth Rate Forecast (2019-2024) Table India Consumption and Growth Rate Forecast (2019-2024) Figure South America Market Value ($) and Growth Rate Forecast (2019-2024) Table South America Consumption and Growth Rate Forecast (2019-2024) Figure Industry Resource/Technology/Labor Importance Analysis Table New Entrants SWOT Analysis Table New Project Analysis of Investment Recovery
Inquiry For Buying
Float Level Sensors
Request Sample
Float Level Sensors