Natural Food Flavor Market Size, Share, and Trends Analysis Report
CAGR :

| Market Size 2023 (Base Year) | USD 9.52 Billion |
| Market Size 2032 (Forecast Year) | USD 14.48 Billion |
| CAGR | 4.28% |
| Forecast Period | 2024 - 2032 |
| Historical Period | 2018 - 2023 |
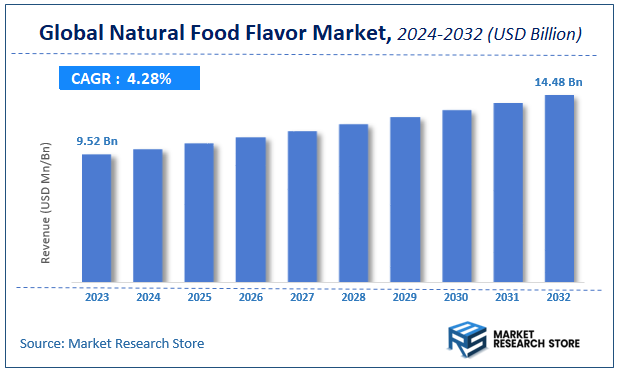
Market Research Store has published a report on the global natural food flavor market, estimating its value at USD 9.52 Billion in 2023, with projections indicating it will reach USD 14.48 Billion by the end of 2032. The market is expected to expand at a compound annual growth rate (CAGR) of around 4.28% over the forecast period. The report examines the factors driving market growth, the obstacles that could hinder this expansion, and the opportunities that may emerge in the natural food flavor industry. Additionally, it offers a detailed analysis of how these elements will affect demand dynamics and market performance throughout the forecast period.
Natural Food Flavor Market: Overview
The growth of the natural food flavor market is fueled by rising global demand across various industries and applications. The report highlights lucrative opportunities, analyzing cost structures, key segments, emerging trends, regional dynamics, and advancements by leading players to provide comprehensive market insights. The natural food flavor market report offers a detailed industry analysis from 2024 to 2032, combining quantitative and qualitative insights. It examines key factors such as pricing, market penetration, GDP impact, industry dynamics, major players, consumer behavior, and socio-economic conditions. Structured into multiple sections, the report provides a comprehensive perspective on the market from all angles.
Key sections of the natural food flavor market report include market segments, outlook, competitive landscape, and company profiles. Market Segments offer in-depth details based on Source, Form, Application, Distribution Channel, and other relevant classifications to support strategic marketing initiatives. Market Outlook thoroughly analyzes market trends, growth drivers, restraints, opportunities, challenges, Porter’s Five Forces framework, macroeconomic factors, value chain analysis, and pricing trends shaping the market now and in the future. The Competitive Landscape and Company Profiles section highlights major players, their strategies, and market positioning to guide investment and business decisions. The report also identifies innovation trends, new business opportunities, and investment prospects for the forecast period.
Key Highlights:
- As per the analysis shared by our research analyst, the global natural food flavor market is estimated to grow annually at a CAGR of around 4.28% over the forecast period (2024-2032).
- In terms of revenue, the global natural food flavor market size was valued at around USD 9.52 Billion in 2023 and is projected to reach USD 14.48 Billion by 2032.
- The market is projected to grow at a significant rate due to Rising preference for clean-label and organic food products boosts demand for natural flavors.
- Based on the Source, the Fruits segment is growing at a high rate and will continue to dominate the global market as per industry projections.
- On the basis of Form, the Liquid segment is anticipated to command the largest market share.
- In terms of Application, the Beverages segment is projected to lead the global market.
- By Distribution Channel, the Online segment is predicted to dominate the global market.
- Based on region, North America is projected to dominate the global market during the forecast period.
Natural Food Flavor Market: Report Scope
This report thoroughly analyzes the natural food flavor market, exploring its historical trends, current state, and future projections. The market estimates presented result from a robust research methodology, incorporating primary research, secondary sources, and expert opinions. These estimates are influenced by the prevailing market dynamics as well as key economic, social, and political factors. Furthermore, the report considers the impact of regulations, government expenditures, and advancements in research and development on the market. Both positive and negative shifts are evaluated to ensure a comprehensive and accurate market outlook.
| Report Attributes | Report Details |
|---|---|
| Report Name | Natural Food Flavor Market |
| Market Size in 2023 | USD 9.52 Billion |
| Market Forecast in 2032 | USD 14.48 Billion |
| Growth Rate | CAGR of 4.28% |
| Number of Pages | 221 |
| Key Companies Covered | Givaudan, Firmenich, International Flavors & Fragrances (IFF), Symrise, Sensient Technologies, Kerry Group, Takasago International, Mane SA, Robertet Group, T. Hasegawa Co. Ltd. |
| Segments Covered | By Source, By Form, By Application, By Distribution Channel, and By Region |
| Regions Covered | North America, Europe, Asia Pacific (APAC), Latin America, Middle East, and Africa (MEA) |
| Base Year | 2023 |
| Historical Year | 2018 to 2023 |
| Forecast Year | 2024 to 2032 |
| Customization Scope | Avail customized purchase options to meet your exact research needs. Request For Customization |
Natural Food Flavor Market: Dynamics
The Natural Food Flavor market is a dynamic and expanding sector within the food and beverage industry, fundamentally reshaped by consumer preferences for healthier, transparent, and authentic food experiences.
Key Growth Drivers:
The most significant driver for the natural food flavor market is the surging global consumer demand for "clean label" products and healthier food options, driven by increasing awareness of the potential adverse effects of artificial ingredients and a desire for natural, recognizable components. The rapid globalization of food culture has also fueled demand for diverse, authentic, and exotic natural flavors as consumers seek new taste experiences. Furthermore, the burgeoning growth in the convenience and processed food sectors, coupled with rising disposable incomes, encourages manufacturers to use natural flavors to enhance the appeal and perceived healthfulness of ready-to-eat meals, snacks, and beverages. Continuous innovations in food technology, including advanced extraction methods and encapsulation techniques, also enable the development of more stable, potent, and versatile natural flavors, supporting market expansion.
Restraints:
The market faces significant restraints primarily from the relatively higher production cost of natural food flavors compared to synthetic alternatives. This cost disparity can be a deterrent for food manufacturers, particularly those operating on thin margins, limiting the widespread adoption of natural flavors in some product categories. Another considerable restraint is the limited availability and price volatility of certain natural raw materials, which are often subject to seasonal changes, climatic conditions, and geopolitical factors, leading to supply chain uncertainties and fluctuating prices. Ensuring the consistent quality, stability, and sensory profile of natural flavors across different batches and applications can also be more challenging than with artificial counterparts.
Opportunities:
Significant opportunities lie in the continuous innovation and development of novel natural flavor profiles, particularly those derived from plant-based sources, to cater to the growing vegan, vegetarian, and flexitarian consumer base. The integration of advanced technologies like Artificial Intelligence (AI) and Machine Learning (ML) in flavor discovery and formulation can accelerate the creation of unique, personalized, and highly targeted natural flavors. The expansion into functional foods and beverages, where natural flavors can enhance taste while aligning with health benefits (e.g., in products containing adaptogens or probiotics), presents a lucrative avenue. Furthermore, increasing consumer interest in sustainably sourced ingredients offers a strong opportunity for brands to differentiate themselves by emphasizing ethical and environmentally friendly sourcing practices for natural flavors.
Challenges:
A key challenge is achieving consistent flavor intensity, stability, and authenticity in various food matrices and under different processing conditions, as natural flavors can be more susceptible to degradation from heat, light, or oxidation than artificial ones. Overcoming the complexity of extracting and isolating specific natural flavor compounds from raw materials while maintaining their desired sensory characteristics and cost-effectiveness remains a significant technical hurdle. The market also faces challenges related to stringent and often fragmented regulatory frameworks across different countries regarding the classification and labeling of "natural" flavors, which can create compliance complexities for global manufacturers. Lastly, effectively communicating the benefits and distinguishing natural flavors from "nature-identical" or artificial flavors to a sometimes skeptical or misinformed consumer base is crucial for building trust and driving adoption.
Natural Food Flavor Market: Segmentation Insights
The global natural food flavor market is segmented based on Source, Form, Application, Distribution Channel, and Region. All the segments of the natural food flavor market have been analyzed based on present & future trends and the market is estimated from 2024 to 2032.
Based on Source, the global natural food flavor market is divided into Fruits, Vegetables, Herbs & Spices, Dairy, Meat, Others.
On the basis of Form, the global natural food flavor market is bifurcated into Liquid, Powder, Paste.
In terms of Application, the global natural food flavor market is categorized into Beverages, Bakery, Dairy, Confectionery, Snacks, Processed Foods, Others.
Based on Distribution Channel, the global natural food flavor market is split into Online, Offline.
Natural Food Flavor Market: Regional Insights
The North American region, led by the United States, dominates the global natural food flavor market, holding the largest revenue share due to high consumer demand for clean-label, organic, and plant-based products. Market research indicates that North America accounts for over 35% of the global market, driven by stringent food safety regulations, a well-established food and beverage industry, and strong consumer preference for natural ingredients over synthetic alternatives. Key players like Givaudan, International Flavors & Fragrances (IFF), and Symrise have a significant presence in the region, further solidifying its dominance.
Europe follows closely, with countries like Germany, France, and the UK leading due to strict EU regulations on artificial additives and growing health consciousness. The Asia-Pacific region is the fastest-growing market, propelled by rising disposable incomes, urbanization, and shifting dietary preferences in countries like China and India. However, North America remains the frontrunner, supported by innovation in flavor technologies and robust retail and distribution networks.
Natural Food Flavor Market: Competitive Landscape
The natural food flavor market report offers a thorough analysis of both established and emerging players within the market. It includes a detailed list of key companies, categorized based on the types of products they offer and other relevant factors. The report also highlights the market entry year for each player, providing further context for the research analysis.
The "Global Natural Food Flavor Market" study offers valuable insights, focusing on the global market landscape, with an emphasis on major industry players such as;
- Givaudan
- Firmenich
- International Flavors & Fragrances (IFF)
- Symrise
- Sensient Technologies
- Kerry Group
- Takasago International
- Mane SA
- Robertet Group
- T. Hasegawa Co. Ltd.
The Global Natural Food Flavor Market is Segmented as Follows:
By Source
- Fruits
- Vegetables
- Herbs & Spices
- Dairy
- Meat
- Others
By Form
- Liquid
- Powder
- Paste
By Application
- Beverages
- Bakery
- Dairy
- Confectionery
- Snacks
- Processed Foods
- Others
By Distribution Channel
- Online
- Offline
By Region
- North America
- The U.S.
- Canada
- Mexico
- Europe
- France
- The UK
- Spain
- Germany
- Italy
- Rest of Europe
- Asia Pacific
- China
- Japan
- India
- Australia
- South Korea
- Rest of Asia Pacific
- The Middle East & Africa
- Saudi Arabia
- UAE
- Egypt
- Kuwait
- South Africa
- Rest of the Middle East & Africa
- Latin America
- Brazil
- Argentina
- Rest of Latin America
Market Evolution
This section evaluates the market position of the product or service by examining its development pathway and competitive dynamics. It provides a detailed overview of the product's growth stages, including the early (historical) phase, the mid-stage, and anticipated future advancements influenced by innovation and emerging technologies.
Porter’s Analysis
Porter’s Five Forces framework offers a strategic lens for assessing competitor behavior and the positioning of key players in the natural food flavor industry. This section explores the external factors shaping competitive dynamics and influencing market strategies in the years ahead. The analysis focuses on five critical forces:
- Competitive Rivalry
- Threat of New Entrants
- Threat of Substitutes
- Supplier Bargaining Power
- Buyer Bargaining Power
Value Chain & Market Attractiveness Analysis
The value chain analysis helps businesses optimize operations by mapping the product flow from suppliers to end consumers, identifying opportunities to streamline processes and gain a competitive edge. Segment-wise market attractiveness analysis evaluates key dimensions like product categories, demographics, and regions, assessing growth potential, market size, and profitability. This enables businesses to focus resources on high-potential segments for better ROI and long-term value.
PESTEL Analysis
PESTEL analysis is a powerful tool in market research reports that enhances market understanding by systematically examining the external macro-environmental factors influencing a business or industry. The acronym stands for Political, Economic, Social, Technological, Environmental, and Legal factors. By evaluating these dimensions, PESTEL analysis provides a comprehensive overview of the broader context within which a market operates, helping businesses identify potential opportunities and threats.
- Political factors assess government policies, stability, trade regulations, and political risks that could impact market operations.
- Economic factors examine variables like inflation, exchange rates, economic growth, and consumer spending power to determine market viability.
- Social factors explore cultural trends, demographics, and lifestyle changes that shape consumer behavior and preferences.
- Technological factors evaluate innovation, R&D, and technological advancements affecting product development and operational efficiencies.
- Environmental factors focus on sustainability, climate change impacts, and eco-friendly practices shaping market trends.
- Legal factors address compliance requirements, industry regulations, and intellectual property laws impacting market entry and operations.
Import-Export Analysis & Pricing Analysis
An import-export analysis is vital for market research, revealing global trade dynamics, trends, and opportunities. It examines trade volumes, product categories, and regional competitiveness, offering insights into supply chains and market demand. This section also analyzes past and future pricing trends, helping businesses optimize strategies and enabling consumers to assess product value effectively.
Natural Food Flavor Market: Company Profiles
The report identifies key players in the natural food flavor market through a competitive landscape and company profiles, evaluating their offerings, financial performance, strategies, and market positioning. It includes a SWOT analysis of the top 3-5 companies, assessing strengths, weaknesses, opportunities, and threats. The competitive landscape highlights rankings, recent activities (mergers, acquisitions, partnerships, product launches), and regional footprints using the Ace matrix. Customization is available to meet client-specific needs.
Regional & Industry Footprint
This section details the geographic reach, sales networks, and market penetration of companies profiled in the natural food flavor report, showcasing their operations and distribution across regions. It analyzes the alignment of companies with specific industry verticals, highlighting the industries they serve and the scope of their products and services within those sectors.
Ace Matrix
This section categorizes companies into four distinct groups—Active, Cutting Edge, Innovator, and Emerging—based on their product and business strategies. The evaluation of product strategy focuses on aspects such as the range and depth of offerings, commitment to innovation, product functionalities, and scalability. Key elements like global reach, sector coverage, strategic acquisitions, and long-term growth plans are considered for business strategy. This analysis provides a detailed view of companies' position within the market and highlights their potential for future growth and development.
Research Methodology
The qualitative and quantitative insights for the natural food flavor market are derived through a multi-faceted research approach, combining input from subject matter experts, primary research, and secondary data sources. Primary research includes gathering critical information via face-to-face or telephonic interviews, surveys, questionnaires, and feedback from industry professionals, key opinion leaders (KOLs), and customers. Regular interviews with industry experts are conducted to deepen the analysis and reinforce the existing data, ensuring a robust and well-rounded market understanding.
Secondary research for this report was carried out by the Market Research Store team, drawing on a variety of authoritative sources, such as:
- Official company websites, annual reports, financial statements, investor presentations, and SEC filings
- Internal and external proprietary databases, as well as relevant patent and regulatory databases
- Government publications, national statistical databases, and industry-specific market reports
- Media coverage, including news articles, press releases, and webcasts about market participants
- Paid industry databases for detailed market insights
Market Research Store conducted in-depth consultations with various key opinion leaders in the industry, including senior executives from top companies and regional leaders from end-user organizations. This effort aimed to gather critical insights on factors such as the market share of dominant brands in specific countries and regions, along with pricing strategies for products and services.
To determine total sales data, the research team conducted primary interviews across multiple countries with influential stakeholders, including:
- Distributors
- Marketing, Brand, and Product Managers
- Procurement and Production Managers
- Sales and Regional Sales Managers, Country Managers
- Technical Specialists
- C-Level Executives
These subject matter experts, with their extensive industry experience, helped validate and refine the findings. For secondary research, data were sourced from a wide range of materials, including online resources, company annual reports, industry publications, research papers, association reports, and government websites. These various sources provide a comprehensive and well-rounded perspective on the market.
Frequently Asked Questions
Table Of Content
Global Natural Food Flavors Industry Market Research Report
1 Natural Food Flavors Introduction and Market Overview
1.1 Objectives of the Study
1.2 Definition of Natural Food Flavors
1.3 Natural Food Flavors Market Scope and Market Size Estimation
1.3.1 Market Concentration Ratio and Market Maturity Analysis
1.3.2 Global Natural Food Flavors Value ($) and Growth Rate from 2013-2023
1.4 Market Segmentation
1.4.1 Types of Natural Food Flavors
1.4.2 Applications of Natural Food Flavors
1.4.3 Research Regions
1.4.3.1 North America Natural Food Flavors Production Value ($) and Growth Rate (2013-2018)
1.4.3.2 Europe Natural Food Flavors Production Value ($) and Growth Rate (2013-2018)
1.4.3.3 China Natural Food Flavors Production Value ($) and Growth Rate (2013-2018)
1.4.3.4 Japan Natural Food Flavors Production Value ($) and Growth Rate (2013-2018)
1.4.3.5 Middle East & Africa Natural Food Flavors Production Value ($) and Growth Rate (2013-2018)
1.4.3.6 India Natural Food Flavors Production Value ($) and Growth Rate (2013-2018)
1.4.3.7 South America Natural Food Flavors Production Value ($) and Growth Rate (2013-2018)
1.5 Market Dynamics
1.5.1 Drivers
1.5.1.1 Emerging Countries of Natural Food Flavors
1.5.1.2 Growing Market of Natural Food Flavors
1.5.2 Limitations
1.5.3 Opportunities
1.6 Industry News and Policies by Regions
1.6.1 Industry News
1.6.2 Industry Policies

2 Industry Chain Analysis
2.1 Upstream Raw Material Suppliers of Natural Food Flavors Analysis
2.2 Major Players of Natural Food Flavors
2.2.1 Major Players Manufacturing Base and Market Share of Natural Food Flavors in 2017
2.2.2 Major Players Product Types in 2017
2.3 Natural Food Flavors Manufacturing Cost Structure Analysis
2.3.1 Production Process Analysis
2.3.2 Manufacturing Cost Structure of Natural Food Flavors
2.3.3 Raw Material Cost of Natural Food Flavors
2.3.4 Labor Cost of Natural Food Flavors
2.4 Market Channel Analysis of Natural Food Flavors
2.5 Major Downstream Buyers of Natural Food Flavors Analysis

3 Global Natural Food Flavors Market, by Type
3.1 Global Natural Food Flavors Value ($) and Market Share by Type (2013-2018)
3.2 Global Natural Food Flavors Production and Market Share by Type (2013-2018)
3.3 Global Natural Food Flavors Value ($) and Growth Rate by Type (2013-2018)
3.4 Global Natural Food Flavors Price Analysis by Type (2013-2018)

4 Natural Food Flavors Market, by Application
4.1 Global Natural Food Flavors Consumption and Market Share by Application (2013-2018)
4.2 Downstream Buyers by Application
4.3 Global Natural Food Flavors Consumption and Growth Rate by Application (2013-2018)

5 Global Natural Food Flavors Production, Value ($) by Region (2013-2018)
5.1 Global Natural Food Flavors Value ($) and Market Share by Region (2013-2018)
5.2 Global Natural Food Flavors Production and Market Share by Region (2013-2018)
5.3 Global Natural Food Flavors Production, Value ($), Price and Gross Margin (2013-2018)
5.4 North America Natural Food Flavors Production, Value ($), Price and Gross Margin (2013-2018)
5.5 Europe Natural Food Flavors Production, Value ($), Price and Gross Margin (2013-2018)
5.6 China Natural Food Flavors Production, Value ($), Price and Gross Margin (2013-2018)
5.7 Japan Natural Food Flavors Production, Value ($), Price and Gross Margin (2013-2018)
5.8 Middle East & Africa Natural Food Flavors Production, Value ($), Price and Gross Margin (2013-2018)
5.9 India Natural Food Flavors Production, Value ($), Price and Gross Margin (2013-2018)
5.10 South America Natural Food Flavors Production, Value ($), Price and Gross Margin (2013-2018)

6 Global Natural Food Flavors Production, Consumption, Export, Import by Regions (2013-2018)
6.1 Global Natural Food Flavors Consumption by Regions (2013-2018)
6.2 North America Natural Food Flavors Production, Consumption, Export, Import (2013-2018)
6.3 Europe Natural Food Flavors Production, Consumption, Export, Import (2013-2018)
6.4 China Natural Food Flavors Production, Consumption, Export, Import (2013-2018)
6.5 Japan Natural Food Flavors Production, Consumption, Export, Import (2013-2018)
6.6 Middle East & Africa Natural Food Flavors Production, Consumption, Export, Import (2013-2018)
6.7 India Natural Food Flavors Production, Consumption, Export, Import (2013-2018)
6.8 South America Natural Food Flavors Production, Consumption, Export, Import (2013-2018)

7 Global Natural Food Flavors Market Status and SWOT Analysis by Regions
7.1 North America Natural Food Flavors Market Status and SWOT Analysis
7.2 Europe Natural Food Flavors Market Status and SWOT Analysis
7.3 China Natural Food Flavors Market Status and SWOT Analysis
7.4 Japan Natural Food Flavors Market Status and SWOT Analysis
7.5 Middle East & Africa Natural Food Flavors Market Status and SWOT Analysis
7.6 India Natural Food Flavors Market Status and SWOT Analysis
7.7 South America Natural Food Flavors Market Status and SWOT Analysis

8 Competitive Landscape
8.1 Competitive Profile
8.2 WILD
8.2.1 Company Profiles
8.2.2 Natural Food Flavors Product Introduction
8.2.3 WILD Production, Value ($), Price, Gross Margin 2013-2018E
8.2.4 WILD Market Share of Natural Food Flavors Segmented by Region in 2017
8.3 San-Ei-Gen
8.3.1 Company Profiles
8.3.2 Natural Food Flavors Product Introduction
8.3.3 San-Ei-Gen Production, Value ($), Price, Gross Margin 2013-2018E
8.3.4 San-Ei-Gen Market Share of Natural Food Flavors Segmented by Region in 2017
8.4 Synergy Flavors
8.4.1 Company Profiles
8.4.2 Natural Food Flavors Product Introduction
8.4.3 Synergy Flavors Production, Value ($), Price, Gross Margin 2013-2018E
8.4.4 Synergy Flavors Market Share of Natural Food Flavors Segmented by Region in 2017
8.5 Akay Flavous and Aromatics
8.5.1 Company Profiles
8.5.2 Natural Food Flavors Product Introduction
8.5.3 Akay Flavous and Aromatics Production, Value ($), Price, Gross Margin 2013-2018E
8.5.4 Akay Flavous and Aromatics Market Share of Natural Food Flavors Segmented by Region in 2017
8.6 ACH Food Companies
8.6.1 Company Profiles
8.6.2 Natural Food Flavors Product Introduction
8.6.3 ACH Food Companies Production, Value ($), Price, Gross Margin 2013-2018E
8.6.4 ACH Food Companies Market Share of Natural Food Flavors Segmented by Region in 2017
8.7 Ungerer & Company
8.7.1 Company Profiles
8.7.2 Natural Food Flavors Product Introduction
8.7.3 Ungerer & Company Production, Value ($), Price, Gross Margin 2013-2018E
8.7.4 Ungerer & Company Market Share of Natural Food Flavors Segmented by Region in 2017
8.8 Gajanand
8.8.1 Company Profiles
8.8.2 Natural Food Flavors Product Introduction
8.8.3 Gajanand Production, Value ($), Price, Gross Margin 2013-2018E
8.8.4 Gajanand Market Share of Natural Food Flavors Segmented by Region in 2017
8.9 Mane SA
8.9.1 Company Profiles
8.9.2 Natural Food Flavors Product Introduction
8.9.3 Mane SA Production, Value ($), Price, Gross Margin 2013-2018E
8.9.4 Mane SA Market Share of Natural Food Flavors Segmented by Region in 2017
8.10 McCormick
8.10.1 Company Profiles
8.10.2 Natural Food Flavors Product Introduction
8.10.3 McCormick Production, Value ($), Price, Gross Margin 2013-2018E
8.10.4 McCormick Market Share of Natural Food Flavors Segmented by Region in 2017
8.11 AVT Natural
8.11.1 Company Profiles
8.11.2 Natural Food Flavors Product Introduction
8.11.3 AVT Natural Production, Value ($), Price, Gross Margin 2013-2018E
8.11.4 AVT Natural Market Share of Natural Food Flavors Segmented by Region in 2017
8.12 Sensient
8.12.1 Company Profiles
8.12.2 Natural Food Flavors Product Introduction
8.12.3 Sensient Production, Value ($), Price, Gross Margin 2013-2018E
8.12.4 Sensient Market Share of Natural Food Flavors Segmented by Region in 2017
8.13 Kotanyi
8.13.1 Company Profiles
8.13.2 Natural Food Flavors Product Introduction
8.13.3 Kotanyi Production, Value ($), Price, Gross Margin 2013-2018E
8.13.4 Kotanyi Market Share of Natural Food Flavors Segmented by Region in 2017
8.14 Haldin
8.14.1 Company Profiles
8.14.2 Natural Food Flavors Product Introduction
8.14.3 Haldin Production, Value ($), Price, Gross Margin 2013-2018E
8.14.4 Haldin Market Share of Natural Food Flavors Segmented by Region in 2017
8.15 MDH Spices
8.15.1 Company Profiles
8.15.2 Natural Food Flavors Product Introduction
8.15.3 MDH Spices Production, Value ($), Price, Gross Margin 2013-2018E
8.15.4 MDH Spices Market Share of Natural Food Flavors Segmented by Region in 2017
8.16 Symrise
8.16.1 Company Profiles
8.16.2 Natural Food Flavors Product Introduction
8.16.3 Symrise Production, Value ($), Price, Gross Margin 2013-2018E
8.16.4 Symrise Market Share of Natural Food Flavors Segmented by Region in 2017
8.17 Givaudan
8.18 Dharampal Satyapal Group
8.19 Prova
8.20 Fuchs
8.21 Frutarom
8.22 Everest Spices
8.23 Nilon
8.24 KIS
8.25 Plant Lipids
8.26 Wang Shouyi
8.27 DSM
8.28 Synthite
8.29 TAKASAGO

9 Global Natural Food Flavors Market Analysis and Forecast by Type and Application
9.1 Global Natural Food Flavors Market Value ($) & Volume Forecast, by Type (2018-2023)
9.1.1 Vegetable Flavor Market Value ($) and Volume Forecast (2018-2023)
9.1.2 Fruit Flavor Market Value ($) and Volume Forecast (2018-2023)
9.1.3 Spices Market Value ($) and Volume Forecast (2018-2023)
9.1.4 Other Market Value ($) and Volume Forecast (2018-2023)
9.2 Global Natural Food Flavors Market Value ($) & Volume Forecast, by Application (2018-2023)
9.2.1 Beverage Market Value ($) and Volume Forecast (2018-2023)
9.2.2 Sweet Market Value ($) and Volume Forecast (2018-2023)
9.2.3 Savory Market Value ($) and Volume Forecast (2018-2023)

10 Natural Food Flavors Market Analysis and Forecast by Region
10.1 North America Market Value ($) and Consumption Forecast (2018-2023)
10.2 Europe Market Value ($) and Consumption Forecast (2018-2023)
10.3 China Market Value ($) and Consumption Forecast (2018-2023)
10.4 Japan Market Value ($) and Consumption Forecast (2018-2023)
10.5 Middle East & Africa Market Value ($) and Consumption Forecast (2018-2023)
10.6 India Market Value ($) and Consumption Forecast (2018-2023)
10.7 South America Market Value ($) and Consumption Forecast (2018-2023)

11 New Project Feasibility Analysis
11.1 Industry Barriers and New Entrants SWOT Analysis
11.2 Analysis and Suggestions on New Project Investment

12 Research Finding and Conclusion

13 Appendix
13.1 Discussion Guide
13.2 Knowledge Store: Maia Subscription Portal
13.3 Research Data Source
13.4 Research Assumptions and Acronyms Used
Inquiry For Buying
Natural Food Flavor
Request Sample
Natural Food Flavor