Instant Milk Tea Market Size, Share, and Trends Analysis Report
CAGR :

| Market Size 2024 (Base Year) | USD 1582.43 Million |
| Market Size 2032 (Forecast Year) | USD 2267.66 Million |
| CAGR | 4.6% |
| Forecast Period | 2025 - 2032 |
| Historical Period | 2020 - 2024 |
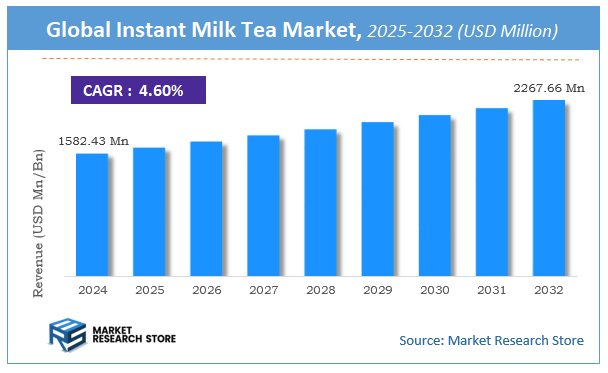
According to a recent study by Market Research Store, the global instant milk tea market size was valued at approximately USD 1582.43 Million in 2024. The market is projected to grow significantly, reaching USD 2267.66 Million by 2032, growing at a compound annual growth rate (CAGR) of 4.6% during the forecast period from 2024 to 2032. The report highlights key growth drivers such as rising demand, technological advancements, and expanding applications. It also outlines potential challenges like regulatory changes and market competition, while emphasizing emerging opportunities for innovation and investment in the instant milk tea industry.
Instant Milk Tea Market: Overview
The growth of the instant milk tea market is fueled by rising global demand across various industries and applications. The report highlights lucrative opportunities, analyzing cost structures, key segments, emerging trends, regional dynamics, and advancements by leading players to provide comprehensive market insights. The instant milk tea market report offers a detailed industry analysis from 2024 to 2032, combining quantitative and qualitative insights. It examines key factors such as pricing, market penetration, GDP impact, industry dynamics, major players, consumer behavior, and socio-economic conditions. Structured into multiple sections, the report provides a comprehensive perspective on the market from all angles.
Key sections of the instant milk tea market report include market segments, outlook, competitive landscape, and company profiles. Market Segments offer in-depth details based on Products, Applications, and other relevant classifications to support strategic marketing initiatives. Market Outlook thoroughly analyzes market trends, growth drivers, restraints, opportunities, challenges, Porter’s Five Forces framework, macroeconomic factors, value chain analysis, and pricing trends shaping the market now and in the future. The Competitive Landscape and Company Profiles section highlights major players, their strategies, and market positioning to guide investment and business decisions. The report also identifies innovation trends, new business opportunities, and investment prospects for the forecast period.
Key Highlights:
- As per the analysis shared by our research analyst, the global instant milk tea market is estimated to grow annually at a CAGR of around 4.6% over the forecast period (2025-2032).
- In terms of revenue, the global instant milk tea market size was valued at around USD 1582.43 Million in 2024 and is projected to reach USD 2267.66 Million by 2032.
- The market is projected to grow at a significant rate due to Increasing demand for ready-to-drink beverages, growing popularity of milk tea, and rising adoption in urban and online retail markets are driving the Instant Milk Tea market.
- Based on the Products, the Bagged product segment is growing at a high rate and will continue to dominate the global market as per industry projections.
- On the basis of Applications, the Tea shop segment is anticipated to command the largest market share.
- Based on region, Asia Pacific is projected to dominate the global market during the forecast period.
Instant Milk Tea Market: Report Scope
This report thoroughly analyzes the instant milk tea market, exploring its historical trends, current state, and future projections. The market estimates presented result from a robust research methodology, incorporating primary research, secondary sources, and expert opinions. These estimates are influenced by the prevailing market dynamics as well as key economic, social, and political factors. Furthermore, the report considers the impact of regulations, government expenditures, and advancements in research and development on the market. Both positive and negative shifts are evaluated to ensure a comprehensive and accurate market outlook.
| Report Attributes | Report Details |
|---|---|
| Report Name | Instant Milk Tea Market |
| Market Size in 2024 | USD 1582.43 Million |
| Market Forecast in 2032 | USD 2267.66 Million |
| Growth Rate | CAGR of 4.6% |
| Number of Pages | 203 |
| Key Companies Covered | Hong Kong Tea Company, Gino, Nittoh Tea (Mitsui Norin), Lipton (Unilever), Greenmax, Uni-President, Shih Chen Foods, Old Town, Guangdong Strong Group, Nestle, Xiangpiaopiao Food |
| Segments Covered | By Products, By Applications, and By Region |
| Regions Covered | North America, Europe, Asia Pacific (APAC), Latin America, The Middle East and Africa (MEA) |
| Base Year | 2024 |
| Historical Year | 2020 to 2024 |
| Forecast Year | 2025 to 2032 |
| Customization Scope | Avail customized purchase options to meet your exact research needs. Request For Customization |
Instant Milk Tea Market: Dynamics
Key Growth Drivers :
The most significant driver is the overwhelming consumer demand for convenience and ready-to-drink (RTD) solutions, particularly among young professionals and students with busy schedules. Instant milk tea premixes offer a quick and hassle-free preparation method, requiring just hot water. The globalization of Asian food and beverage trends, especially the massive popularity of bubble tea (Boba tea), has introduced milk tea to new, younger audiences in North America and Europe, which further fuels the demand for convenient, at-home versions. Furthermore, the expansion of e-commerce and digital distribution channels significantly improves product accessibility across various geographies, leading to increased sales volume.
Restraints :
A primary restraint is the volatility and fluctuation in the prices of key raw materials, such as tea leaves, milk powder, and sugar, which can be influenced by unpredictable climatic conditions and supply chain disruptions. This instability impacts manufacturers' profit margins and can lead to increased retail prices, potentially affecting price-sensitive consumers. Additionally, consumer skepticism regarding the health and authenticity of instant products compared to freshly brewed, artisanal tea, combined with growing health consciousness regarding high sugar and additive content, acts as a significant barrier to market growth, particularly in developed markets.
Opportunities :
The market is rich with opportunities through product innovation focused on health and customization. This includes the development of low-sugar, zero-sugar, and natural sweetener-based variants to cater to health-conscious consumers. There is also a major opportunity in introducing plant-based milk tea powders (using oat, almond, or soy milk) to tap into the growing vegan and lactose-intolerant consumer base. Furthermore, leveraging social media and digital marketing to launch new, exotic, and regional-specific flavors (e.g., matcha, taro, brown sugar) and promoting eco-friendly, sustainable packaging can attract premium-segment consumers and drive brand loyalty.
Challenges :
One major challenge is the intense competitive rivalry and threat of substitutes, as instant milk tea directly competes with a wide array of alternative beverages, including fresh milk tea shops, ready-to-drink coffee, and functional energy drinks. Manufacturers face the constant challenge of maintaining the authentic flavor and aroma of traditional tea in a powdered format, which requires significant investment in advanced processing technologies. Lastly, navigating the complex and diverse food safety and labeling regulations across international markets, especially concerning ingredients and health claims, adds operational and compliance hurdles for global players.
Instant Milk Tea Market: Segmentation Insights
The global instant milk tea market is segmented based on Products, Applications, and Region. All the segments of the instant milk tea market have been analyzed based on present & future trends and the market is estimated from 2024 to 2032.
Based on Products, the global instant milk tea market is divided into Bagged product, Disposable paper cups products, Other.
On the basis of Applications, the global instant milk tea market is bifurcated into Tea shop, The mall, Retail store, Other.
Instant Milk Tea Market: Regional Insights
The Asia-Pacific (APAC) region is the undisputed dominant market for instant milk tea, with China, India, and Southeast Asian nations as the core consumers. The product is deeply embedded in the region's food culture, driven by established brands, widespread availability, and a strong preference for convenient, ready-to-drink beverages. Rapid urbanization, rising disposable incomes, and innovative flavor offerings continue to fuel growth. While other regions have niche markets, they do not compare to the sheer volume, cultural acceptance, and market maturity of APAC, which accounts for the overwhelming majority of global consumption and production.
Instant Milk Tea Market: Competitive Landscape
The instant milk tea market report offers a thorough analysis of both established and emerging players within the market. It includes a detailed list of key companies, categorized based on the types of products they offer and other relevant factors. The report also highlights the market entry year for each player, providing further context for the research analysis.
The "Global Instant Milk Tea Market" study offers valuable insights, focusing on the global market landscape, with an emphasis on major industry players such as;
- Hong Kong Tea Company
- Gino
- Nittoh Tea (Mitsui Norin)
- Lipton (Unilever)
- Greenmax
- Uni-President
- Shih Chen Foods
- Old Town
- Guangdong Strong Group
- Nestle
- Xiangpiaopiao Food
The Global Instant Milk Tea Market is Segmented as Follows:
By Products
- Bagged product
- Disposable paper cups products
- Other
By Applications
- Tea shop
- The mall
- Retail store
- Other
By Region
- North America
- The U.S.
- Canada
- Mexico
- Europe
- France
- The UK
- Spain
- Germany
- Italy
- Rest of Europe
- Asia Pacific
- China
- Japan
- India
- Australia
- South Korea
- Rest of Asia Pacific
- The Middle East & Africa
- Saudi Arabia
- UAE
- Egypt
- Kuwait
- South Africa
- Rest of the Middle East & Africa
- Latin America
- Brazil
- Argentina
- Rest of Latin America
Frequently Asked Questions
Table Of Content
List of Tables and Figures Figure Product Picture of Instant Milk Tea Table Product Specification of Instant Milk Tea Figure Market Concentration Ratio and Market Maturity Analysis of Instant Milk Tea Figure Global Instant Milk Tea Value ($) and Growth Rate from 2014-2024 Table Different Types of Instant Milk Tea Figure Global Instant Milk Tea Value ($) Segment by Type from 2014-2019 Figure Bagged product Picture Figure Disposable paper cups products Picture Figure Other Picture Table Different Applications of Instant Milk Tea Figure Global Instant Milk Tea Value ($) Segment by Applications from 2014-2019 Figure Tea shop Picture Figure The mall Picture Figure Retail store Picture Figure Other Picture Table Research Regions of Instant Milk Tea Figure North America Instant Milk Tea Production Value ($) and Growth Rate (2014-2019) Figure Europe Instant Milk Tea Production Value ($) and Growth Rate (2014-2019) Table China Instant Milk Tea Production Value ($) and Growth Rate (2014-2019) Table Japan Instant Milk Tea Production Value ($) and Growth Rate (2014-2019) Table Middle East & Africa Instant Milk Tea Production Value ($) and Growth Rate (2014-2019) Table India Instant Milk Tea Production Value ($) and Growth Rate (2014-2019) Table South America Instant Milk Tea Production Value ($) and Growth Rate (2014-2019) Table Emerging Countries of Instant Milk Tea Table Growing Market of Instant Milk Tea Figure Industry Chain Analysis of Instant Milk Tea Table Upstream Raw Material Suppliers of Instant Milk Tea with Contact Information Table Major Players Manufacturing Base and Market Share ($) of Instant Milk Tea in 2018 Table Major Players Instant Milk Tea Product Types in 2018 Figure Production Process of Instant Milk Tea Figure Manufacturing Cost Structure of Instant Milk Tea Figure Channel Status of Instant Milk Tea Table Major Distributors of Instant Milk Tea with Contact Information Table Major Downstream Buyers of Instant Milk Tea with Contact Information Table Global Instant Milk Tea Value ($) by Type (2014-2019) Table Global Instant Milk Tea Value ($) Share by Type (2014-2019) Figure Global Instant Milk Tea Value ($) Share by Type (2014-2019) Table Global Instant Milk Tea Production by Type (2014-2019) Table Global Instant Milk Tea Production Share by Type (2014-2019) Figure Global Instant Milk Tea Production Share by Type (2014-2019) Figure Global Instant Milk Tea Value ($) and Growth Rate of Bagged product Figure Global Instant Milk Tea Value ($) and Growth Rate of Disposable paper cups products Figure Global Instant Milk Tea Value ($) and Growth Rate of Other Figure Global Instant Milk Tea Price by Type (2014-2019) Table Global Instant Milk Tea Consumption by Application (2014-2019) Table Global Instant Milk Tea Consumption Market Share by Application (2014-2019) Figure Global Instant Milk Tea Consumption Market Share by Application (2014-2019) Table Downstream Buyers Introduction by Application Figure Global Instant Milk Tea Consumption and Growth Rate of Tea shop (2014-2019) Figure Global Instant Milk Tea Consumption and Growth Rate of The mall (2014-2019) Figure Global Instant Milk Tea Consumption and Growth Rate of Retail store (2014-2019) Figure Global Instant Milk Tea Consumption and Growth Rate of Other (2014-2019) Table Global Instant Milk Tea Value ($) by Region (2014-2019) Table Global Instant Milk Tea Value ($) Market Share by Region (2014-2019) Figure Global Instant Milk Tea Value ($) Market Share by Region (2014-2019) Table Global Instant Milk Tea Production by Region (2014-2019) Table Global Instant Milk Tea Production Market Share by Region (2014-2019) Figure Global Instant Milk Tea Production Market Share by Region (2014-2019) Table Global Instant Milk Tea Production, Value ($), Price and Gross Margin (2014-2019) Table North America Instant Milk Tea Production, Value ($), Price and Gross Margin (2014-2019) Table Europe Instant Milk Tea Production, Value ($), Price and Gross Margin (2014-2019) Table China Instant Milk Tea Production, Value ($), Price and Gross Margin (2014-2019) Table Japan Instant Milk Tea Production, Value ($), Price and Gross Margin (2014-2019) Table Middle East & Africa Instant Milk Tea Production, Value ($), Price and Gross Margin (2014-2019) Table India Instant Milk Tea Production, Value ($), Price and Gross Margin (2014-2019) Table South America Instant Milk Tea Production, Value ($), Price and Gross Margin (2014-2019) Table Global Instant Milk Tea Consumption by Regions (2014-2019) Figure Global Instant Milk Tea Consumption Share by Regions (2014-2019) Table North America Instant Milk Tea Production, Consumption, Export, Import (2014-2019) Table Europe Instant Milk Tea Production, Consumption, Export, Import (2014-2019) Table China Instant Milk Tea Production, Consumption, Export, Import (2014-2019) Table Japan Instant Milk Tea Production, Consumption, Export, Import (2014-2019) Table Middle East & Africa Instant Milk Tea Production, Consumption, Export, Import (2014-2019) Table India Instant Milk Tea Production, Consumption, Export, Import (2014-2019) Table South America Instant Milk Tea Production, Consumption, Export, Import (2014-2019) Figure North America Instant Milk Tea Production and Growth Rate Analysis Figure North America Instant Milk Tea Consumption and Growth Rate Analysis Figure North America Instant Milk Tea SWOT Analysis Figure Europe Instant Milk Tea Production and Growth Rate Analysis Figure Europe Instant Milk Tea Consumption and Growth Rate Analysis Figure Europe Instant Milk Tea SWOT Analysis Figure China Instant Milk Tea Production and Growth Rate Analysis Figure China Instant Milk Tea Consumption and Growth Rate Analysis Figure China Instant Milk Tea SWOT Analysis Figure Japan Instant Milk Tea Production and Growth Rate Analysis Figure Japan Instant Milk Tea Consumption and Growth Rate Analysis Figure Japan Instant Milk Tea SWOT Analysis Figure Middle East & Africa Instant Milk Tea Production and Growth Rate Analysis Figure Middle East & Africa Instant Milk Tea Consumption and Growth Rate Analysis Figure Middle East & Africa Instant Milk Tea SWOT Analysis Figure India Instant Milk Tea Production and Growth Rate Analysis Figure India Instant Milk Tea Consumption and Growth Rate Analysis Figure India Instant Milk Tea SWOT Analysis Figure South America Instant Milk Tea Production and Growth Rate Analysis Figure South America Instant Milk Tea Consumption and Growth Rate Analysis Figure South America Instant Milk Tea SWOT Analysis Figure Top 3 Market Share of Instant Milk Tea Companies Figure Top 6 Market Share of Instant Milk Tea Companies Table Mergers, Acquisitions and Expansion Analysis Table Company Profiles Table Product Introduction Table Hong Kong Tea Company Production, Value ($), Price, Gross Margin 2014-2019 Figure Hong Kong Tea Company Production and Growth Rate Figure Hong Kong Tea Company Value ($) Market Share 2014-2019 Figure Hong Kong Tea Company Market Share of Instant Milk Tea Segmented by Region in 2018 Table Company Profiles Table Product Introduction Table Gino Production, Value ($), Price, Gross Margin 2014-2019 Figure Gino Production and Growth Rate Figure Gino Value ($) Market Share 2014-2019 Figure Gino Market Share of Instant Milk Tea Segmented by Region in 2018 Table Company Profiles Table Product Introduction Table Nittoh Tea (Mitsui Norin) Production, Value ($), Price, Gross Margin 2014-2019 Figure Nittoh Tea (Mitsui Norin) Production and Growth Rate Figure Nittoh Tea (Mitsui Norin) Value ($) Market Share 2014-2019 Figure Nittoh Tea (Mitsui Norin) Market Share of Instant Milk Tea Segmented by Region in 2018 Table Company Profiles Table Product Introduction Table Lipton (Unilever) Production, Value ($), Price, Gross Margin 2014-2019 Figure Lipton (Unilever) Production and Growth Rate Figure Lipton (Unilever) Value ($) Market Share 2014-2019 Figure Lipton (Unilever) Market Share of Instant Milk Tea Segmented by Region in 2018 Table Company Profiles Table Product Introduction Table Greenmax Production, Value ($), Price, Gross Margin 2014-2019 Figure Greenmax Production and Growth Rate Figure Greenmax Value ($) Market Share 2014-2019 Figure Greenmax Market Share of Instant Milk Tea Segmented by Region in 2018 Table Company Profiles Table Product Introduction Table Uni-President Production, Value ($), Price, Gross Margin 2014-2019 Figure Uni-President Production and Growth Rate Figure Uni-President Value ($) Market Share 2014-2019 Figure Uni-President Market Share of Instant Milk Tea Segmented by Region in 2018 Table Company Profiles Table Product Introduction Table Shih Chen Foods Production, Value ($), Price, Gross Margin 2014-2019 Figure Shih Chen Foods Production and Growth Rate Figure Shih Chen Foods Value ($) Market Share 2014-2019 Figure Shih Chen Foods Market Share of Instant Milk Tea Segmented by Region in 2018 Table Company Profiles Table Product Introduction Table Old Town Production, Value ($), Price, Gross Margin 2014-2019 Figure Old Town Production and Growth Rate Figure Old Town Value ($) Market Share 2014-2019 Figure Old Town Market Share of Instant Milk Tea Segmented by Region in 2018 Table Company Profiles Table Product Introduction Table Guangdong Strong Group Production, Value ($), Price, Gross Margin 2014-2019 Figure Guangdong Strong Group Production and Growth Rate Figure Guangdong Strong Group Value ($) Market Share 2014-2019 Figure Guangdong Strong Group Market Share of Instant Milk Tea Segmented by Region in 2018 Table Company Profiles Table Product Introduction Table Nestle Production, Value ($), Price, Gross Margin 2014-2019 Figure Nestle Production and Growth Rate Figure Nestle Value ($) Market Share 2014-2019 Figure Nestle Market Share of Instant Milk Tea Segmented by Region in 2018 Table Company Profiles Table Product Introduction Table Xiangpiaopiao Food Production, Value ($), Price, Gross Margin 2014-2019 Figure Xiangpiaopiao Food Production and Growth Rate Figure Xiangpiaopiao Food Value ($) Market Share 2014-2019 Figure Xiangpiaopiao Food Market Share of Instant Milk Tea Segmented by Region in 2018 Table Global Instant Milk Tea Market Value ($) Forecast, by Type Table Global Instant Milk Tea Market Volume Forecast, by Type Figure Global Instant Milk Tea Market Value ($) and Growth Rate Forecast of Bagged product (2019-2024) Figure Global Instant Milk Tea Market Volume and Growth Rate Forecast of Bagged product (2019-2024) Figure Global Instant Milk Tea Market Value ($) and Growth Rate Forecast of Disposable paper cups products (2019-2024) Figure Global Instant Milk Tea Market Volume and Growth Rate Forecast of Disposable paper cups products (2019-2024) Figure Global Instant Milk Tea Market Value ($) and Growth Rate Forecast of Other (2019-2024) Figure Global Instant Milk Tea Market Volume and Growth Rate Forecast of Other (2019-2024) Table Global Market Value ($) Forecast by Application (2019-2024) Table Global Market Volume Forecast by Application (2019-2024) Figure Global Instant Milk Tea Consumption and Growth Rate of Tea shop (2014-2019) Figure Global Instant Milk Tea Consumption and Growth Rate of The mall (2014-2019) Figure Global Instant Milk Tea Consumption and Growth Rate of Retail store (2014-2019) Figure Global Instant Milk Tea Consumption and Growth Rate of Other (2014-2019) Figure Market Value ($) and Growth Rate Forecast of Other (2019-2024) Figure Market Volume and Growth Rate Forecast of Other (2019-2024) Figure North America Market Value ($) and Growth Rate Forecast (2019-2024) Table North America Consumption and Growth Rate Forecast (2019-2024) Figure Europe Market Value ($) and Growth Rate Forecast (2019-2024) Table Europe Consumption and Growth Rate Forecast (2019-2024) Figure China Market Value ($) and Growth Rate Forecast (2019-2024) Table China Consumption and Growth Rate Forecast (2019-2024) Figure Japan Market Value ($) and Growth Rate Forecast (2019-2024) Table Japan Consumption and Growth Rate Forecast (2019-2024) Figure Middle East & Africa Market Value ($) and Growth Rate Forecast (2019-2024) Table Middle East & Africa Consumption and Growth Rate Forecast (2019-2024) Figure India Market Value ($) and Growth Rate Forecast (2019-2024) Table India Consumption and Growth Rate Forecast (2019-2024) Figure South America Market Value ($) and Growth Rate Forecast (2019-2024) Table South America Consumption and Growth Rate Forecast (2019-2024) Figure Industry Resource/Technology/Labor Importance Analysis Table New Entrants SWOT Analysis Table New Project Analysis of Investment Recovery
Inquiry For Buying
Instant Milk Tea
Request Sample
Instant Milk Tea