Liquefied Natural Gas (LNG) Market Size, Share, and Trends Analysis Report
CAGR :

| Market Size 2024 (Base Year) | USD 76.54 Billion |
| Market Size 2032 (Forecast Year) | USD 128.88 Billion |
| CAGR | 6.73% |
| Forecast Period | 2025 - 2032 |
| Historical Period | 2020 - 2024 |
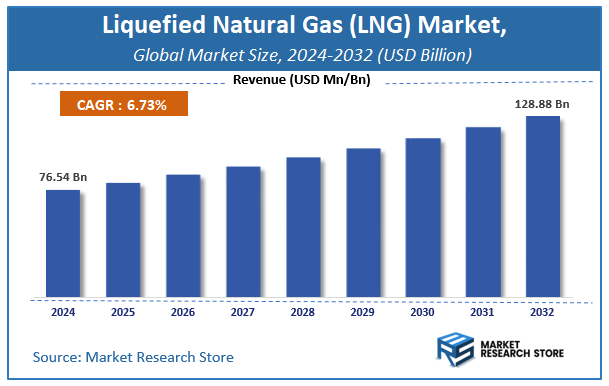
According to a recent study by Market Research Store, the global liquefied natural gas (LNG) market size was valued at approximately USD 76.54 Billion in 2024. The market is projected to grow significantly, reaching USD 128.88 Billion by 2032, growing at a compound annual growth rate (CAGR) of 6.73% during the forecast period from 2024 to 2032. The report highlights key growth drivers such as rising demand, technological advancements, and expanding applications. It also outlines potential challenges like regulatory changes and market competition, while emphasizing emerging opportunities for innovation and investment in the liquefied natural gas (LNG) industry.
Liquefied Natural Gas (LNG) Market: Overview
The growth of the liquefied natural gas (LNG) market is fueled by rising global demand across various industries and applications. The report highlights lucrative opportunities, analyzing cost structures, key segments, emerging trends, regional dynamics, and advancements by leading players to provide comprehensive market insights. The liquefied natural gas (LNG) market report offers a detailed industry analysis from 2024 to 2032, combining quantitative and qualitative insights. It examines key factors such as pricing, market penetration, GDP impact, industry dynamics, major players, consumer behavior, and socio-economic conditions. Structured into multiple sections, the report provides a comprehensive perspective on the market from all angles.
Key sections of the liquefied natural gas (LNG) market report include market segments, outlook, competitive landscape, and company profiles. Market Segments offer in-depth details based on LNG Infrastructure, Lng Trade, and other relevant classifications to support strategic marketing initiatives. Market Outlook thoroughly analyzes market trends, growth drivers, restraints, opportunities, challenges, Porter’s Five Forces framework, macroeconomic factors, value chain analysis, and pricing trends shaping the market now and in the future. The Competitive Landscape and Company Profiles section highlights major players, their strategies, and market positioning to guide investment and business decisions. The report also identifies innovation trends, new business opportunities, and investment prospects for the forecast period.
Key Highlights:
- As per the analysis shared by our research analyst, the global liquefied natural gas (LNG) market is estimated to grow annually at a CAGR of around 6.73% over the forecast period (2025-2032).
- In terms of revenue, the global liquefied natural gas (LNG) market size was valued at around USD 76.54 Billion in 2024 and is projected to reach USD 128.88 Billion by 2032.
- The market is projected to grow at a significant rate due to Growing global energy demand, increasing shift towards cleaner fuels, and rising investments in LNG infrastructure are driving the Liquefied Natural Gas (LNG) market.
- Based on the LNG Infrastructure, the LNG Liquefaction segment is growing at a high rate and will continue to dominate the global market as per industry projections.
- On the basis of Lng Trade, the Import segment is anticipated to command the largest market share.
- Based on region, Asia-Pacific is projected to dominate the global market during the forecast period.
Liquefied Natural Gas (LNG) Market: Report Scope
This report thoroughly analyzes the liquefied natural gas (LNG) market, exploring its historical trends, current state, and future projections. The market estimates presented result from a robust research methodology, incorporating primary research, secondary sources, and expert opinions. These estimates are influenced by the prevailing market dynamics as well as key economic, social, and political factors. Furthermore, the report considers the impact of regulations, government expenditures, and advancements in research and development on the market. Both positive and negative shifts are evaluated to ensure a comprehensive and accurate market outlook.
| Report Attributes | Report Details |
|---|---|
| Report Name | Liquefied Natural Gas (LNG) Market |
| Market Size in 2024 | USD 76.54 Billion |
| Market Forecast in 2032 | USD 128.88 Billion |
| Growth Rate | CAGR of 6.73% |
| Number of Pages | 222 |
| Key Companies Covered | BP, Shell, Chevron, Exxon Mobil, Total, PetroChina, Equinor, Sinopec, Gazprom, Canadian Natural Resources, ConocoPhilips, Eni |
| Segments Covered | By LNG Infrastructure, By Lng Trade, and By Region |
| Regions Covered | North America, Europe, Asia Pacific (APAC), Latin America, The Middle East and Africa (MEA) |
| Base Year | 2024 |
| Historical Year | 2020 to 2024 |
| Forecast Year | 2025 to 2032 |
| Customization Scope | Avail customized purchase options to meet your exact research needs. Request For Customization |
Liquefied Natural Gas (LNG) Market: Dynamics
Key Growth Drivers :
The global LNG market is experiencing robust growth driven by the increasing demand for cleaner energy sources to meet rising energy consumption, particularly in Asia. Rapid industrialization and urbanization in countries like China and India are creating a strong need for reliable and efficient energy, with LNG being a preferred alternative to more polluting fuels like coal and oil. Geopolitical factors and energy security concerns are also major drivers, as nations seek to diversify their energy sources and reduce reliance on pipeline gas from a single supplier. The use of LNG as a marine and heavy-duty transportation fuel is another significant growth area, driven by stricter environmental regulations on emissions.
Restraints :
Despite the positive outlook, the LNG market faces notable restraints. The high capital investment required for building liquefaction, transportation, and regasification infrastructure is a major barrier, especially for new market entrants and developing countries. The market is highly susceptible to geopolitical tensions and global economic conditions, which can cause significant price volatility and disrupt supply chains. Furthermore, the growing momentum toward renewable energy and global decarbonization efforts poses a long-term threat to the LNG market. There is increasing public and regulatory scrutiny over the climate impact of natural gas, particularly regarding methane leaks throughout the supply chain.
Opportunities :
The LNG market is presented with significant opportunities for innovation and expansion. The development of floating LNG (FLNG) terminals and Floating Storage and Regasification Units (FSRUs) is lowering the cost and time required for new projects, making LNG more accessible to a wider range of markets. The growing demand for small-scale LNG solutions for remote power generation and regional transportation networks also offers a new avenue for growth. The development of greener LNG, such as bio-LNG and synthetic LNG, presents a pathway for the industry to align with global sustainability goals. Furthermore, the increasing adoption of digital technologies, such as AI and IoT, can optimize logistics, enhance efficiency, and reduce operational costs across the LNG value chain.
Challenges :
The LNG market faces several critical challenges. The high cost and long lead times of developing new liquefaction projects create a risk of a supply-demand mismatch in the coming years, potentially leading to market oversupply and pricing pressures. Competition from other energy sources, including pipeline gas and, more significantly, rapidly advancing and increasingly cost-competitive renewable energies like solar and wind, poses a long-term challenge to LNG's market share. The industry must also address the environmental challenges associated with its value chain, including methane emissions, to remain a viable and attractive energy source in a carbon-constrained world. Complex and evolving regulatory frameworks in different countries also present a significant hurdle for investment and project development.
Liquefied Natural Gas (LNG) Market: Segmentation Insights
The global liquefied natural gas (LNG) market is segmented based on LNG Infrastructure, Lng Trade, and Region. All the segments of the liquefied natural gas (LNG) market have been analyzed based on present & future trends and the market is estimated from 2024 to 2032.
Based on LNG Infrastructure, the global liquefied natural gas (LNG) market is divided into LNG Liquefaction, LNG Regasification Facilities, LNG Shipping.
On the basis of Lng Trade, the global liquefied natural gas (LNG) market is bifurcated into Import, Export.
Liquefied Natural Gas (LNG) Market: Regional Insights
The Asia-Pacific (APAC) region is the dominant force in the global liquefied natural gas (LNG) market, with Japan, China, and South Korea as the world's top importers. This dominance is driven by substantial energy demand, limited domestic natural gas reserves, and government policies favoring cleaner energy sources to reduce coal dependency. Japan remains the largest importer globally, while China's demand is growing rapidly due to urbanization and industrial needs.
Although North America is a leading exporter due to shale gas production, APAC's immense consumption needs, energy security strategies, and transitioning energy mix solidify its position as the most influential demand-side market governing global LNG trade dynamics.
Liquefied Natural Gas (LNG) Market: Competitive Landscape
The liquefied natural gas (LNG) market report offers a thorough analysis of both established and emerging players within the market. It includes a detailed list of key companies, categorized based on the types of products they offer and other relevant factors. The report also highlights the market entry year for each player, providing further context for the research analysis.
The "Global Liquefied Natural Gas (LNG) Market" study offers valuable insights, focusing on the global market landscape, with an emphasis on major industry players such as;
- BP
- Shell
- Chevron
- Exxon Mobil
- Total
- PetroChina
- Equinor
- Sinopec
- Gazprom
- Canadian Natural Resources
- ConocoPhilips
- Eni
The Global Liquefied Natural Gas (LNG) Market is Segmented as Follows:
By LNG Infrastructure
- LNG Liquefaction
- LNG Regasification Facilities
- LNG Shipping
By Lng Trade
- Import
- Export
By Region
- North America
- The U.S.
- Canada
- Mexico
- Europe
- France
- The UK
- Spain
- Germany
- Italy
- Rest of Europe
- Asia Pacific
- China
- Japan
- India
- Australia
- South Korea
- Rest of Asia Pacific
- The Middle East & Africa
- Saudi Arabia
- UAE
- Egypt
- Kuwait
- South Africa
- Rest of the Middle East & Africa
- Latin America
- Brazil
- Argentina
- Rest of Latin America
Frequently Asked Questions
Table Of Content
Table of Content 1 Report Overview 1.1 Study Scope 1.2 Key Market Segments 1.3 Regulatory Scenario by Region/Country 1.4 Market Investment Scenario Strategic 1.5 Market Analysis by Type 1.5.1 Global Liquefied Natural Gas (LNG) Market Share by Type (2020-2026) 1.5.2 Small Scale Liquefied Natural Gas (LNG) 1.5.3 Medium and Large Scale Liquefied Natural Gas (LNG) 1.6 Market by Application 1.6.1 Global Liquefied Natural Gas (LNG) Market Share by Application (2020-2026) 1.6.2 Power Generation 1.6.3 Transportation Fuel 1.6.4 Mining & Industrial Applications 1.6.5 Others 1.7 Liquefied Natural Gas (LNG) Industry Development Trends under COVID-19 Outbreak 1.7.1 Global COVID-19 Status Overview 1.7.2 Influence of COVID-19 Outbreak on Liquefied Natural Gas (LNG) Industry Development 2. Global Market Growth Trends 2.1 Industry Trends 2.1.1 SWOT Analysis 2.1.2 Porter’s Five Forces Analysis 2.2 Potential Market and Growth Potential Analysis 2.3 Industry News and Policies by Regions 2.3.1 Industry News 2.3.2 Industry Policies 2.4 Industry Trends Under COVID-19 3 Value Chain of Liquefied Natural Gas (LNG) Market 3.1 Value Chain Status 3.2 Liquefied Natural Gas (LNG) Manufacturing Cost Structure Analysis 3.2.1 Production Process Analysis 3.2.2 Manufacturing Cost Structure of Liquefied Natural Gas (LNG) 3.2.3 Labor Cost of Liquefied Natural Gas (LNG) 3.2.3.1 Labor Cost of Liquefied Natural Gas (LNG) Under COVID-19 3.3 Sales and Marketing Model Analysis 3.4 Downstream Major Customer Analysis (by Region) 3.5 Value Chain Status Under COVID-19 4 Players Profiles 4.1 Petronas 4.1.1 Petronas Basic Information 4.1.2 Liquefied Natural Gas (LNG) Product Profiles, Application and Specification 4.1.3 Petronas Liquefied Natural Gas (LNG) Market Performance (2015-2020) 4.1.4 Petronas Business Overview 4.2 Eni 4.2.1 Eni Basic Information 4.2.2 Liquefied Natural Gas (LNG) Product Profiles, Application and Specification 4.2.3 Eni Liquefied Natural Gas (LNG) Market Performance (2015-2020) 4.2.4 Eni Business Overview 4.3 ExxonMobil 4.3.1 ExxonMobil Basic Information 4.3.2 Liquefied Natural Gas (LNG) Product Profiles, Application and Specification 4.3.3 ExxonMobil Liquefied Natural Gas (LNG) Market Performance (2015-2020) 4.3.4 ExxonMobil Business Overview 4.4 Woodfibre LNG 4.4.1 Woodfibre LNG Basic Information 4.4.2 Liquefied Natural Gas (LNG) Product Profiles, Application and Specification 4.4.3 Woodfibre LNG Liquefied Natural Gas (LNG) Market Performance (2015-2020) 4.4.4 Woodfibre LNG Business Overview 4.5 Steelhead LNG 4.5.1 Steelhead LNG Basic Information 4.5.2 Liquefied Natural Gas (LNG) Product Profiles, Application and Specification 4.5.3 Steelhead LNG Liquefied Natural Gas (LNG) Market Performance (2015-2020) 4.5.4 Steelhead LNG Business Overview 4.6 Veresen 4.6.1 Veresen Basic Information 4.6.2 Liquefied Natural Gas (LNG) Product Profiles, Application and Specification 4.6.3 Veresen Liquefied Natural Gas (LNG) Market Performance (2015-2020) 4.6.4 Veresen Business Overview 4.7 Kitsault Energy 4.7.1 Kitsault Energy Basic Information 4.7.2 Liquefied Natural Gas (LNG) Product Profiles, Application and Specification 4.7.3 Kitsault Energy Liquefied Natural Gas (LNG) Market Performance (2015-2020) 4.7.4 Kitsault Energy Business Overview 4.8 Rosneft 4.8.1 Rosneft Basic Information 4.8.2 Liquefied Natural Gas (LNG) Product Profiles, Application and Specification 4.8.3 Rosneft Liquefied Natural Gas (LNG) Market Performance (2015-2020) 4.8.4 Rosneft Business Overview 4.9 Novatek 4.9.1 Novatek Basic Information 4.9.2 Liquefied Natural Gas (LNG) Product Profiles, Application and Specification 4.9.3 Novatek Liquefied Natural Gas (LNG) Market Performance (2015-2020) 4.9.4 Novatek Business Overview 4.10 Freeport Liquefaction LLC 4.10.1 Freeport Liquefaction LLC Basic Information 4.10.2 Liquefied Natural Gas (LNG) Product Profiles, Application and Specification 4.10.3 Freeport Liquefaction LLC Liquefied Natural Gas (LNG) Market Performance (2015-2020) 4.10.4 Freeport Liquefaction LLC Business Overview 4.11 INPEX 4.11.1 INPEX Basic Information 4.11.2 Liquefied Natural Gas (LNG) Product Profiles, Application and Specification 4.11.3 INPEX Liquefied Natural Gas (LNG) Market Performance (2015-2020) 4.11.4 INPEX Business Overview 4.12 NIOC 4.12.1 NIOC Basic Information 4.12.2 Liquefied Natural Gas (LNG) Product Profiles, Application and Specification 4.12.3 NIOC Liquefied Natural Gas (LNG) Market Performance (2015-2020) 4.12.4 NIOC Business Overview 4.13 Next Decade 4.13.1 Next Decade Basic Information 4.13.2 Liquefied Natural Gas (LNG) Product Profiles, Application and Specification 4.13.3 Next Decade Liquefied Natural Gas (LNG) Market Performance (2015-2020) 4.13.4 Next Decade Business Overview 4.14 Total 4.14.1 Total Basic Information 4.14.2 Liquefied Natural Gas (LNG) Product Profiles, Application and Specification 4.14.3 Total Liquefied Natural Gas (LNG) Market Performance (2015-2020) 4.14.4 Total Business Overview 4.15 BP 4.15.1 BP Basic Information 4.15.2 Liquefied Natural Gas (LNG) Product Profiles, Application and Specification 4.15.3 BP Liquefied Natural Gas (LNG) Market Performance (2015-2020) 4.15.4 BP Business Overview 4.16 ConocoPhillips 4.16.1 ConocoPhillips Basic Information 4.16.2 Liquefied Natural Gas (LNG) Product Profiles, Application and Specification 4.16.3 ConocoPhillips Liquefied Natural Gas (LNG) Market Performance (2015-2020) 4.16.4 ConocoPhillips Business Overview 4.17 Gazprom 4.17.1 Gazprom Basic Information 4.17.2 Liquefied Natural Gas (LNG) Product Profiles, Application and Specification 4.17.3 Gazprom Liquefied Natural Gas (LNG) Market Performance (2015-2020) 4.17.4 Gazprom Business Overview 4.18 China National Petroleum Corporation 4.18.1 China National Petroleum Corporation Basic Information 4.18.2 Liquefied Natural Gas (LNG) Product Profiles, Application and Specification 4.18.3 China National Petroleum Corporation Liquefied Natural Gas (LNG) Market Performance (2015-2020) 4.18.4 China National Petroleum Corporation Business Overview 4.19 Sempra Energy 4.19.1 Sempra Energy Basic Information 4.19.2 Liquefied Natural Gas (LNG) Product Profiles, Application and Specification 4.19.3 Sempra Energy Liquefied Natural Gas (LNG) Market Performance (2015-2020) 4.19.4 Sempra Energy Business Overview 4.20 Statoil 4.20.1 Statoil Basic Information 4.20.2 Liquefied Natural Gas (LNG) Product Profiles, Application and Specification 4.20.3 Statoil Liquefied Natural Gas (LNG) Market Performance (2015-2020) 4.20.4 Statoil Business Overview 4.21 Stewart Energy 4.21.1 Stewart Energy Basic Information 4.21.2 Liquefied Natural Gas (LNG) Product Profiles, Application and Specification 4.21.3 Stewart Energy Liquefied Natural Gas (LNG) Market Performance (2015-2020) 4.21.4 Stewart Energy Business Overview 4.22 Woodside 4.22.1 Woodside Basic Information 4.22.2 Liquefied Natural Gas (LNG) Product Profiles, Application and Specification 4.22.3 Woodside Liquefied Natural Gas (LNG) Market Performance (2015-2020) 4.22.4 Woodside Business Overview 4.23 Chevron 4.23.1 Chevron Basic Information 4.23.2 Liquefied Natural Gas (LNG) Product Profiles, Application and Specification 4.23.3 Chevron Liquefied Natural Gas (LNG) Market Performance (2015-2020) 4.23.4 Chevron Business Overview 4.24 Royal Dutch Shell 4.24.1 Royal Dutch Shell Basic Information 4.24.2 Liquefied Natural Gas (LNG) Product Profiles, Application and Specification 4.24.3 Royal Dutch Shell Liquefied Natural Gas (LNG) Market Performance (2015-2020) 4.24.4 Royal Dutch Shell Business Overview 5 Global Liquefied Natural Gas (LNG) Market Analysis by Regions 5.1 Global Liquefied Natural Gas (LNG) Sales, Revenue and Market Share by Regions 5.1.1 Global Liquefied Natural Gas (LNG) Sales by Regions (2015-2020) 5.1.2 Global Liquefied Natural Gas (LNG) Revenue by Regions (2015-2020) 5.2 North America Liquefied Natural Gas (LNG) Sales and Growth Rate (2015-2020) 5.3 Europe Liquefied Natural Gas (LNG) Sales and Growth Rate (2015-2020) 5.4 Asia-Pacific Liquefied Natural Gas (LNG) Sales and Growth Rate (2015-2020) 5.5 Middle East and Africa Liquefied Natural Gas (LNG) Sales and Growth Rate (2015-2020) 5.6 South America Liquefied Natural Gas (LNG) Sales and Growth Rate (2015-2020) 6 North America Liquefied Natural Gas (LNG) Market Analysis by Countries 6.1 North America Liquefied Natural Gas (LNG) Sales, Revenue and Market Share by Countries 6.1.1 North America Liquefied Natural Gas (LNG) Sales by Countries (2015-2020) 6.1.2 North America Liquefied Natural Gas (LNG) Revenue by Countries (2015-2020) 6.1.3 North America Liquefied Natural Gas (LNG) Market Under COVID-19 6.2 United States Liquefied Natural Gas (LNG) Sales and Growth Rate (2015-2020) 6.2.1 United States Liquefied Natural Gas (LNG) Market Under COVID-19 6.3 Canada Liquefied Natural Gas (LNG) Sales and Growth Rate (2015-2020) 6.4 Mexico Liquefied Natural Gas (LNG) Sales and Growth Rate (2015-2020) 7 Europe Liquefied Natural Gas (LNG) Market Analysis by Countries 7.1 Europe Liquefied Natural Gas (LNG) Sales, Revenue and Market Share by Countries 7.1.1 Europe Liquefied Natural Gas (LNG) Sales by Countries (2015-2020) 7.1.2 Europe Liquefied Natural Gas (LNG) Revenue by Countries (2015-2020) 7.1.3 Europe Liquefied Natural Gas (LNG) Market Under COVID-19 7.2 Germany Liquefied Natural Gas (LNG) Sales and Growth Rate (2015-2020) 7.2.1 Germany Liquefied Natural Gas (LNG) Market Under COVID-19 7.3 UK Liquefied Natural Gas (LNG) Sales and Growth Rate (2015-2020) 7.3.1 UK Liquefied Natural Gas (LNG) Market Under COVID-19 7.4 France Liquefied Natural Gas (LNG) Sales and Growth Rate (2015-2020) 7.4.1 France Liquefied Natural Gas (LNG) Market Under COVID-19 7.5 Italy Liquefied Natural Gas (LNG) Sales and Growth Rate (2015-2020) 7.5.1 Italy Liquefied Natural Gas (LNG) Market Under COVID-19 7.6 Spain Liquefied Natural Gas (LNG) Sales and Growth Rate (2015-2020) 7.6.1 Spain Liquefied Natural Gas (LNG) Market Under COVID-19 7.7 Russia Liquefied Natural Gas (LNG) Sales and Growth Rate (2015-2020) 7.7.1 Russia Liquefied Natural Gas (LNG) Market Under COVID-19 8 Asia-Pacific Liquefied Natural Gas (LNG) Market Analysis by Countries 8.1 Asia-Pacific Liquefied Natural Gas (LNG) Sales, Revenue and Market Share by Countries 8.1.1 Asia-Pacific Liquefied Natural Gas (LNG) Sales by Countries (2015-2020) 8.1.2 Asia-Pacific Liquefied Natural Gas (LNG) Revenue by Countries (2015-2020) 8.1.3 Asia-Pacific Liquefied Natural Gas (LNG) Market Under COVID-19 8.2 China Liquefied Natural Gas (LNG) Sales and Growth Rate (2015-2020) 8.2.1 China Liquefied Natural Gas (LNG) Market Under COVID-19 8.3 Japan Liquefied Natural Gas (LNG) Sales and Growth Rate (2015-2020) 8.3.1 Japan Liquefied Natural Gas (LNG) Market Under COVID-19 8.4 South Korea Liquefied Natural Gas (LNG) Sales and Growth Rate (2015-2020) 8.4.1 South Korea Liquefied Natural Gas (LNG) Market Under COVID-19 8.5 Australia Liquefied Natural Gas (LNG) Sales and Growth Rate (2015-2020) 8.6 India Liquefied Natural Gas (LNG) Sales and Growth Rate (2015-2020) 8.6.1 India Liquefied Natural Gas (LNG) Market Under COVID-19 8.7 Southeast Asia Liquefied Natural Gas (LNG) Sales and Growth Rate (2015-2020) 8.7.1 Southeast Asia Liquefied Natural Gas (LNG) Market Under COVID-19 9 Middle East and Africa Liquefied Natural Gas (LNG) Market Analysis by Countries 9.1 Middle East and Africa Liquefied Natural Gas (LNG) Sales, Revenue and Market Share by Countries 9.1.1 Middle East and Africa Liquefied Natural Gas (LNG) Sales by Countries (2015-2020) 9.1.2 Middle East and Africa Liquefied Natural Gas (LNG) Revenue by Countries (2015-2020) 9.1.3 Middle East and Africa Liquefied Natural Gas (LNG) Market Under COVID-19 9.2 Saudi Arabia Liquefied Natural Gas (LNG) Sales and Growth Rate (2015-2020) 9.3 UAE Liquefied Natural Gas (LNG) Sales and Growth Rate (2015-2020) 9.4 Egypt Liquefied Natural Gas (LNG) Sales and Growth Rate (2015-2020) 9.5 Nigeria Liquefied Natural Gas (LNG) Sales and Growth Rate (2015-2020) 9.6 South Africa Liquefied Natural Gas (LNG) Sales and Growth Rate (2015-2020) 10 South America Liquefied Natural Gas (LNG) Market Analysis by Countries 10.1 South America Liquefied Natural Gas (LNG) Sales, Revenue and Market Share by Countries 10.1.1 South America Liquefied Natural Gas (LNG) Sales by Countries (2015-2020) 10.1.2 South America Liquefied Natural Gas (LNG) Revenue by Countries (2015-2020) 10.1.3 South America Liquefied Natural Gas (LNG) Market Under COVID-19 10.2 Brazil Liquefied Natural Gas (LNG) Sales and Growth Rate (2015-2020) 10.2.1 Brazil Liquefied Natural Gas (LNG) Market Under COVID-19 10.3 Argentina Liquefied Natural Gas (LNG) Sales and Growth Rate (2015-2020) 10.4 Columbia Liquefied Natural Gas (LNG) Sales and Growth Rate (2015-2020) 10.5 Chile Liquefied Natural Gas (LNG) Sales and Growth Rate (2015-2020) 11 Global Liquefied Natural Gas (LNG) Market Segment by Types 11.1 Global Liquefied Natural Gas (LNG) Sales, Revenue and Market Share by Types (2015-2020) 11.1.1 Global Liquefied Natural Gas (LNG) Sales and Market Share by Types (2015-2020) 11.1.2 Global Liquefied Natural Gas (LNG) Revenue and Market Share by Types (2015-2020) 11.2 Small Scale Liquefied Natural Gas (LNG) Sales and Price (2015-2020) 11.3 Medium and Large Scale Liquefied Natural Gas (LNG) Sales and Price (2015-2020) 12 Global Liquefied Natural Gas (LNG) Market Segment by Applications 12.1 Global Liquefied Natural Gas (LNG) Sales, Revenue and Market Share by Applications (2015-2020) 12.1.1 Global Liquefied Natural Gas (LNG) Sales and Market Share by Applications (2015-2020) 12.1.2 Global Liquefied Natural Gas (LNG) Revenue and Market Share by Applications (2015-2020) 12.2 Power Generation Sales, Revenue and Growth Rate (2015-2020) 12.3 Transportation Fuel Sales, Revenue and Growth Rate (2015-2020) 12.4 Mining & Industrial Applications Sales, Revenue and Growth Rate (2015-2020) 12.5 Others Sales, Revenue and Growth Rate (2015-2020) 13 Liquefied Natural Gas (LNG) Market Forecast by Regions (2020-2026) 13.1 Global Liquefied Natural Gas (LNG) Sales, Revenue and Growth Rate (2020-2026) 13.2 Liquefied Natural Gas (LNG) Market Forecast by Regions (2020-2026) 13.2.1 North America Liquefied Natural Gas (LNG) Market Forecast (2020-2026) 13.2.2 Europe Liquefied Natural Gas (LNG) Market Forecast (2020-2026) 13.2.3 Asia-Pacific Liquefied Natural Gas (LNG) Market Forecast (2020-2026) 13.2.4 Middle East and Africa Liquefied Natural Gas (LNG) Market Forecast (2020-2026) 13.2.5 South America Liquefied Natural Gas (LNG) Market Forecast (2020-2026) 13.3 Liquefied Natural Gas (LNG) Market Forecast by Types (2020-2026) 13.4 Liquefied Natural Gas (LNG) Market Forecast by Applications (2020-2026) 13.5 Liquefied Natural Gas (LNG) Market Forecast Under COVID-19 14 Appendix 14.1 Methodology 14.2 Research Data Source
Inquiry For Buying
Liquefied Natural Gas (LNG)
Request Sample
Liquefied Natural Gas (LNG)