Night Vision (Ir) Surveillance Cameras Market Size, Share, and Trends Analysis Report
CAGR :

| Market Size 2023 (Base Year) | USD 16.56 Billion |
| Market Size 2032 (Forecast Year) | USD 35.08 Billion |
| CAGR | 8.7% |
| Forecast Period | 2024 - 2032 |
| Historical Period | 2018 - 2023 |
Night Vision (Ir) Surveillance Cameras Market Insights
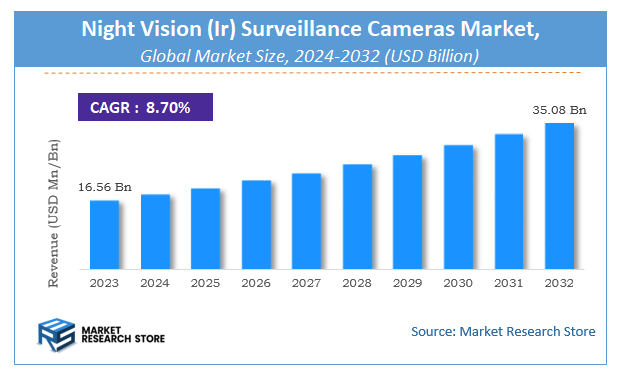
A latest report by Market Research Store estimates that the Global Night Vision (Ir) Surveillance Cameras Market was valued at USD 16.56 Billion in 2023 and is expected to reach USD 35.08 Billion by 2032, with a CAGR of 8.7% during the forecast period 2024-2032. The report Night Vision (Ir) Surveillance Cameras Market overview, growth factors, restraints, opportunities, segmentation, key developments, competitive landscape, consumer insights, and market growth forecast in terms of value or volume. These structured details offer an all-inclusive market overview, providing valuable insights for investment decisions, business decisions, strategic planning, and competitive analysis.
Night Vision (Ir) Surveillance Cameras Market: Overview
The growth of the night vision (IR) surveillance cameras market is fueled by rising global demand across various industries and applications. The report highlights lucrative opportunities, analyzing cost structures, key segments, emerging trends, regional dynamics, and advancements by leading players to provide comprehensive market insights. The night vision (IR) surveillance cameras market report offers a detailed industry analysis from 2024 to 2032, combining quantitative and qualitative insights. It examines key factors such as pricing, market penetration, GDP impact, industry dynamics, major players, consumer behavior, and socio-economic conditions. Structured into multiple sections, the report provides a comprehensive perspective on the market from all angles.
Key sections of the night vision (IR) surveillance cameras market report include market segments, outlook, competitive landscape, and company profiles. Market Segments offer in-depth details based on Product Type, Technology, Application, Resolution, Distribution Channel, and other relevant classifications to support strategic marketing initiatives. Market Outlook thoroughly analyzes market trends, growth drivers, restraints, opportunities, challenges, Porter’s Five Forces framework, macroeconomic factors, value chain analysis, and pricing trends shaping the market now and in the future. The Competitive Landscape and Company Profiles section highlights major players, their strategies, and market positioning to guide investment and business decisions. The report also identifies innovation trends, new business opportunities, and investment prospects for the forecast period.
Key Highlights:
- As per the analysis shared by our research analyst, the global night vision (IR) surveillance cameras market is estimated to grow annually at a CAGR of around 8.7% over the forecast period (2024-2032).
- In terms of revenue, the global night vision (IR) surveillance cameras market size was valued at around USD 16.56 Billion in 2023 and is projected to reach USD 35.08 Billion by 2032.
- The market is projected to grow at a significant rate due to rising security concerns, increasing demand for 24/7 surveillance, and advancements in infrared imaging technology for enhanced low-light performance.
- Based on the Product Type, the Fixed Cameras segment is growing at a high rate and will continue to dominate the global market as per industry projections.
- On the basis of Technology, the Analog segment is anticipated to command the largest market share.
- In terms of Application, the Residential segment is projected to lead the global market.
- By Resolution, the HD segment is predicted to dominate the global market.
- Based on the Distribution Channel, the Online Stores segment is expected to swipe the largest market share.
- Based on region, North America is projected to dominate the global market during the forecast period.
Night Vision (Ir) Surveillance Cameras Market: Report Scope
This report thoroughly analyzes the night vision (IR) surveillance cameras market, exploring its historical trends, current state, and future projections. The market estimates presented result from a robust research methodology, incorporating primary research, secondary sources, and expert opinions. These estimates are influenced by the prevailing market dynamics as well as key economic, social, and political factors. Furthermore, the report considers the impact of regulations, government expenditures, and advancements in research and development on the market. Both positive and negative shifts are evaluated to ensure a comprehensive and accurate market outlook.
| Report Attributes | Report Details |
|---|---|
| Report Name | Night Vision (Ir) Surveillance Cameras Market |
| Market Size in 2023 | USD 16.56 Billion |
| Market Forecast in 2032 | USD 35.08 Billion |
| Growth Rate | CAGR of 8.7% |
| Number of Pages | 190 |
| Key Companies Covered | FLIR Systems, BAE Systems, Raytheon, L-3 Communications, Samsung Electronics, Axis Communications, Lorex Technology, Robert Bosch, Sony, Logitech, United Vision Security Systems, Kintronics, Hikvision Digital Technology, Pelco |
| Segments Covered | By Product Type, By Technology, By Application, By Resolution, By Distribution Channel, and By Region |
| Regions Covered | North America, Europe, Asia Pacific (APAC), Latin America, Middle East, and Africa (MEA) |
| Base Year | 2023 |
| Historical Year | 2018 to 2023 |
| Forecast Year | 2024 to 2032 |
| Customization Scope | Avail customized purchase options to meet your exact research needs. Request For Customization |
Night Vision (Ir) Surveillance Cameras Market: Dynamics
Key Growth Drivers:
The night vision (IR) surveillance camera market is experiencing robust growth, primarily driven by the escalating demand for 24/7 security and surveillance solutions. The need for reliable monitoring in low-light or no-light conditions across residential, commercial, and industrial sectors is a major catalyst. Technological advancements in infrared (IR) illumination, image processing, and sensor technology are significantly enhancing camera performance and range. The increasing adoption of smart home security systems and the integration of IR cameras with other IoT devices are further fueling market expansion. Additionally, the growing use of IR surveillance cameras in law enforcement, border security, and military applications contributes to market growth.
Restraints:
Despite the market's positive trajectory, several restraints impede its full potential. The high cost of advanced IR cameras, particularly those with long-range illumination and high-resolution imaging, can deter some consumers and businesses. Concerns regarding the accuracy and reliability of IR cameras in challenging environmental conditions, such as fog, rain, and snow, pose significant challenges. The potential for IR cameras to be detected or circumvented by sophisticated adversaries creates security vulnerabilities. Furthermore, the lack of standardized protocols and interoperability between different IR camera systems can create integration issues. The regulatory complexities associated with data privacy and the use of surveillance footage can also hinder market growth.
Opportunities:
The night vision (IR) surveillance cameras market presents numerous opportunities for innovation and expansion. The development of AI-powered IR cameras with advanced analytics, such as object recognition, behavioral analysis, and thermal imaging, can enhance security and automation applications. The integration of 5G and edge computing technologies can enable real-time video processing and low-latency data transmission. The growing demand for wireless and battery-powered IR cameras for flexible deployment and remote monitoring offers significant growth potential. The expansion of IR camera applications in emerging sectors, such as autonomous vehicles, drone surveillance, and wildlife monitoring, provides new market segments. Furthermore, the development of cost-effective and scalable IR camera solutions for small businesses and residential applications can broaden market reach.
Challenges:
The night vision (IR) surveillance cameras market faces several challenges that require strategic solutions. Ensuring robust cybersecurity measures and protecting sensitive video data from unauthorized access is crucial. Maintaining high image quality and reliable performance in diverse environmental conditions and lighting scenarios is essential. Adapting to the evolving regulatory landscape and ensuring compliance with data privacy and surveillance regulations across different regions is paramount. Managing the complexities of integrating IR cameras with diverse network infrastructures and IoT ecosystems is critical. Additionally, addressing public concerns regarding privacy and promoting responsible use of surveillance technology is paramount.
Night Vision (Ir) Surveillance Cameras Market: Segmentation Insights
The global night vision (IR) surveillance cameras market is segmented based on Product Type, Technology, Application, Resolution, Distribution Channel, and Region. All the segments of the night vision (IR) surveillance cameras market have been analyzed based on present & future trends and the market is estimated from 2024 to 2032.
Based on Product Type, the global night vision (IR) surveillance cameras market is divided into Fixed Cameras, PTZ Cameras, Dome Cameras, Bullet Cameras, Others.
On the basis of Technology, the global night vision (IR) surveillance cameras market is bifurcated into Analog, IP-based.
In terms of Application, the global night vision (IR) surveillance cameras market is categorized into Residential, Commercial, Industrial, Government and Defense, Others.
Based on Resolution, the global night vision (IR) surveillance cameras market is split into HD, Full HD, 4K, Others.
By Distribution Channel, the global night vision (IR) surveillance cameras market is divided into Online Stores, Offline Stores.
Night Vision (Ir) Surveillance Cameras Market: Regional Insights
The Asia-Pacific (APAC) region dominates the global night vision (IR) surveillance cameras market, holding the largest share due to rising security concerns, government investments in public safety, and the rapid expansion of smart city projects. China is the largest contributor, driven by widespread adoption of advanced surveillance systems, strong manufacturing capabilities, and increasing deployment of AI-powered IR cameras. According to recent market data, APAC accounted for over 45% of the global night vision camera market in 2023, with India and Japan also showing significant growth due to rising urban security demands.
North America follows closely, led by the U.S., where high defense and law enforcement spending boosts IR camera adoption. Europe remains a key market, with strict security regulations and increasing demand for thermal imaging in critical infrastructure. The Middle East & Africa and Latin America are emerging markets, driven by growing security investments in oil & gas and transportation sectors. APAC’s dominance is expected to continue, supported by technological advancements and expanding infrastructure surveillance needs.
Night Vision (Ir) Surveillance Cameras Market: Competitive Landscape
The night vision (IR) surveillance cameras market Report offers a thorough analysis of both established and emerging players within the market. It includes a detailed list of key companies, categorized based on the types of products they offer and other relevant factors. The report also highlights the market entry year for each player, providing further context for the research analysis.
The "Global Night Vision (Ir) Surveillance Cameras Market" study offers valuable insights, focusing on the global market landscape, with an emphasis on major industry players such as;
- FLIR Systems
- BAE Systems
- Raytheon
- L-3 Communications
- Samsung Electronics
- Axis Communications
- Lorex Technology
- Robert Bosch
- Sony
- Logitech
- United Vision Security Systems
- Kintronics
- Hikvision Digital Technology
- Pelco
The Global Night Vision (Ir) Surveillance Cameras Market is Segmented as Follows:
By Product Type
- Fixed Cameras
- PTZ Cameras
- Dome Cameras
- Bullet Cameras
- Others
By Technology
- Analog
- IP-based
By Application
- Residential
- Commercial
- Industrial
- Government and Defense
- Others
By Resolution
- HD
- Full HD
- 4K
- Others
By Distribution Channel
- Online Stores
- Offline Stores
By Region
- North America
- The U.S.
- Canada
- Mexico
- Europe
- France
- The UK
- Spain
- Germany
- Italy
- Rest of Europe
- Asia Pacific
- China
- Japan
- India
- Australia
- South Korea
- Rest of Asia Pacific
- The Middle East & Africa
- Saudi Arabia
- UAE
- Egypt
- Kuwait
- South Africa
- Rest of the Middle East & Africa
- Latin America
- Brazil
- Argentina
- Rest of Latin America
Market Evolution
This section evaluates the market position of the product or service by examining its development pathway and competitive dynamics. It provides a detailed overview of the product's growth stages, including the early (historical) phase, the mid-stage, and anticipated future advancements influenced by innovation and emerging technologies.
Porter’s Analysis
Porter’s Five Forces framework offers a strategic lens for assessing competitor behavior and the positioning of key players in the night vision (IR) surveillance cameras industry. This section explores the external factors shaping competitive dynamics and influencing market strategies in the years ahead. The analysis focuses on five critical forces:
- Competitive Rivalry
- Threat of New Entrants
- Threat of Substitutes
- Supplier Bargaining Power
- Buyer Bargaining Power
Value Chain & Market Attractiveness Analysis
The value chain analysis helps businesses optimize operations by mapping the product flow from suppliers to end consumers, identifying opportunities to streamline processes and gain a competitive edge. Segment-wise market attractiveness analysis evaluates key dimensions like product categories, demographics, and regions, assessing growth potential, market size, and profitability. This enables businesses to focus resources on high-potential segments for better ROI and long-term value.
PESTEL Analysis
PESTEL analysis is a powerful tool in market research reports that enhances market understanding by systematically examining the external macro-environmental factors influencing a business or industry. The acronym stands for Political, Economic, Social, Technological, Environmental, and Legal factors. By evaluating these dimensions, PESTEL analysis provides a comprehensive overview of the broader context within which a market operates, helping businesses identify potential opportunities and threats.
- Political factors assess government policies, stability, trade regulations, and political risks that could impact market operations.
- Economic factors examine variables like inflation, exchange rates, economic growth, and consumer spending power to determine market viability.
- Social factors explore cultural trends, demographics, and lifestyle changes that shape consumer behavior and preferences.
- Technological factors evaluate innovation, R&D, and technological advancements affecting product development and operational efficiencies.
- Environmental factors focus on sustainability, climate change impacts, and eco-friendly practices shaping market trends.
- Legal factors address compliance requirements, industry regulations, and intellectual property laws impacting market entry and operations.
Import-Export Analysis & Pricing Analysis
An import-export analysis is vital for market research, revealing global trade dynamics, trends, and opportunities. It examines trade volumes, product categories, and regional competitiveness, offering insights into supply chains and market demand. This section also analyzes past and future pricing trends, helping businesses optimize strategies and enabling consumers to assess product value effectively.
Night Vision (Ir) Surveillance Cameras Market: Company Profiles
The report identifies key players in the night vision (IR) surveillance cameras market through a competitive landscape and company profiles, evaluating their offerings, financial performance, strategies, and market positioning. It includes a SWOT analysis of the top 3-5 companies, assessing strengths, weaknesses, opportunities, and threats. The competitive landscape highlights rankings, recent activities (mergers, acquisitions, partnerships, product launches), and regional footprints using the Ace matrix. Customization is available to meet client-specific needs.
Regional & Industry Footprint
This section details the geographic reach, sales networks, and market penetration of companies profiled in the night vision (IR) surveillance cameras report, showcasing their operations and distribution across regions. It analyzes the alignment of companies with specific industry verticals, highlighting the industries they serve and the scope of their products and services within those sectors.
Ace Matrix
This section categorizes companies into four distinct groups—Active, Cutting Edge, Innovator, and Emerging—based on their product and business strategies. The evaluation of product strategy focuses on aspects such as the range and depth of offerings, commitment to innovation, product functionalities, and scalability. Key elements like global reach, sector coverage, strategic acquisitions, and long-term growth plans are considered for business strategy. This analysis provides a detailed view of companies' position within the market and highlights their potential for future growth and development.
Research Methodology
The qualitative and quantitative insights for the night vision (IR) surveillance cameras market are derived through a multi-faceted research approach, combining input from subject matter experts, primary research, and secondary data sources. Primary research includes gathering critical information via face-to-face or telephonic interviews, surveys, questionnaires, and feedback from industry professionals, key opinion leaders (KOLs), and customers. Regular interviews with industry experts are conducted to deepen the analysis and reinforce the existing data, ensuring a robust and well-rounded market understanding.
Secondary research for this report was carried out by the Market Research Store team, drawing on a variety of authoritative sources, such as:
- Official company websites, annual reports, financial statements, investor presentations, and SEC filings
- Internal and external proprietary databases, as well as relevant patent and regulatory databases
- Government publications, national statistical databases, and industry-specific market reports
- Media coverage, including news articles, press releases, and webcasts about market participants
- Paid industry databases for detailed market insights
Market Research Store conducted in-depth consultations with various key opinion leaders in the industry, including senior executives from top companies and regional leaders from end-user organizations. This effort aimed to gather critical insights on factors such as the market share of dominant brands in specific countries and regions, along with pricing strategies for products and services.
To determine total sales data, the research team conducted primary interviews across multiple countries with influential stakeholders, including:
- Distributors
- Marketing, Brand, and Product Managers
- Procurement and Production Managers
- Sales and Regional Sales Managers, Country Managers
- Technical Specialists
- C-Level Executives
These subject matter experts, with their extensive industry experience, helped validate and refine the findings. For secondary research, data were sourced from a wide range of materials, including online resources, company annual reports, industry publications, research papers, association reports, and government websites. These various sources provide a comprehensive and well-rounded perspective on the market.
Frequently Asked Questions
Table Of Content
List of Tables and Figures Figure Product Picture of Night Vision (Ir) Surveillance Cameras Table Product Specification of Night Vision (Ir) Surveillance Cameras Figure Market Concentration Ratio and Market Maturity Analysis of Night Vision (Ir) Surveillance Cameras Figure Global Night Vision (Ir) Surveillance Cameras Value ($) and Growth Rate from 2014-2024 Table Different Types of Night Vision (Ir) Surveillance Cameras Figure Global Night Vision (Ir) Surveillance Cameras Value ($) Segment by Type from 2014-2019 Figure Fixed Cameras Picture Figure PTZ Cameras Picture Table Different Applications of Night Vision (Ir) Surveillance Cameras Figure Global Night Vision (Ir) Surveillance Cameras Value ($) Segment by Applications from 2014-2019 Figure Public Sector and Defense Picture Figure Retail Picture Figure Transportation Picture Figure Industrial Picture Figure Stadiums Picture Figure Business Organizations Picture Figure Others (Hospitality, Education,etc) Picture Table Research Regions of Night Vision (Ir) Surveillance Cameras Figure North America Night Vision (Ir) Surveillance Cameras Production Value ($) and Growth Rate (2014-2019) Figure Europe Night Vision (Ir) Surveillance Cameras Production Value ($) and Growth Rate (2014-2019) Table China Night Vision (Ir) Surveillance Cameras Production Value ($) and Growth Rate (2014-2019) Table Japan Night Vision (Ir) Surveillance Cameras Production Value ($) and Growth Rate (2014-2019) Table Middle East & Africa Night Vision (Ir) Surveillance Cameras Production Value ($) and Growth Rate (2014-2019) Table India Night Vision (Ir) Surveillance Cameras Production Value ($) and Growth Rate (2014-2019) Table South America Night Vision (Ir) Surveillance Cameras Production Value ($) and Growth Rate (2014-2019) Table Emerging Countries of Night Vision (Ir) Surveillance Cameras Table Growing Market of Night Vision (Ir) Surveillance Cameras Figure Industry Chain Analysis of Night Vision (Ir) Surveillance Cameras Table Upstream Raw Material Suppliers of Night Vision (Ir) Surveillance Cameras with Contact Information Table Major Players Manufacturing Base and Market Share ($) of Night Vision (Ir) Surveillance Cameras in 2018 Table Major Players Night Vision (Ir) Surveillance Cameras Product Types in 2018 Figure Production Process of Night Vision (Ir) Surveillance Cameras Figure Manufacturing Cost Structure of Night Vision (Ir) Surveillance Cameras Figure Channel Status of Night Vision (Ir) Surveillance Cameras Table Major Distributors of Night Vision (Ir) Surveillance Cameras with Contact Information Table Major Downstream Buyers of Night Vision (Ir) Surveillance Cameras with Contact Information Table Global Night Vision (Ir) Surveillance Cameras Value ($) by Type (2014-2019) Table Global Night Vision (Ir) Surveillance Cameras Value ($) Share by Type (2014-2019) Figure Global Night Vision (Ir) Surveillance Cameras Value ($) Share by Type (2014-2019) Table Global Night Vision (Ir) Surveillance Cameras Production by Type (2014-2019) Table Global Night Vision (Ir) Surveillance Cameras Production Share by Type (2014-2019) Figure Global Night Vision (Ir) Surveillance Cameras Production Share by Type (2014-2019) Figure Global Night Vision (Ir) Surveillance Cameras Value ($) and Growth Rate of Fixed Cameras Figure Global Night Vision (Ir) Surveillance Cameras Value ($) and Growth Rate of PTZ Cameras Figure Global Night Vision (Ir) Surveillance Cameras Price by Type (2014-2019) Table Global Night Vision (Ir) Surveillance Cameras Consumption by Application (2014-2019) Table Global Night Vision (Ir) Surveillance Cameras Consumption Market Share by Application (2014-2019) Figure Global Night Vision (Ir) Surveillance Cameras Consumption Market Share by Application (2014-2019) Table Downstream Buyers Introduction by Application Figure Global Night Vision (Ir) Surveillance Cameras Consumption and Growth Rate of Public Sector and Defense (2014-2019) Figure Global Night Vision (Ir) Surveillance Cameras Consumption and Growth Rate of Retail (2014-2019) Figure Global Night Vision (Ir) Surveillance Cameras Consumption and Growth Rate of Transportation (2014-2019) Figure Global Night Vision (Ir) Surveillance Cameras Consumption and Growth Rate of Industrial (2014-2019) Figure Global Night Vision (Ir) Surveillance Cameras Consumption and Growth Rate of Stadiums (2014-2019) Figure Global Night Vision (Ir) Surveillance Cameras Consumption and Growth Rate of Business Organizations (2014-2019) Figure Global Night Vision (Ir) Surveillance Cameras Consumption and Growth Rate of Others (Hospitality, Education,etc) (2014-2019) Table Global Night Vision (Ir) Surveillance Cameras Value ($) by Region (2014-2019) Table Global Night Vision (Ir) Surveillance Cameras Value ($) Market Share by Region (2014-2019) Figure Global Night Vision (Ir) Surveillance Cameras Value ($) Market Share by Region (2014-2019) Table Global Night Vision (Ir) Surveillance Cameras Production by Region (2014-2019) Table Global Night Vision (Ir) Surveillance Cameras Production Market Share by Region (2014-2019) Figure Global Night Vision (Ir) Surveillance Cameras Production Market Share by Region (2014-2019) Table Global Night Vision (Ir) Surveillance Cameras Production, Value ($), Price and Gross Margin (2014-2019) Table North America Night Vision (Ir) Surveillance Cameras Production, Value ($), Price and Gross Margin (2014-2019) Table Europe Night Vision (Ir) Surveillance Cameras Production, Value ($), Price and Gross Margin (2014-2019) Table China Night Vision (Ir) Surveillance Cameras Production, Value ($), Price and Gross Margin (2014-2019) Table Japan Night Vision (Ir) Surveillance Cameras Production, Value ($), Price and Gross Margin (2014-2019) Table Middle East & Africa Night Vision (Ir) Surveillance Cameras Production, Value ($), Price and Gross Margin (2014-2019) Table India Night Vision (Ir) Surveillance Cameras Production, Value ($), Price and Gross Margin (2014-2019) Table South America Night Vision (Ir) Surveillance Cameras Production, Value ($), Price and Gross Margin (2014-2019) Table Global Night Vision (Ir) Surveillance Cameras Consumption by Regions (2014-2019) Figure Global Night Vision (Ir) Surveillance Cameras Consumption Share by Regions (2014-2019) Table North America Night Vision (Ir) Surveillance Cameras Production, Consumption, Export, Import (2014-2019) Table Europe Night Vision (Ir) Surveillance Cameras Production, Consumption, Export, Import (2014-2019) Table China Night Vision (Ir) Surveillance Cameras Production, Consumption, Export, Import (2014-2019) Table Japan Night Vision (Ir) Surveillance Cameras Production, Consumption, Export, Import (2014-2019) Table Middle East & Africa Night Vision (Ir) Surveillance Cameras Production, Consumption, Export, Import (2014-2019) Table India Night Vision (Ir) Surveillance Cameras Production, Consumption, Export, Import (2014-2019) Table South America Night Vision (Ir) Surveillance Cameras Production, Consumption, Export, Import (2014-2019) Figure North America Night Vision (Ir) Surveillance Cameras Production and Growth Rate Analysis Figure North America Night Vision (Ir) Surveillance Cameras Consumption and Growth Rate Analysis Figure North America Night Vision (Ir) Surveillance Cameras SWOT Analysis Figure Europe Night Vision (Ir) Surveillance Cameras Production and Growth Rate Analysis Figure Europe Night Vision (Ir) Surveillance Cameras Consumption and Growth Rate Analysis Figure Europe Night Vision (Ir) Surveillance Cameras SWOT Analysis Figure China Night Vision (Ir) Surveillance Cameras Production and Growth Rate Analysis Figure China Night Vision (Ir) Surveillance Cameras Consumption and Growth Rate Analysis Figure China Night Vision (Ir) Surveillance Cameras SWOT Analysis Figure Japan Night Vision (Ir) Surveillance Cameras Production and Growth Rate Analysis Figure Japan Night Vision (Ir) Surveillance Cameras Consumption and Growth Rate Analysis Figure Japan Night Vision (Ir) Surveillance Cameras SWOT Analysis Figure Middle East & Africa Night Vision (Ir) Surveillance Cameras Production and Growth Rate Analysis Figure Middle East & Africa Night Vision (Ir) Surveillance Cameras Consumption and Growth Rate Analysis Figure Middle East & Africa Night Vision (Ir) Surveillance Cameras SWOT Analysis Figure India Night Vision (Ir) Surveillance Cameras Production and Growth Rate Analysis Figure India Night Vision (Ir) Surveillance Cameras Consumption and Growth Rate Analysis Figure India Night Vision (Ir) Surveillance Cameras SWOT Analysis Figure South America Night Vision (Ir) Surveillance Cameras Production and Growth Rate Analysis Figure South America Night Vision (Ir) Surveillance Cameras Consumption and Growth Rate Analysis Figure South America Night Vision (Ir) Surveillance Cameras SWOT Analysis Figure Top 3 Market Share of Night Vision (Ir) Surveillance Cameras Companies Figure Top 6 Market Share of Night Vision (Ir) Surveillance Cameras Companies Table Mergers, Acquisitions and Expansion Analysis Table Company Profiles Table Product Introduction Table FLIR Systems Production, Value ($), Price, Gross Margin 2014-2019 Figure FLIR Systems Production and Growth Rate Figure FLIR Systems Value ($) Market Share 2014-2019 Figure FLIR Systems Market Share of Night Vision (Ir) Surveillance Cameras Segmented by Region in 2018 Table Company Profiles Table Product Introduction Table BAE Systems Production, Value ($), Price, Gross Margin 2014-2019 Figure BAE Systems Production and Growth Rate Figure BAE Systems Value ($) Market Share 2014-2019 Figure BAE Systems Market Share of Night Vision (Ir) Surveillance Cameras Segmented by Region in 2018 Table Company Profiles Table Product Introduction Table Raytheon Production, Value ($), Price, Gross Margin 2014-2019 Figure Raytheon Production and Growth Rate Figure Raytheon Value ($) Market Share 2014-2019 Figure Raytheon Market Share of Night Vision (Ir) Surveillance Cameras Segmented by Region in 2018 Table Company Profiles Table Product Introduction Table L-3 Communications Production, Value ($), Price, Gross Margin 2014-2019 Figure L-3 Communications Production and Growth Rate Figure L-3 Communications Value ($) Market Share 2014-2019 Figure L-3 Communications Market Share of Night Vision (Ir) Surveillance Cameras Segmented by Region in 2018 Table Company Profiles Table Product Introduction Table Samsung Electronics Production, Value ($), Price, Gross Margin 2014-2019 Figure Samsung Electronics Production and Growth Rate Figure Samsung Electronics Value ($) Market Share 2014-2019 Figure Samsung Electronics Market Share of Night Vision (Ir) Surveillance Cameras Segmented by Region in 2018 Table Company Profiles Table Product Introduction Table Axis Communications Production, Value ($), Price, Gross Margin 2014-2019 Figure Axis Communications Production and Growth Rate Figure Axis Communications Value ($) Market Share 2014-2019 Figure Axis Communications Market Share of Night Vision (Ir) Surveillance Cameras Segmented by Region in 2018 Table Company Profiles Table Product Introduction Table Lorex Technology Production, Value ($), Price, Gross Margin 2014-2019 Figure Lorex Technology Production and Growth Rate Figure Lorex Technology Value ($) Market Share 2014-2019 Figure Lorex Technology Market Share of Night Vision (Ir) Surveillance Cameras Segmented by Region in 2018 Table Company Profiles Table Product Introduction Table Robert Bosch Production, Value ($), Price, Gross Margin 2014-2019 Figure Robert Bosch Production and Growth Rate Figure Robert Bosch Value ($) Market Share 2014-2019 Figure Robert Bosch Market Share of Night Vision (Ir) Surveillance Cameras Segmented by Region in 2018 Table Company Profiles Table Product Introduction Table Sony Production, Value ($), Price, Gross Margin 2014-2019 Figure Sony Production and Growth Rate Figure Sony Value ($) Market Share 2014-2019 Figure Sony Market Share of Night Vision (Ir) Surveillance Cameras Segmented by Region in 2018 Table Company Profiles Table Product Introduction Table Logitech Production, Value ($), Price, Gross Margin 2014-2019 Figure Logitech Production and Growth Rate Figure Logitech Value ($) Market Share 2014-2019 Figure Logitech Market Share of Night Vision (Ir) Surveillance Cameras Segmented by Region in 2018 Table Company Profiles Table Product Introduction Table United Vision Security Systems Production, Value ($), Price, Gross Margin 2014-2019 Figure United Vision Security Systems Production and Growth Rate Figure United Vision Security Systems Value ($) Market Share 2014-2019 Figure United Vision Security Systems Market Share of Night Vision (Ir) Surveillance Cameras Segmented by Region in 2018 Table Company Profiles Table Product Introduction Table Kintronics Production, Value ($), Price, Gross Margin 2014-2019 Figure Kintronics Production and Growth Rate Figure Kintronics Value ($) Market Share 2014-2019 Figure Kintronics Market Share of Night Vision (Ir) Surveillance Cameras Segmented by Region in 2018 Table Company Profiles Table Product Introduction Table Hikvision Digital Technology Production, Value ($), Price, Gross Margin 2014-2019 Figure Hikvision Digital Technology Production and Growth Rate Figure Hikvision Digital Technology Value ($) Market Share 2014-2019 Figure Hikvision Digital Technology Market Share of Night Vision (Ir) Surveillance Cameras Segmented by Region in 2018 Table Company Profiles Table Product Introduction Table Pelco Production, Value ($), Price, Gross Margin 2014-2019 Figure Pelco Production and Growth Rate Figure Pelco Value ($) Market Share 2014-2019 Figure Pelco Market Share of Night Vision (Ir) Surveillance Cameras Segmented by Region in 2018 Table Global Night Vision (Ir) Surveillance Cameras Market Value ($) Forecast, by Type Table Global Night Vision (Ir) Surveillance Cameras Market Volume Forecast, by Type Figure Global Night Vision (Ir) Surveillance Cameras Market Value ($) and Growth Rate Forecast of Fixed Cameras (2019-2024) Figure Global Night Vision (Ir) Surveillance Cameras Market Volume and Growth Rate Forecast of Fixed Cameras (2019-2024) Figure Global Night Vision (Ir) Surveillance Cameras Market Value ($) and Growth Rate Forecast of PTZ Cameras (2019-2024) Figure Global Night Vision (Ir) Surveillance Cameras Market Volume and Growth Rate Forecast of PTZ Cameras (2019-2024) Table Global Market Value ($) Forecast by Application (2019-2024) Table Global Market Volume Forecast by Application (2019-2024) Figure Global Night Vision (Ir) Surveillance Cameras Consumption and Growth Rate of Public Sector and Defense (2014-2019) Figure Global Night Vision (Ir) Surveillance Cameras Consumption and Growth Rate of Retail (2014-2019) Figure Global Night Vision (Ir) Surveillance Cameras Consumption and Growth Rate of Transportation (2014-2019) Figure Global Night Vision (Ir) Surveillance Cameras Consumption and Growth Rate of Industrial (2014-2019) Figure Global Night Vision (Ir) Surveillance Cameras Consumption and Growth Rate of Stadiums (2014-2019) Figure Global Night Vision (Ir) Surveillance Cameras Consumption and Growth Rate of Business Organizations (2014-2019) Figure Global Night Vision (Ir) Surveillance Cameras Consumption and Growth Rate of Others (Hospitality, Education,etc) (2014-2019) Figure Market Value ($) and Growth Rate Forecast of Others (Hospitality, Education,etc) (2019-2024) Figure Market Volume and Growth Rate Forecast of Others (Hospitality, Education,etc) (2019-2024) Figure North America Market Value ($) and Growth Rate Forecast (2019-2024) Table North America Consumption and Growth Rate Forecast (2019-2024) Figure Europe Market Value ($) and Growth Rate Forecast (2019-2024) Table Europe Consumption and Growth Rate Forecast (2019-2024) Figure China Market Value ($) and Growth Rate Forecast (2019-2024) Table China Consumption and Growth Rate Forecast (2019-2024) Figure Japan Market Value ($) and Growth Rate Forecast (2019-2024) Table Japan Consumption and Growth Rate Forecast (2019-2024) Figure Middle East & Africa Market Value ($) and Growth Rate Forecast (2019-2024) Table Middle East & Africa Consumption and Growth Rate Forecast (2019-2024) Figure India Market Value ($) and Growth Rate Forecast (2019-2024) Table India Consumption and Growth Rate Forecast (2019-2024) Figure South America Market Value ($) and Growth Rate Forecast (2019-2024) Table South America Consumption and Growth Rate Forecast (2019-2024) Figure Industry Resource/Technology/Labor Importance Analysis Table New Entrants SWOT Analysis Table New Project Analysis of Investment Recovery
Inquiry For Buying
Night Vision (Ir) Surveillance Cameras
Request Sample
Night Vision (Ir) Surveillance Cameras