Nutrition (Energy or Protein) Bars Market Size, Share, and Trends Analysis Report
CAGR :

| Market Size 2024 (Base Year) | USD 1685.25 Million |
| Market Size 2032 (Forecast Year) | USD 2324.18 Million |
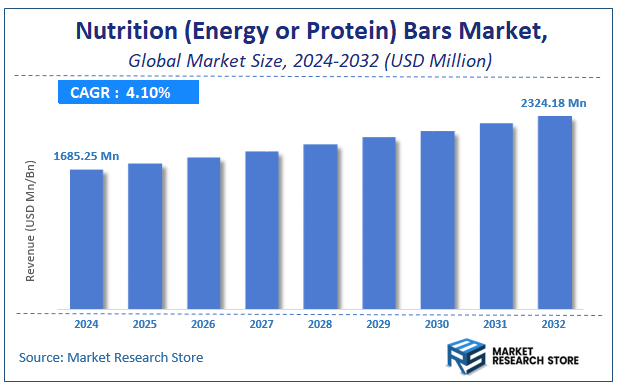
| CAGR | 4.1% |
| Forecast Period | 2025 - 2032 |
| Historical Period | 2020 - 2024 |
According to a recent study by Market Research Store, the global nutrition (energy or protein) bars market size was valued at approximately USD 1685.25 Million in 2024. The market is projected to grow significantly, reaching USD 2324.18 Million by 2032, growing at a compound annual growth rate (CAGR) of 4.1% during the forecast period from 2024 to 2032. The report highlights key growth drivers such as rising demand, technological advancements, and expanding applications. It also outlines potential challenges like regulatory changes and market competition, while emphasizing emerging opportunities for innovation and investment in the nutrition (energy or protein) bars industry.
Nutrition (Energy or Protein) Bars Market: Overview
The growth of the nutrition (energy or protein) bars market is fueled by rising global demand across various industries and applications. The report highlights lucrative opportunities, analyzing cost structures, key segments, emerging trends, regional dynamics, and advancements by leading players to provide comprehensive market insights. The nutrition (energy or protein) bars market report offers a detailed industry analysis from 2024 to 2032, combining quantitative and qualitative insights. It examines key factors such as pricing, market penetration, GDP impact, industry dynamics, major players, consumer behavior, and socio-economic conditions. Structured into multiple sections, the report provides a comprehensive perspective on the market from all angles.
Key sections of the nutrition (energy or protein) bars market report include market segments, outlook, competitive landscape, and company profiles. Market Segments offer in-depth details based on Type, Flavor, Packaging, Distribution Channel, End-User, and other relevant classifications to support strategic marketing initiatives. Market Outlook thoroughly analyzes market trends, growth drivers, restraints, opportunities, challenges, Porter’s Five Forces framework, macroeconomic factors, value chain analysis, and pricing trends shaping the market now and in the future. The Competitive Landscape and Company Profiles section highlights major players, their strategies, and market positioning to guide investment and business decisions. The report also identifies innovation trends, new business opportunities, and investment prospects for the forecast period.
Key Highlights:
- As per the analysis shared by our research analyst, the global nutrition (energy or protein) bars market is estimated to grow annually at a CAGR of around 4.1% over the forecast period (2024-2032).
- In terms of revenue, the global nutrition (energy or protein) bars market size was valued at around USD 1685.25 Million in 2024 and is projected to reach USD 2324.18 Million by 2032.
- The market is projected to grow at a significant rate due to increasing demand for on-the-go nutrition solutions.
- Based on the Type, the Protein Bars segment is growing at a high rate and will continue to dominate the global market as per industry projections.
- On the basis of Flavor, the Chocolate segment is anticipated to command the largest market share.
- In terms of Packaging, the Wrappers segment is projected to lead the global market.
- By Distribution Channel, the Supermarkets & Hypermarkets segment is predicted to dominate the global market.
- Based on the End-User, the Household segment is expected to swipe the largest market share.
- Based on region, North America is projected to dominate the global market during the forecast period.
Nutrition (Energy or Protein) Bars Market: Report Scope
This report thoroughly analyzes the nutrition (energy or protein) bars market, exploring its historical trends, current state, and future projections. The market estimates presented result from a robust research methodology, incorporating primary research, secondary sources, and expert opinions. These estimates are influenced by the prevailing market dynamics as well as key economic, social, and political factors. Furthermore, the report considers the impact of regulations, government expenditures, and advancements in research and development on the market. Both positive and negative shifts are evaluated to ensure a comprehensive and accurate market outlook.
| Report Attributes | Report Details |
|---|---|
| Report Name | Nutrition (Energy or Protein) Bars Market |
| Market Size in 2024 | USD 1685.25 Million |
| Market Forecast in 2032 | USD 2324.18 Million |
| Growth Rate | CAGR of 4.1% |
| Number of Pages | 214 |
| Key Companies Covered | Fulfill Nutrition, Nestlé, Quest Nutrition, The Kellogg Company, MARS food, General Mills Inc., PepsiCo |
| Segments Covered | By Type, By Flavor, By Packaging, By Distribution Channel, By End-User, and By Region |
| Regions Covered | North America, Europe, Asia Pacific (APAC), Latin America, Middle East, and Africa (MEA) |
| Base Year | 2024 |
| Historical Year | 2020 to 2024 |
| Forecast Year | 2025 to 2032 |
| Customization Scope | Avail customized purchase options to meet your exact research needs. Request For Customization |
Nutrition (Energy or Protein) Bars Market: Dynamics
Key Growth Drivers :
The nutrition bar market is experiencing significant growth, primarily driven by the convergence of health, convenience, and lifestyle trends. The rise of health consciousness and a global focus on wellness have led consumers to seek out nutritious, on-the-go snacks that offer a healthier alternative to traditional processed foods. Nutrition bars provide a convenient solution for busy individuals, athletes, and professionals who require a quick source of energy or protein for their hectic schedules. The market is also benefiting from the increasing popularity of fitness and sports activities, as these bars are often used for pre- or post-workout fuel. The proliferation of e-commerce platforms and a wide variety of retail channels have made a diverse range of products easily accessible to a broader consumer base.
Restraints :
Despite the market's strong potential, it faces several significant restraints. A primary challenge is the negative health perception associated with some nutrition bars, which are often criticized for their high sugar content and highly processed ingredients. This can deter health-conscious consumers and lead to a lack of trust. The market is also susceptible to the volatility of raw material prices, particularly for ingredients like whey protein, nuts, seeds, and specialty flours, which can impact production costs and the final price for consumers. Additionally, the intense competition from a wide range of alternative healthy snacks, such as yogurt, fresh fruits, and protein shakes, puts pressure on pricing and requires continuous investment in marketing and branding to stand out.
Opportunities :
The nutrition bar market is ripe with opportunities for innovation and expansion. A key opportunity lies in the development of clean-label and functional products that are free from artificial additives, low in sugar, and fortified with specific health-promoting ingredients like adaptogens, probiotics, or superfoods. The increasing consumer demand for plant-based and vegan alternatives presents a major avenue for growth, as brands can introduce new protein sources from peas, rice, and hemp. The market can also capitalize on the rising trend of personalized nutrition, leveraging technology to create bars tailored to individual dietary needs, such as keto, gluten-free, or specific allergen-free formulations. Furthermore, expanding into emerging markets with rising disposable incomes and changing lifestyles presents a vast, untapped potential.
Challenges :
The market must navigate several complex challenges to sustain its growth. The most pressing is the need to balance taste and texture with nutritional value, as many consumers find that some high-protein or low-sugar bars have an undesirable "cardboard" taste or grainy texture. The industry also faces the challenge of maintaining a consistent and cost-effective supply chain for high-quality, specialty ingredients. Furthermore, the fierce competition and low barriers to entry for new brands necessitate heavy investment in marketing and consumer education to build brand loyalty. Lastly, the industry is under pressure to address the environmental impact of its packaging, which often consists of single-use plastics, and to find more sustainable solutions.
Nutrition (Energy or Protein) Bars Market: Segmentation Insights
The global nutrition (energy or protein) bars market is segmented based on Type, Flavor, Packaging, Distribution Channel, End-User, and Region. All the segments of the nutrition (energy or protein) bars market have been analyzed based on present & future trends and the market is estimated from 2024 to 2032.
Based on Type, the global nutrition (energy or protein) bars market is divided into Protein Bars, Energy Bars, Meal Replacement Bars, Snack Bars, Others.
On the basis of Flavor, the global nutrition (energy or protein) bars market is bifurcated into Chocolate, Fruit, Nut, Mixed Flavors, Others.
In terms of Packaging, the global nutrition (energy or protein) bars market is categorized into Wrappers, Boxes, Pouches, Others.
Based on Distribution Channel, the global nutrition (energy or protein) bars market is split into Supermarkets & Hypermarkets, Convenience Stores, Specialty Stores, Online Retail, Others.
By End-User, the global nutrition (energy or protein) bars market is divided into Household, Fitness Centers, Industrial / Institutional.
Nutrition (Energy or Protein) Bars Market: Regional Insights
North America is the dominant region in the global nutrition bar market, holding the largest revenue share, estimated at over 45%. This leadership, driven primarily by the United States, is fueled by a deeply ingrained health and wellness culture, high consumer demand for convenient, on-the-go protein and energy sources, and the presence of major global brands like Clif Bar, KIND, and RXBAR. The market is characterized by intense innovation in flavors, functional ingredients (e.g., plant-based proteins, probiotics), and extensive distribution across grocery, convenience, and online channels.
Europe is a mature and significant secondary market, with strong demand in Western Europe for organic, natural, and sustainably sourced products. However, the Asia-Pacific region is projected to exhibit the highest growth rate, driven by urbanization, rising health consciousness, and the expansion of modern retail in countries like China and India. Despite this rapid growth, North America's established consumer base, high per capita spending on wellness products, and relentless product development secure its position as the market's innovation and revenue leader.
Nutrition (Energy or Protein) Bars Market: Competitive Landscape
The nutrition (energy or protein) bars market Report offers a thorough analysis of both established and emerging players within the market. It includes a detailed list of key companies, categorized based on the types of products they offer and other relevant factors. The report also highlights the market entry year for each player, providing further context for the research analysis.
The "Global Nutrition (Energy or Protein) Bars Market" study offers valuable insights, focusing on the global market landscape, with an emphasis on major industry players such as;
- Fulfill Nutrition
- Nestlé
- Quest Nutrition
- The Kellogg Company
- MARS food
- General Mills Inc.
- PepsiCo
The Global Nutrition (Energy or Protein) Bars Market is Segmented as Follows:
By Type
- Protein Bars
- Energy Bars
- Meal Replacement Bars
- Snack Bars
- Others
By Flavor
- Chocolate
- Fruit
- Nut
- Mixed Flavors
- Others
By Packaging
- Wrappers
- Boxes
- Pouches
- Others
By Distribution Channel
- Supermarkets & Hypermarkets
- Convenience Stores
- Specialty Stores
- Online Retail
- Others
By End-User
- Household
- Fitness Centers
- Industrial / Institutional
By Region
- North America
- The U.S.
- Canada
- Mexico
- Europe
- France
- The UK
- Spain
- Germany
- Italy
- Rest of Europe
- Asia Pacific
- China
- Japan
- India
- Australia
- South Korea
- Rest of Asia Pacific
- The Middle East & Africa
- Saudi Arabia
- UAE
- Egypt
- Kuwait
- South Africa
- Rest of the Middle East & Africa
- Latin America
- Brazil
- Argentina
- Rest of Latin America
Frequently Asked Questions
Table Of Content
Table of Content 1 Report Overview 1.1 Study Scope 1.2 Key Market Segments 1.3 Regulatory Scenario by Region/Country 1.4 Market Investment Scenario Strategic 1.5 Market Analysis by Type 1.5.1 Global Nutrition (Energy or Protein) Bars Market Share by Type (2020-2026) 1.5.2 Candy Bars 1.5.3 Protein Bars 1.5.4 Energy Bars 1.5.5 Oat Bars 1.6 Market by Application 1.6.1 Global Nutrition (Energy or Protein) Bars Market Share by Application (2020-2026) 1.6.2 Supermarket 1.6.3 Retail Store 1.6.4 Online Sales 1.6.5 Other 1.7 Nutrition (Energy or Protein) Bars Industry Development Trends under COVID-19 Outbreak 1.7.1 Global COVID-19 Status Overview 1.7.2 Influence of COVID-19 Outbreak on Nutrition (Energy or Protein) Bars Industry Development 2. Global Market Growth Trends 2.1 Industry Trends 2.1.1 SWOT Analysis 2.1.2 Porter’s Five Forces Analysis 2.2 Potential Market and Growth Potential Analysis 2.3 Industry News and Policies by Regions 2.3.1 Industry News 2.3.2 Industry Policies 2.4 Industry Trends Under COVID-19 3 Value Chain of Nutrition (Energy or Protein) Bars Market 3.1 Value Chain Status 3.2 Nutrition (Energy or Protein) Bars Manufacturing Cost Structure Analysis 3.2.1 Production Process Analysis 3.2.2 Manufacturing Cost Structure of Nutrition (Energy or Protein) Bars 3.2.3 Labor Cost of Nutrition (Energy or Protein) Bars 3.2.3.1 Labor Cost of Nutrition (Energy or Protein) Bars Under COVID-19 3.3 Sales and Marketing Model Analysis 3.4 Downstream Major Customer Analysis (by Region) 3.5 Value Chain Status Under COVID-19 4 Players Profiles 4.1 Fulfill Nutrition 4.1.1 Fulfill Nutrition Basic Information 4.1.2 Nutrition (Energy or Protein) Bars Product Profiles, Application and Specification 4.1.3 Fulfill Nutrition Nutrition (Energy or Protein) Bars Market Performance (2015-2020) 4.1.4 Fulfill Nutrition Business Overview 4.2 Nestlé 4.2.1 Nestlé Basic Information 4.2.2 Nutrition (Energy or Protein) Bars Product Profiles, Application and Specification 4.2.3 Nestlé Nutrition (Energy or Protein) Bars Market Performance (2015-2020) 4.2.4 Nestlé Business Overview 4.3 Quest Nutrition 4.3.1 Quest Nutrition Basic Information 4.3.2 Nutrition (Energy or Protein) Bars Product Profiles, Application and Specification 4.3.3 Quest Nutrition Nutrition (Energy or Protein) Bars Market Performance (2015-2020) 4.3.4 Quest Nutrition Business Overview 4.4 The Kellogg Company 4.4.1 The Kellogg Company Basic Information 4.4.2 Nutrition (Energy or Protein) Bars Product Profiles, Application and Specification 4.4.3 The Kellogg Company Nutrition (Energy or Protein) Bars Market Performance (2015-2020) 4.4.4 The Kellogg Company Business Overview 4.5 MARS food 4.5.1 MARS food Basic Information 4.5.2 Nutrition (Energy or Protein) Bars Product Profiles, Application and Specification 4.5.3 MARS food Nutrition (Energy or Protein) Bars Market Performance (2015-2020) 4.5.4 MARS food Business Overview 4.6 General Mills Inc. 4.6.1 General Mills Inc. Basic Information 4.6.2 Nutrition (Energy or Protein) Bars Product Profiles, Application and Specification 4.6.3 General Mills Inc. Nutrition (Energy or Protein) Bars Market Performance (2015-2020) 4.6.4 General Mills Inc. Business Overview 4.7 PepsiCo 4.7.1 PepsiCo Basic Information 4.7.2 Nutrition (Energy or Protein) Bars Product Profiles, Application and Specification 4.7.3 PepsiCo Nutrition (Energy or Protein) Bars Market Performance (2015-2020) 4.7.4 PepsiCo Business Overview 5 Global Nutrition (Energy or Protein) Bars Market Analysis by Regions 5.1 Global Nutrition (Energy or Protein) Bars Sales, Revenue and Market Share by Regions 5.1.1 Global Nutrition (Energy or Protein) Bars Sales by Regions (2015-2020) 5.1.2 Global Nutrition (Energy or Protein) Bars Revenue by Regions (2015-2020) 5.2 North America Nutrition (Energy or Protein) Bars Sales and Growth Rate (2015-2020) 5.3 Europe Nutrition (Energy or Protein) Bars Sales and Growth Rate (2015-2020) 5.4 Asia-Pacific Nutrition (Energy or Protein) Bars Sales and Growth Rate (2015-2020) 5.5 Middle East and Africa Nutrition (Energy or Protein) Bars Sales and Growth Rate (2015-2020) 5.6 South America Nutrition (Energy or Protein) Bars Sales and Growth Rate (2015-2020) 6 North America Nutrition (Energy or Protein) Bars Market Analysis by Countries 6.1 North America Nutrition (Energy or Protein) Bars Sales, Revenue and Market Share by Countries 6.1.1 North America Nutrition (Energy or Protein) Bars Sales by Countries (2015-2020) 6.1.2 North America Nutrition (Energy or Protein) Bars Revenue by Countries (2015-2020) 6.1.3 North America Nutrition (Energy or Protein) Bars Market Under COVID-19 6.2 United States Nutrition (Energy or Protein) Bars Sales and Growth Rate (2015-2020) 6.2.1 United States Nutrition (Energy or Protein) Bars Market Under COVID-19 6.3 Canada Nutrition (Energy or Protein) Bars Sales and Growth Rate (2015-2020) 6.4 Mexico Nutrition (Energy or Protein) Bars Sales and Growth Rate (2015-2020) 7 Europe Nutrition (Energy or Protein) Bars Market Analysis by Countries 7.1 Europe Nutrition (Energy or Protein) Bars Sales, Revenue and Market Share by Countries 7.1.1 Europe Nutrition (Energy or Protein) Bars Sales by Countries (2015-2020) 7.1.2 Europe Nutrition (Energy or Protein) Bars Revenue by Countries (2015-2020) 7.1.3 Europe Nutrition (Energy or Protein) Bars Market Under COVID-19 7.2 Germany Nutrition (Energy or Protein) Bars Sales and Growth Rate (2015-2020) 7.2.1 Germany Nutrition (Energy or Protein) Bars Market Under COVID-19 7.3 UK Nutrition (Energy or Protein) Bars Sales and Growth Rate (2015-2020) 7.3.1 UK Nutrition (Energy or Protein) Bars Market Under COVID-19 7.4 France Nutrition (Energy or Protein) Bars Sales and Growth Rate (2015-2020) 7.4.1 France Nutrition (Energy or Protein) Bars Market Under COVID-19 7.5 Italy Nutrition (Energy or Protein) Bars Sales and Growth Rate (2015-2020) 7.5.1 Italy Nutrition (Energy or Protein) Bars Market Under COVID-19 7.6 Spain Nutrition (Energy or Protein) Bars Sales and Growth Rate (2015-2020) 7.6.1 Spain Nutrition (Energy or Protein) Bars Market Under COVID-19 7.7 Russia Nutrition (Energy or Protein) Bars Sales and Growth Rate (2015-2020) 7.7.1 Russia Nutrition (Energy or Protein) Bars Market Under COVID-19 8 Asia-Pacific Nutrition (Energy or Protein) Bars Market Analysis by Countries 8.1 Asia-Pacific Nutrition (Energy or Protein) Bars Sales, Revenue and Market Share by Countries 8.1.1 Asia-Pacific Nutrition (Energy or Protein) Bars Sales by Countries (2015-2020) 8.1.2 Asia-Pacific Nutrition (Energy or Protein) Bars Revenue by Countries (2015-2020) 8.1.3 Asia-Pacific Nutrition (Energy or Protein) Bars Market Under COVID-19 8.2 China Nutrition (Energy or Protein) Bars Sales and Growth Rate (2015-2020) 8.2.1 China Nutrition (Energy or Protein) Bars Market Under COVID-19 8.3 Japan Nutrition (Energy or Protein) Bars Sales and Growth Rate (2015-2020) 8.3.1 Japan Nutrition (Energy or Protein) Bars Market Under COVID-19 8.4 South Korea Nutrition (Energy or Protein) Bars Sales and Growth Rate (2015-2020) 8.4.1 South Korea Nutrition (Energy or Protein) Bars Market Under COVID-19 8.5 Australia Nutrition (Energy or Protein) Bars Sales and Growth Rate (2015-2020) 8.6 India Nutrition (Energy or Protein) Bars Sales and Growth Rate (2015-2020) 8.6.1 India Nutrition (Energy or Protein) Bars Market Under COVID-19 8.7 Southeast Asia Nutrition (Energy or Protein) Bars Sales and Growth Rate (2015-2020) 8.7.1 Southeast Asia Nutrition (Energy or Protein) Bars Market Under COVID-19 9 Middle East and Africa Nutrition (Energy or Protein) Bars Market Analysis by Countries 9.1 Middle East and Africa Nutrition (Energy or Protein) Bars Sales, Revenue and Market Share by Countries 9.1.1 Middle East and Africa Nutrition (Energy or Protein) Bars Sales by Countries (2015-2020) 9.1.2 Middle East and Africa Nutrition (Energy or Protein) Bars Revenue by Countries (2015-2020) 9.1.3 Middle East and Africa Nutrition (Energy or Protein) Bars Market Under COVID-19 9.2 Saudi Arabia Nutrition (Energy or Protein) Bars Sales and Growth Rate (2015-2020) 9.3 UAE Nutrition (Energy or Protein) Bars Sales and Growth Rate (2015-2020) 9.4 Egypt Nutrition (Energy or Protein) Bars Sales and Growth Rate (2015-2020) 9.5 Nigeria Nutrition (Energy or Protein) Bars Sales and Growth Rate (2015-2020) 9.6 South Africa Nutrition (Energy or Protein) Bars Sales and Growth Rate (2015-2020) 10 South America Nutrition (Energy or Protein) Bars Market Analysis by Countries 10.1 South America Nutrition (Energy or Protein) Bars Sales, Revenue and Market Share by Countries 10.1.1 South America Nutrition (Energy or Protein) Bars Sales by Countries (2015-2020) 10.1.2 South America Nutrition (Energy or Protein) Bars Revenue by Countries (2015-2020) 10.1.3 South America Nutrition (Energy or Protein) Bars Market Under COVID-19 10.2 Brazil Nutrition (Energy or Protein) Bars Sales and Growth Rate (2015-2020) 10.2.1 Brazil Nutrition (Energy or Protein) Bars Market Under COVID-19 10.3 Argentina Nutrition (Energy or Protein) Bars Sales and Growth Rate (2015-2020) 10.4 Columbia Nutrition (Energy or Protein) Bars Sales and Growth Rate (2015-2020) 10.5 Chile Nutrition (Energy or Protein) Bars Sales and Growth Rate (2015-2020) 11 Global Nutrition (Energy or Protein) Bars Market Segment by Types 11.1 Global Nutrition (Energy or Protein) Bars Sales, Revenue and Market Share by Types (2015-2020) 11.1.1 Global Nutrition (Energy or Protein) Bars Sales and Market Share by Types (2015-2020) 11.1.2 Global Nutrition (Energy or Protein) Bars Revenue and Market Share by Types (2015-2020) 11.2 Candy Bars Sales and Price (2015-2020) 11.3 Protein Bars Sales and Price (2015-2020) 11.4 Energy Bars Sales and Price (2015-2020) 11.5 Oat Bars Sales and Price (2015-2020) 12 Global Nutrition (Energy or Protein) Bars Market Segment by Applications 12.1 Global Nutrition (Energy or Protein) Bars Sales, Revenue and Market Share by Applications (2015-2020) 12.1.1 Global Nutrition (Energy or Protein) Bars Sales and Market Share by Applications (2015-2020) 12.1.2 Global Nutrition (Energy or Protein) Bars Revenue and Market Share by Applications (2015-2020) 12.2 Supermarket Sales, Revenue and Growth Rate (2015-2020) 12.3 Retail Store Sales, Revenue and Growth Rate (2015-2020) 12.4 Online Sales Sales, Revenue and Growth Rate (2015-2020) 12.5 Other Sales, Revenue and Growth Rate (2015-2020) 13 Nutrition (Energy or Protein) Bars Market Forecast by Regions (2020-2026) 13.1 Global Nutrition (Energy or Protein) Bars Sales, Revenue and Growth Rate (2020-2026) 13.2 Nutrition (Energy or Protein) Bars Market Forecast by Regions (2020-2026) 13.2.1 North America Nutrition (Energy or Protein) Bars Market Forecast (2020-2026) 13.2.2 Europe Nutrition (Energy or Protein) Bars Market Forecast (2020-2026) 13.2.3 Asia-Pacific Nutrition (Energy or Protein) Bars Market Forecast (2020-2026) 13.2.4 Middle East and Africa Nutrition (Energy or Protein) Bars Market Forecast (2020-2026) 13.2.5 South America Nutrition (Energy or Protein) Bars Market Forecast (2020-2026) 13.3 Nutrition (Energy or Protein) Bars Market Forecast by Types (2020-2026) 13.4 Nutrition (Energy or Protein) Bars Market Forecast by Applications (2020-2026) 13.5 Nutrition (Energy or Protein) Bars Market Forecast Under COVID-19 14 Appendix 14.1 Methodology 14.2 Research Data Source
Inquiry For Buying
Nutrition (Energy or Protein) Bars
Request Sample
Nutrition (Energy or Protein) Bars