Pet Care Market Size, Share, and Trends Analysis Report
CAGR :

| Market Size 2023 (Base Year) | USD 245.32 Billion |
| Market Size 2032 (Forecast Year) | USD 393.82 Billion |
| CAGR | 5.4% |
| Forecast Period | 2024 - 2032 |
| Historical Period | 2018 - 2023 |
Pet Care Market Insights
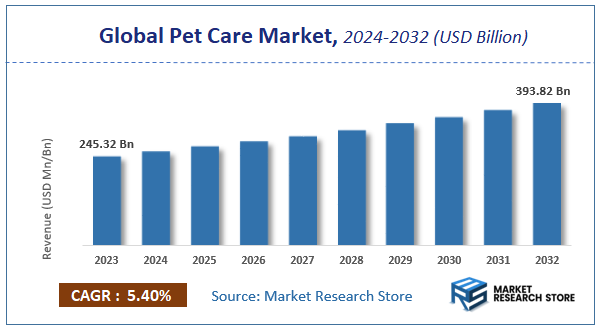
A latest report by Market Research Store estimates that the Global Pet Care Market was valued at USD 245.32 Billion in 2023 and is expected to reach USD 393.82 Billion by 2032, with a CAGR of 5.4% during the forecast period 2024-2032. The report Pet Care Market overview, growth factors, restraints, opportunities, segmentation, key developments, competitive landscape, consumer insights, and market growth forecast in terms of value or volume. These structured details offer an all-inclusive market overview, providing valuable insights for investment decisions, business decisions, strategic planning, and competitive analysis.
Pet Care Market: Overview
The growth of the pet care market is fueled by rising global demand across various industries and applications. The report highlights lucrative opportunities, analyzing cost structures, key segments, emerging trends, regional dynamics, and advancements by leading players to provide comprehensive market insights. The pet care market report offers a detailed industry analysis from 2024 to 2032, combining quantitative and qualitative insights. It examines key factors such as pricing, market penetration, GDP impact, industry dynamics, major players, consumer behavior, and socio-economic conditions. Structured into multiple sections, the report provides a comprehensive perspective on the market from all angles.
Key sections of the pet care market report include market segments, outlook, competitive landscape, and company profiles. Market Segments offer in-depth details based on Product Type, Animal Type, Service Type, Distribution Channel, and other relevant classifications to support strategic marketing initiatives. Market Outlook thoroughly analyzes market trends, growth drivers, restraints, opportunities, challenges, Porter’s Five Forces framework, macroeconomic factors, value chain analysis, and pricing trends shaping the market now and in the future. The Competitive Landscape and Company Profiles section highlights major players, their strategies, and market positioning to guide investment and business decisions. The report also identifies innovation trends, new business opportunities, and investment prospects for the forecast period.
Key Highlights:
Pet Care Market: Report Scope
This report thoroughly analyzes the pet care market, exploring its historical trends, current state, and future projections. The market estimates presented result from a robust research methodology, incorporating primary research, secondary sources, and expert opinions. These estimates are influenced by the prevailing market dynamics as well as key economic, social, and political factors. Furthermore, the report considers the impact of regulations, government expenditures, and advancements in research and development on the market. Both positive and negative shifts are evaluated to ensure a comprehensive and accurate market outlook.
| Report Attributes | Report Details |
|---|---|
| Report Name | Pet Care Market |
| Market Size in 2023 | USD 245.32 Billion |
| Market Forecast in 2032 | USD 393.82 Billion |
| Growth Rate | CAGR of 5.4% |
| Number of Pages | 174 |
| Key Companies Covered | Ancol Pet Products Limited, Blue Buffalo Co. Ltd., Champion Petfoods LP, Hill`s Pet Nutrition Inc., Mars Incorporated, Nestle Purina PetCare, Petmate Holdings Co, Saturn Petcare GmbH, Tail Blazers, The Hartz Mountain Corporation |
| Segments Covered | By Product Type, By Animal Type, By Service Type, By Distribution Channel, and By Region |
| Regions Covered | North America, Europe, Asia Pacific (APAC), Latin America, Middle East, and Africa (MEA) |
| Base Year | 2023 |
| Historical Year | 2018 to 2023 |
| Forecast Year | 2024 to 2032 |
| Customization Scope | Avail customized purchase options to meet your exact research needs. Request For Customization |
Pet Care Market: Dynamics
Key Growth Drivers
The Pet Care market in India is experiencing significant growth driven by the increasing pet ownership, particularly in urban areas, as more individuals and families embrace companion animals. The rising disposable incomes allow pet owners to spend more on premium food, healthcare, grooming, and other pet-related products and services. Furthermore, the growing humanization of pets, where they are increasingly considered family members, leads to a greater willingness to invest in their well-being and comfort. The expanding availability of a wide range of pet care products and services through online and offline channels, including specialized pet stores, veterinary clinics, and e-commerce platforms, makes it easier for pet owners to access what they need. The increasing awareness about pet health and nutrition, coupled with the influence of social media and pet influencers, also contributes to market growth.
Restraints
Despite the strong growth drivers, the Pet Care market in India faces certain restraints. The high cost of premium pet food and healthcare services can be a barrier for budget-conscious pet owners, particularly in smaller towns and rural areas. The lack of awareness about proper pet care practices among some pet owners can lead to lower adoption of specialized products and services. Furthermore, the limited availability of specialized veterinary services and pet care facilities outside of major metropolitan cities can restrict access for many pet owners. Concerns about the authenticity and quality of some pet care products, especially those sold through unorganized channels, can also deter consumers. The cultural factors and varying levels of pet acceptance across different regions in India can also influence market penetration.
Opportunities
The Pet Care market in India presents numerous opportunities for innovation and expansion. The growing demand for natural, organic, and breed-specific pet food offers a premium market segment. The increasing focus on pet health and wellness creates opportunities for specialized veterinary services, pet insurance, and preventive healthcare products. Furthermore, the rising trend of pet adoption is expanding the overall pet owner base. The growth of online retail and subscription services for pet supplies provides convenience and accessibility to a wider audience. The development of smart pet care devices like automatic feeders, GPS trackers, and interactive toys caters to tech-savvy pet owners. The potential for offering specialized pet services such as professional grooming, training, and pet-sitting is also increasing.
Challenges
The Pet Care market in India faces challenges related to educating pet owners about the importance of proper nutrition, healthcare, and grooming for their pets' well-being. Ensuring the availability of high-quality and authentic pet care products while combating counterfeit or substandard goods is crucial. Furthermore, addressing the affordability barrier for premium products and services to make them accessible to a broader range of pet owners is important. Developing a robust and well-distributed network of specialized veterinary clinics and pet care facilities across the country is essential. Navigating the regulatory landscape concerning pet food standards and veterinary practices requires continuous adaptation. Finally, building trust and brand loyalty in a market with increasing competition from both domestic and international players is a key challenge.
Pet Care Market: Segmentation Insights
The global pet care market is segmented based on Product Type, Animal Type, Service Type, Distribution Channel, and Region. All the segments of the pet care market have been analyzed based on present & future trends and the market is estimated from 2024 to 2032.
Based on Product Type, the global pet care market is divided into Pet Food, Pet Grooming Products, Pet Healthcare Products, Pet Accessories.
On the basis of Animal Type, the global pet care market is bifurcated into Dogs, Cats, Birds, Fish, Small Mammals, Others.
In terms of Service Type, the global pet care market is categorized into Pet Grooming, Pet Training, Pet Boarding, Pet Insurance.
Based on Distribution Channel, the global pet care market is split into Supermarkets & Hypermarkets
- As per the analysis shared by our research analyst, the global pet care market is estimated to grow annually at a CAGR of around 5.4% over the forecast period (2024-2032).
- In terms of revenue, the global pet care market size was valued at around USD 245.32 Billion in 2023 and is projected to reach USD 393.82 Billion by 2032.
- The market is projected to grow at a significant rate due to rising pet ownership, increasing spending on pet health and wellness, growing demand for premium and organic pet food, and advancements in pet grooming and veterinary services.
- Based on the Product Type, the Pet Food segment is growing at a high rate and will continue to dominate the global market as per industry projections.
- On the basis of Animal Type, the Dogs segment is anticipated to command the largest market share.
- In terms of Service Type, the Pet Grooming segment is projected to lead the global market.
- By Distribution Channel, the Supermarkets & Hypermarkets segment is predicted to dominate the global market.
- Based on region, North America is projected to dominate the global market during the forecast period.
- [Content]
- [Content]
- [Content]
- [Content]
- Pet Specialty Stores
- Veterinary Clinics
- Online Stores.
Pet Care Market: Regional Insights
The North American region, particularly the United States, dominates the global pet care market, accounting for the largest revenue share (over 40% as of 2023). This dominance is driven by high pet ownership rates (nearly 70% of U.S. households own pets), increasing expenditure on premium pet food, and strong demand for veterinary care and pet insurance. The region benefits from advanced pet care infrastructure, a culture of humanization of pets, and significant investments in pet tech and wellness products.
Europe follows as the second-largest market, led by countries like the UK and Germany, while the Asia-Pacific region is the fastest-growing due to rising disposable incomes and urbanization. North America's leadership is further reinforced by major industry players like Mars Petcare and Nestlé Purina, which continuously innovate to meet evolving consumer demands.- Ancol Pet Products Limited
- Blue Buffalo Co. Ltd.
- Champion Petfoods LP
- Hill`s Pet Nutrition Inc.
- Mars Incorporated
- Nestle Purina PetCare
- Petmate Holdings Co
- Saturn Petcare GmbH
- Tail Blazers
- The Hartz Mountain Corporation
- Pet Food
- Pet Grooming Products
- Pet Healthcare Products
- Pet Accessories
- Dogs
- Cats
- Birds
- Fish
- Small Mammals
- Others
- Pet Grooming
- Pet Training
- Pet Boarding
- Pet Insurance
- Supermarkets & Hypermarkets
- Pet Specialty Stores
- Veterinary Clinics
- Online Stores
- North America
- The U.S.
- Canada
- Mexico
- Europe
- France
- The UK
- Spain
- Germany
- Italy
- Rest of Europe
- Asia Pacific
- China
- Japan
- India
- Australia
- South Korea
- Rest of Asia Pacific
- The Middle East & Africa
- Saudi Arabia
- UAE
- Egypt
- Kuwait
- South Africa
- Rest of the Middle East & Africa
- Latin America
- Brazil
- Argentina
- Rest of Latin America
- Competitive Rivalry
- Threat of New Entrants
- Threat of Substitutes
- Supplier Bargaining Power
- Buyer Bargaining Power
- Political factors assess government policies, stability, trade regulations, and political risks that could impact market operations.
- Economic factors examine variables like inflation, exchange rates, economic growth, and consumer spending power to determine market viability.
- Social factors explore cultural trends, demographics, and lifestyle changes that shape consumer behavior and preferences.
- Technological factors evaluate innovation, R&D, and technological advancements affecting product development and operational efficiencies.
- Environmental factors focus on sustainability, climate change impacts, and eco-friendly practices shaping market trends.
- Legal factors address compliance requirements, industry regulations, and intellectual property laws impacting market entry and operations.
- Official company websites, annual reports, financial statements, investor presentations, and SEC filings
- Internal and external proprietary databases, as well as relevant patent and regulatory databases
- Government publications, national statistical databases, and industry-specific market reports
- Media coverage, including news articles, press releases, and webcasts about market participants
- Paid industry databases for detailed market insights
- Distributors
- Marketing, Brand, and Product Managers
- Procurement and Production Managers
- Sales and Regional Sales Managers, Country Managers
- Technical Specialists
- C-Level Executives
-
Pet Care Market: Competitive Landscape
The pet care market report offers a thorough analysis of both established and emerging players within the market. It includes a detailed list of key companies, categorized based on the types of products they offer and other relevant factors. The report also highlights the market entry year for each player, providing further context for the research analysis.
The "Global Pet Care Market" study offers valuable insights, focusing on the global market landscape, with an emphasis on major industry players such as;
The Global Pet Care Market is Segmented as Follows:
By Product Type
By Animal Type
By Service Type
By Distribution Channel
By Region
Market Evolution
This section evaluates the market position of the product or service by examining its development pathway and competitive dynamics. It provides a detailed overview of the product's growth stages, including the early (historical) phase, the mid-stage, and anticipated future advancements influenced by innovation and emerging technologies.
Porter’s Analysis
Porter’s Five Forces framework offers a strategic lens for assessing competitor behavior and the positioning of key players in the pet care industry. This section explores the external factors shaping competitive dynamics and influencing market strategies in the years ahead. The analysis focuses on five critical forces:
Value Chain & Market Attractiveness Analysis
The value chain analysis helps businesses optimize operations by mapping the product flow from suppliers to end consumers, identifying opportunities to streamline processes and gain a competitive edge. Segment-wise market attractiveness analysis evaluates key dimensions like product categories, demographics, and regions, assessing growth potential, market size, and profitability. This enables businesses to focus resources on high-potential segments for better ROI and long-term value.
PESTEL Analysis
PESTEL analysis is a powerful tool in market research reports that enhances market understanding by systematically examining the external macro-environmental factors influencing a business or industry. The acronym stands for Political, Economic, Social, Technological, Environmental, and Legal factors. By evaluating these dimensions, PESTEL analysis provides a comprehensive overview of the broader context within which a market operates, helping businesses identify potential opportunities and threats.
Import-Export Analysis & Pricing Analysis
An import-export analysis is vital for market research, revealing global trade dynamics, trends, and opportunities. It examines trade volumes, product categories, and regional competitiveness, offering insights into supply chains and market demand. This section also analyzes past and future pricing trends, helping businesses optimize strategies and enabling consumers to assess product value effectively.
Pet Care Market: Company Profiles
The report identifies key players in the pet care market through a competitive landscape and company profiles, evaluating their offerings, financial performance, strategies, and market positioning. It includes a SWOT analysis of the top 3-5 companies, assessing strengths, weaknesses, opportunities, and threats. The competitive landscape highlights rankings, recent activities (mergers, acquisitions, partnerships, product launches), and regional footprints using the Ace matrix. Customization is available to meet client-specific needs.
Regional & Industry Footprint
This section details the geographic reach, sales networks, and market penetration of companies profiled in the pet care report, showcasing their operations and distribution across regions. It analyzes the alignment of companies with specific industry verticals, highlighting the industries they serve and the scope of their products and services within those sectors.
Ace Matrix
This section categorizes companies into four distinct groups—Active, Cutting Edge, Innovator, and Emerging—based on their product and business strategies. The evaluation of product strategy focuses on aspects such as the range and depth of offerings, commitment to innovation, product functionalities, and scalability. Key elements like global reach, sector coverage, strategic acquisitions, and long-term growth plans are considered for business strategy. This analysis provides a detailed view of companies' position within the market and highlights their potential for future growth and development.
Research Methodology
The qualitative and quantitative insights for the pet care market are derived through a multi-faceted research approach, combining input from subject matter experts, primary research, and secondary data sources. Primary research includes gathering critical information via face-to-face or telephonic interviews, surveys, questionnaires, and feedback from industry professionals, key opinion leaders (KOLs), and customers. Regular interviews with industry experts are conducted to deepen the analysis and reinforce the existing data, ensuring a robust and well-rounded market understanding.
Secondary research for this report was carried out by the Market Research Store team, drawing on a variety of authoritative sources, such as:
Market Research Store conducted in-depth consultations with various key opinion leaders in the industry, including senior executives from top companies and regional leaders from end-user organizations. This effort aimed to gather critical insights on factors such as the market share of dominant brands in specific countries and regions, along with pricing strategies for products and services.
To determine total sales data, the research team conducted primary interviews across multiple countries with influential stakeholders, including:
These subject matter experts, with their extensive industry experience, helped validate and refine the findings. For secondary research, data were sourced from a wide range of materials, including online resources, company annual reports, industry publications, research papers, association reports, and government websites. These various sources provide a comprehensive and well-rounded perspective on the market.
Frequently Asked Questions
Table Of Content
List of Tables and Figures Figure Product Picture of Pet Care Table Product Specification of Pet Care Figure Market Concentration Ratio and Market Maturity Analysis of Pet Care Figure Global Pet Care Value ($) and Growth Rate from 2014-2024 Table Different Types of Pet Care Figure Global Pet Care Value ($) Segment by Type from 2014-2019 Figure Pet Food Picture Figure Veterinary Care Picture Figure OTC Supplies Picture Figure Live Animal Purchase Picture Figure Pet Boarding Picture Table Different Applications of Pet Care Figure Global Pet Care Value ($) Segment by Applications from 2014-2019 Figure Pet Clinic Picture Figure Supermarket Picture Figure Online Sales Picture Figure Specialty Stores Picture Table Research Regions of Pet Care Figure North America Pet Care Production Value ($) and Growth Rate (2014-2019) Figure Europe Pet Care Production Value ($) and Growth Rate (2014-2019) Table China Pet Care Production Value ($) and Growth Rate (2014-2019) Table Japan Pet Care Production Value ($) and Growth Rate (2014-2019) Table Middle East & Africa Pet Care Production Value ($) and Growth Rate (2014-2019) Table India Pet Care Production Value ($) and Growth Rate (2014-2019) Table South America Pet Care Production Value ($) and Growth Rate (2014-2019) Table Emerging Countries of Pet Care Table Growing Market of Pet Care Figure Industry Chain Analysis of Pet Care Table Upstream Raw Material Suppliers of Pet Care with Contact Information Table Major Players Manufacturing Base and Market Share ($) of Pet Care in 2018 Table Major Players Pet Care Product Types in 2018 Figure Production Process of Pet Care Figure Manufacturing Cost Structure of Pet Care Figure Channel Status of Pet Care Table Major Distributors of Pet Care with Contact Information Table Major Downstream Buyers of Pet Care with Contact Information Table Global Pet Care Value ($) by Type (2014-2019) Table Global Pet Care Value ($) Share by Type (2014-2019) Figure Global Pet Care Value ($) Share by Type (2014-2019) Table Global Pet Care Production by Type (2014-2019) Table Global Pet Care Production Share by Type (2014-2019) Figure Global Pet Care Production Share by Type (2014-2019) Figure Global Pet Care Value ($) and Growth Rate of Pet Food Figure Global Pet Care Value ($) and Growth Rate of Veterinary Care Figure Global Pet Care Value ($) and Growth Rate of OTC Supplies Figure Global Pet Care Value ($) and Growth Rate of Live Animal Purchase Figure Global Pet Care Value ($) and Growth Rate of Pet Boarding Figure Global Pet Care Price by Type (2014-2019) Table Global Pet Care Consumption by Application (2014-2019) Table Global Pet Care Consumption Market Share by Application (2014-2019) Figure Global Pet Care Consumption Market Share by Application (2014-2019) Table Downstream Buyers Introduction by Application Figure Global Pet Care Consumption and Growth Rate of Pet Clinic (2014-2019) Figure Global Pet Care Consumption and Growth Rate of Supermarket (2014-2019) Figure Global Pet Care Consumption and Growth Rate of Online Sales (2014-2019) Figure Global Pet Care Consumption and Growth Rate of Specialty Stores (2014-2019) Table Global Pet Care Value ($) by Region (2014-2019) Table Global Pet Care Value ($) Market Share by Region (2014-2019) Figure Global Pet Care Value ($) Market Share by Region (2014-2019) Table Global Pet Care Production by Region (2014-2019) Table Global Pet Care Production Market Share by Region (2014-2019) Figure Global Pet Care Production Market Share by Region (2014-2019) Table Global Pet Care Production, Value ($), Price and Gross Margin (2014-2019) Table North America Pet Care Production, Value ($), Price and Gross Margin (2014-2019) Table Europe Pet Care Production, Value ($), Price and Gross Margin (2014-2019) Table China Pet Care Production, Value ($), Price and Gross Margin (2014-2019) Table Japan Pet Care Production, Value ($), Price and Gross Margin (2014-2019) Table Middle East & Africa Pet Care Production, Value ($), Price and Gross Margin (2014-2019) Table India Pet Care Production, Value ($), Price and Gross Margin (2014-2019) Table South America Pet Care Production, Value ($), Price and Gross Margin (2014-2019) Table Global Pet Care Consumption by Regions (2014-2019) Figure Global Pet Care Consumption Share by Regions (2014-2019) Table North America Pet Care Production, Consumption, Export, Import (2014-2019) Table Europe Pet Care Production, Consumption, Export, Import (2014-2019) Table China Pet Care Production, Consumption, Export, Import (2014-2019) Table Japan Pet Care Production, Consumption, Export, Import (2014-2019) Table Middle East & Africa Pet Care Production, Consumption, Export, Import (2014-2019) Table India Pet Care Production, Consumption, Export, Import (2014-2019) Table South America Pet Care Production, Consumption, Export, Import (2014-2019) Figure North America Pet Care Production and Growth Rate Analysis Figure North America Pet Care Consumption and Growth Rate Analysis Figure North America Pet Care SWOT Analysis Figure Europe Pet Care Production and Growth Rate Analysis Figure Europe Pet Care Consumption and Growth Rate Analysis Figure Europe Pet Care SWOT Analysis Figure China Pet Care Production and Growth Rate Analysis Figure China Pet Care Consumption and Growth Rate Analysis Figure China Pet Care SWOT Analysis Figure Japan Pet Care Production and Growth Rate Analysis Figure Japan Pet Care Consumption and Growth Rate Analysis Figure Japan Pet Care SWOT Analysis Figure Middle East & Africa Pet Care Production and Growth Rate Analysis Figure Middle East & Africa Pet Care Consumption and Growth Rate Analysis Figure Middle East & Africa Pet Care SWOT Analysis Figure India Pet Care Production and Growth Rate Analysis Figure India Pet Care Consumption and Growth Rate Analysis Figure India Pet Care SWOT Analysis Figure South America Pet Care Production and Growth Rate Analysis Figure South America Pet Care Consumption and Growth Rate Analysis Figure South America Pet Care SWOT Analysis Figure Top 3 Market Share of Pet Care Companies Figure Top 6 Market Share of Pet Care Companies Table Mergers, Acquisitions and Expansion Analysis Table Company Profiles Table Product Introduction Table Partner in Pet Food Production, Value ($), Price, Gross Margin 2014-2019 Figure Partner in Pet Food Production and Growth Rate Figure Partner in Pet Food Value ($) Market Share 2014-2019 Figure Partner in Pet Food Market Share of Pet Care Segmented by Region in 2018 Table Company Profiles Table Product Introduction Table Big Heart Pet Brands Production, Value ($), Price, Gross Margin 2014-2019 Figure Big Heart Pet Brands Production and Growth Rate Figure Big Heart Pet Brands Value ($) Market Share 2014-2019 Figure Big Heart Pet Brands Market Share of Pet Care Segmented by Region in 2018 Table Company Profiles Table Product Introduction Table Ainsworth Pet Nutrition Production, Value ($), Price, Gross Margin 2014-2019 Figure Ainsworth Pet Nutrition Production and Growth Rate Figure Ainsworth Pet Nutrition Value ($) Market Share 2014-2019 Figure Ainsworth Pet Nutrition Market Share of Pet Care Segmented by Region in 2018 Table Company Profiles Table Product Introduction Table Spectrum Brands Production, Value ($), Price, Gross Margin 2014-2019 Figure Spectrum Brands Production and Growth Rate Figure Spectrum Brands Value ($) Market Share 2014-2019 Figure Spectrum Brands Market Share of Pet Care Segmented by Region in 2018 Table Company Profiles Table Product Introduction Table Royal Canin Production, Value ($), Price, Gross Margin 2014-2019 Figure Royal Canin Production and Growth Rate Figure Royal Canin Value ($) Market Share 2014-2019 Figure Royal Canin Market Share of Pet Care Segmented by Region in 2018 Table Company Profiles Table Product Introduction Table Nestle Production, Value ($), Price, Gross Margin 2014-2019 Figure Nestle Production and Growth Rate Figure Nestle Value ($) Market Share 2014-2019 Figure Nestle Market Share of Pet Care Segmented by Region in 2018 Table Company Profiles Table Product Introduction Table Blue Buffalo Production, Value ($), Price, Gross Margin 2014-2019 Figure Blue Buffalo Production and Growth Rate Figure Blue Buffalo Value ($) Market Share 2014-2019 Figure Blue Buffalo Market Share of Pet Care Segmented by Region in 2018 Table Company Profiles Table Product Introduction Table American Nutrition Production, Value ($), Price, Gross Margin 2014-2019 Figure American Nutrition Production and Growth Rate Figure American Nutrition Value ($) Market Share 2014-2019 Figure American Nutrition Market Share of Pet Care Segmented by Region in 2018 Table Company Profiles Table Product Introduction Table C & D Foods Production, Value ($), Price, Gross Margin 2014-2019 Figure C & D Foods Production and Growth Rate Figure C & D Foods Value ($) Market Share 2014-2019 Figure C & D Foods Market Share of Pet Care Segmented by Region in 2018 Table Company Profiles Table Product Introduction Table Marukan Production, Value ($), Price, Gross Margin 2014-2019 Figure Marukan Production and Growth Rate Figure Marukan Value ($) Market Share 2014-2019 Figure Marukan Market Share of Pet Care Segmented by Region in 2018 Table Company Profiles Table Product Introduction Table Bob Martin (UK) Production, Value ($), Price, Gross Margin 2014-2019 Figure Bob Martin (UK) Production and Growth Rate Figure Bob Martin (UK) Value ($) Market Share 2014-2019 Figure Bob Martin (UK) Market Share of Pet Care Segmented by Region in 2018 Table Company Profiles Table Product Introduction Table Maruha Nichiro Holdings Production, Value ($), Price, Gross Margin 2014-2019 Figure Maruha Nichiro Holdings Production and Growth Rate Figure Maruha Nichiro Holdings Value ($) Market Share 2014-2019 Figure Maruha Nichiro Holdings Market Share of Pet Care Segmented by Region in 2018 Table Company Profiles Table Product Introduction Table Nisshin Seifun Group Production, Value ($), Price, Gross Margin 2014-2019 Figure Nisshin Seifun Group Production and Growth Rate Figure Nisshin Seifun Group Value ($) Market Share 2014-2019 Figure Nisshin Seifun Group Market Share of Pet Care Segmented by Region in 2018 Table Company Profiles Table Product Introduction Table Mars, Incorporated Production, Value ($), Price, Gross Margin 2014-2019 Figure Mars, Incorporated Production and Growth Rate Figure Mars, Incorporated Value ($) Market Share 2014-2019 Figure Mars, Incorporated Market Share of Pet Care Segmented by Region in 2018 Table Company Profiles Table Product Introduction Table Iris Ohyama Production, Value ($), Price, Gross Margin 2014-2019 Figure Iris Ohyama Production and Growth Rate Figure Iris Ohyama Value ($) Market Share 2014-2019 Figure Iris Ohyama Market Share of Pet Care Segmented by Region in 2018 Table Company Profiles Table Product Introduction Table Biomir Venture LLP Production, Value ($), Price, Gross Margin 2014-2019 Figure Biomir Venture LLP Production and Growth Rate Figure Biomir Venture LLP Value ($) Market Share 2014-2019 Figure Biomir Venture LLP Market Share of Pet Care Segmented by Region in 2018 Table Company Profiles Table Product Introduction Table Colgate-Palmolive Company Production, Value ($), Price, Gross Margin 2014-2019 Figure Colgate-Palmolive Company Production and Growth Rate Figure Colgate-Palmolive Company Value ($) Market Share 2014-2019 Figure Colgate-Palmolive Company Market Share of Pet Care Segmented by Region in 2018 Table Company Profiles Table Product Introduction Table Diamond Pet Foods Production, Value ($), Price, Gross Margin 2014-2019 Figure Diamond Pet Foods Production and Growth Rate Figure Diamond Pet Foods Value ($) Market Share 2014-2019 Figure Diamond Pet Foods Market Share of Pet Care Segmented by Region in 2018 Table Company Profiles Table Product Introduction Table MogianaAlimentos Production, Value ($), Price, Gross Margin 2014-2019 Figure MogianaAlimentos Production and Growth Rate Figure MogianaAlimentos Value ($) Market Share 2014-2019 Figure MogianaAlimentos Market Share of Pet Care Segmented by Region in 2018 Table Company Profiles Table Product Introduction Table Azan International Production, Value ($), Price, Gross Margin 2014-2019 Figure Azan International Production and Growth Rate Figure Azan International Value ($) Market Share 2014-2019 Figure Azan International Market Share of Pet Care Segmented by Region in 2018 Table Company Profiles Table Product Introduction Table ADM Production, Value ($), Price, Gross Margin 2014-2019 Figure ADM Production and Growth Rate Figure ADM Value ($) Market Share 2014-2019 Figure ADM Market Share of Pet Care Segmented by Region in 2018 Table Company Profiles Table Product Introduction Table Nutriara Alimentos Production, Value ($), Price, Gross Margin 2014-2019 Figure Nutriara Alimentos Production and Growth Rate Figure Nutriara Alimentos Value ($) Market Share 2014-2019 Figure Nutriara Alimentos Market Share of Pet Care Segmented by Region in 2018 Table Company Profiles Table Product Introduction Table Agrolimen Production, Value ($), Price, Gross Margin 2014-2019 Figure Agrolimen Production and Growth Rate Figure Agrolimen Value ($) Market Share 2014-2019 Figure Agrolimen Market Share of Pet Care Segmented by Region in 2018 Table Company Profiles Table Product Introduction Table Bolton Group Production, Value ($), Price, Gross Margin 2014-2019 Figure Bolton Group Production and Growth Rate Figure Bolton Group Value ($) Market Share 2014-2019 Figure Bolton Group Market Share of Pet Care Segmented by Region in 2018 Table Company Profiles Table Product Introduction Table Agro Food Industries Production, Value ($), Price, Gross Margin 2014-2019 Figure Agro Food Industries Production and Growth Rate Figure Agro Food Industries Value ($) Market Share 2014-2019 Figure Agro Food Industries Market Share of Pet Care Segmented by Region in 2018 Table Company Profiles Table Product Introduction Table Alaska Naturals Production, Value ($), Price, Gross Margin 2014-2019 Figure Alaska Naturals Production and Growth Rate Figure Alaska Naturals Value ($) Market Share 2014-2019 Figure Alaska Naturals Market Share of Pet Care Segmented by Region in 2018 Table Company Profiles Table Product Introduction Table Paragon Pet Products Production, Value ($), Price, Gross Margin 2014-2019 Figure Paragon Pet Products Production and Growth Rate Figure Paragon Pet Products Value ($) Market Share 2014-2019 Figure Paragon Pet Products Market Share of Pet Care Segmented by Region in 2018 Table Global Pet Care Market Value ($) Forecast, by Type Table Global Pet Care Market Volume Forecast, by Type Figure Global Pet Care Market Value ($) and Growth Rate Forecast of Pet Food (2019-2024) Figure Global Pet Care Market Volume and Growth Rate Forecast of Pet Food (2019-2024) Figure Global Pet Care Market Value ($) and Growth Rate Forecast of Veterinary Care (2019-2024) Figure Global Pet Care Market Volume and Growth Rate Forecast of Veterinary Care (2019-2024) Figure Global Pet Care Market Value ($) and Growth Rate Forecast of OTC Supplies (2019-2024) Figure Global Pet Care Market Volume and Growth Rate Forecast of OTC Supplies (2019-2024) Figure Global Pet Care Market Value ($) and Growth Rate Forecast of Live Animal Purchase (2019-2024) Figure Global Pet Care Market Volume and Growth Rate Forecast of Live Animal Purchase (2019-2024) Figure Global Pet Care Market Value ($) and Growth Rate Forecast of Pet Boarding (2019-2024) Figure Global Pet Care Market Volume and Growth Rate Forecast of Pet Boarding (2019-2024) Table Global Market Value ($) Forecast by Application (2019-2024) Table Global Market Volume Forecast by Application (2019-2024) Figure Global Pet Care Consumption and Growth Rate of Pet Clinic (2014-2019) Figure Global Pet Care Consumption and Growth Rate of Supermarket (2014-2019) Figure Global Pet Care Consumption and Growth Rate of Online Sales (2014-2019) Figure Global Pet Care Consumption and Growth Rate of Specialty Stores (2014-2019) Figure Market Value ($) and Growth Rate Forecast of Specialty Stores (2019-2024) Figure Market Volume and Growth Rate Forecast of Specialty Stores (2019-2024) Figure North America Market Value ($) and Growth Rate Forecast (2019-2024) Table North America Consumption and Growth Rate Forecast (2019-2024) Figure Europe Market Value ($) and Growth Rate Forecast (2019-2024) Table Europe Consumption and Growth Rate Forecast (2019-2024) Figure China Market Value ($) and Growth Rate Forecast (2019-2024) Table China Consumption and Growth Rate Forecast (2019-2024) Figure Japan Market Value ($) and Growth Rate Forecast (2019-2024) Table Japan Consumption and Growth Rate Forecast (2019-2024) Figure Middle East & Africa Market Value ($) and Growth Rate Forecast (2019-2024) Table Middle East & Africa Consumption and Growth Rate Forecast (2019-2024) Figure India Market Value ($) and Growth Rate Forecast (2019-2024) Table India Consumption and Growth Rate Forecast (2019-2024) Figure South America Market Value ($) and Growth Rate Forecast (2019-2024) Table South America Consumption and Growth Rate Forecast (2019-2024) Figure Industry Resource/Technology/Labor Importance Analysis Table New Entrants SWOT Analysis Table New Project Analysis of Investment Recovery
Inquiry For Buying
Pet Care
Request Sample
Pet Care