Smart Labels Market Size, Share, and Trends Analysis Report
CAGR :

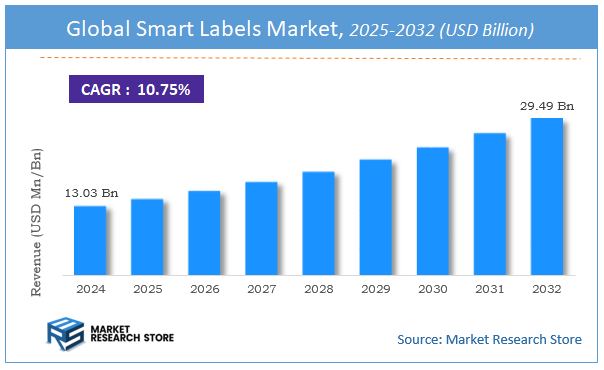
| Market Size 2024 (Base Year) | USD 13.03 Billion |
| Market Size 2032 (Forecast Year) | USD 29.49 Billion |
| CAGR | 10.75% |
| Forecast Period | 2025 - 2032 |
| Historical Period | 2020 - 2024 |
Market Research Store has published a report on the global smart labels market, estimating its value at USD 13.03 Billion in 2024, with projections indicating it will reach USD 29.49 Billion by the end of 2032. The market is expected to expand at a compound annual growth rate (CAGR) of around 10.75% over the forecast period. The report examines the factors driving market growth, the obstacles that could hinder this expansion, and the opportunities that may emerge in the smart labels industry. Additionally, it offers a detailed analysis of how these elements will affect demand dynamics and market performance throughout the forecast period.
Smart Labels Market: Overview
The growth of the smart labels market is fueled by rising global demand across various industries and applications. The report highlights lucrative opportunities, analyzing cost structures, key segments, emerging trends, regional dynamics, and advancements by leading players to provide comprehensive market insights. The smart labels market report offers a detailed industry analysis from 2024 to 2032, combining quantitative and qualitative insights. It examines key factors such as pricing, market penetration, GDP impact, industry dynamics, major players, consumer behavior, and socio-economic conditions. Structured into multiple sections, the report provides a comprehensive perspective on the market from all angles.
Key sections of the smart labels market report include market segments, outlook, competitive landscape, and company profiles. Market Segments offer in-depth details based on Product Type, Application, End User, and other relevant classifications to support strategic marketing initiatives. Market Outlook thoroughly analyzes market trends, growth drivers, restraints, opportunities, challenges, Porter’s Five Forces framework, macroeconomic factors, value chain analysis, and pricing trends shaping the market now and in the future. The Competitive Landscape and Company Profiles section highlights major players, their strategies, and market positioning to guide investment and business decisions. The report also identifies innovation trends, new business opportunities, and investment prospects for the forecast period.
Key Highlights:
- As per the analysis shared by our research analyst, the global smart labels market is estimated to grow annually at a CAGR of around 10.75% over the forecast period (2025-2032).
- In terms of revenue, the global smart labels market size was valued at around USD 13.03 Billion in 2024 and is projected to reach USD 29.49 Billion by 2032.
- The market is projected to grow at a significant rate due to Increasing adoption in supply chain tracking, growing demand for smart inventory management, and rising need for anti-counterfeiting measures are fueling the Smart Labels market.
- Based on the Product Type, the RFID segment is growing at a high rate and will continue to dominate the global market as per industry projections.
- On the basis of Application, the Retail Inventory segment is anticipated to command the largest market share.
- In terms of End User, the Retail segment is projected to lead the global market.
- Based on region, Europe is projected to dominate the global market during the forecast period.
Smart Labels Market: Report Scope
This report thoroughly analyzes the smart labels market, exploring its historical trends, current state, and future projections. The market estimates presented result from a robust research methodology, incorporating primary research, secondary sources, and expert opinions. These estimates are influenced by the prevailing market dynamics as well as key economic, social, and political factors. Furthermore, the report considers the impact of regulations, government expenditures, and advancements in research and development on the market. Both positive and negative shifts are evaluated to ensure a comprehensive and accurate market outlook.
| Report Attributes | Report Details |
|---|---|
| Report Name | Smart Labels Market |
| Market Size in 2024 | USD 13.03 Billion |
| Market Forecast in 2032 | USD 29.49 Billion |
| Growth Rate | CAGR of 10.75% |
| Number of Pages | 243 |
| Key Companies Covered | Thinfilm, NXP Semiconductors, Avery Dennison, Smartrac, Paragon ID, CCL Industries, PragmatIC, Checkpoints Systems, RFID Solutions, OmniID, TSOP, Identiv, SATO Holdings, Zebra Technologies, Watershed Monitoring |
| Segments Covered | By Product Type, By Application, By End User, and By Region |
| Regions Covered | North America, Europe, Asia Pacific (APAC), Latin America, The Middle East and Africa (MEA) |
| Base Year | 2024 |
| Historical Year | 2018 to 2024 |
| Forecast Year | 2025 to 2032 |
| Customization Scope | Avail customized purchase options to meet your exact research needs. Request For Customization |
Smart Labels Market: Dynamics
Key Growth Drivers :
The smart labels market is primarily driven by the increasing need for real-time inventory management and enhanced supply chain visibility across various industries. Businesses, particularly in retail, logistics, and healthcare, are adopting technologies like RFID and NFC to track assets, monitor product movement, and improve operational efficiency. This is further propelled by the rapid expansion of the e-commerce sector, which necessitates accurate and rapid data for order fulfillment, inventory control, and returns management. Additionally, a growing global concern over counterfeiting and the need for product authentication, especially in the pharmaceutical and luxury goods industries, is fueling demand for secure, data-rich labeling solutions. The widespread adoption of IoT and the integration of smart labels into connected ecosystems are also key catalysts for market growth.
Restraints :
Despite the clear benefits, the smart labels market faces several significant restraints. The high initial investment is a major barrier, as the cost of implementing a full smart labeling system—including hardware, software, and a new infrastructure—can be prohibitive for many small and medium-sized enterprises (SMEs). There is also a lack of standardized guidelines and interoperability across different smart label technologies, which can create compatibility issues and hinder seamless integration into complex supply chains. Furthermore, privacy and security concerns remain a challenge. As smart labels can collect and transmit sensitive data, there is a risk of unauthorized access or data misuse, which can erode consumer and corporate trust.
Opportunities :
The smart labels market presents numerous opportunities for future growth and innovation. The increasing demand for sustainable and eco-friendly products is a significant opportunity, as manufacturers can develop smart labels using biodegradable or recyclable materials to appeal to environmentally conscious consumers and meet emerging regulatory requirements. The expansion of smart labels into new applications, such as cold chain monitoring for perishable goods and patient monitoring in healthcare, is a lucrative avenue for market diversification. Moreover, the integration of advanced technologies like AI and machine learning with smart labels can enable predictive analytics for logistics and supply chain optimization, creating a new value proposition. The burgeoning home healthcare and a growing focus on brand authentication and consumer engagement via smartphones also present new and exciting opportunities.
Challenges :
The market is confronted by a number of complex challenges that require strategic solutions. One key challenge is the technical difficulty of ensuring consistent performance and durability of smart labels in harsh environmental conditions, such as extreme temperatures or high humidity. The industry also needs to address the "digital divide" in developing regions where a lack of digital infrastructure and low financial literacy can hinder widespread adoption. Intense competition from a growing number of players, including both traditional label manufacturers and new technology startups, is putting pressure on pricing and profit margins. Finally, ensuring the long-term viability of smart labels, particularly those with a power source, remains a challenge that requires continued research and development in areas like energy harvesting and battery-free designs.
Smart Labels Market: Segmentation Insights
The global smart labels market is segmented based on Product Type, Application, End User, and Region. All the segments of the smart labels market have been analyzed based on present & future trends and the market is estimated from 2024 to 2032.
Based on Product Type, the global smart labels market is divided into RFID, Electronic Article Surveillance Label, Sensing Label, Dynamic Display Label.
On the basis of Application, the global smart labels market is bifurcated into Retail Inventory, Perishable Goods.
In terms of End User, the global smart labels market is categorized into Retail, Healthcare, Logistics, Others.
Smart Labels Market: Regional Insights
North America, led by the United States, is the dominant region in the global smart labels market, holding the largest revenue share. This leadership is driven by advanced adoption across key sectors: stringent retail and pharmaceutical supply chain regulations (e.g., FDA's DSCSA), a mature e-commerce and logistics industry demanding RFID for inventory management, and high consumer electronics integration.
The presence of major technology providers and early widespread implementation of IoT solutions create a robust ecosystem. While Asia-Pacific is experiencing rapid growth due to manufacturing and retail expansion, North America's established regulatory framework, technological infrastructure, and high investment in automation solidify its position as the leading market.
Smart Labels Market: Competitive Landscape
The smart labels market report offers a thorough analysis of both established and emerging players within the market. It includes a detailed list of key companies, categorized based on the types of products they offer and other relevant factors. The report also highlights the market entry year for each player, providing further context for the research analysis.
The "Global Smart Labels Market" study offers valuable insights, focusing on the global market landscape, with an emphasis on major industry players such as;
- Thinfilm
- NXP Semiconductors
- Avery Dennison
- Smartrac
- Paragon ID
- CCL Industries
- PragmatIC
- Checkpoints Systems
- RFID Solutions
- OmniID
- TSOP
- Identiv
- SATO Holdings
- Zebra Technologies
- Watershed Monitoring
The Global Smart Labels Market is Segmented as Follows:
By Product Type
- RFID
- Electronic Article Surveillance Label
- Sensing Label
- Dynamic Display Label
By Application
- Retail Inventory
- Perishable Goods
By End User
- Retail
- Healthcare
- Logistics
- Others
By Region
- North America
- The U.S.
- Canada
- Mexico
- Europe
- France
- The UK
- Spain
- Germany
- Italy
- Rest of Europe
- Asia Pacific
- China
- Japan
- India
- Australia
- South Korea
- Rest of Asia Pacific
- The Middle East & Africa
- Saudi Arabia
- UAE
- Egypt
- Kuwait
- South Africa
- Rest of the Middle East & Africa
- Latin America
- Brazil
- Argentina
- Rest of Latin America
Frequently Asked Questions
Table Of Content
Table of Content 1 Report Overview 1.1 Study Scope 1.2 Key Market Segments 1.3 Regulatory Scenario by Region/Country 1.4 Market Investment Scenario Strategic 1.5 Market Analysis by Type 1.5.1 Global Smart Labels Market Share by Type (2020-2026) 1.5.2 Electronic Article Surveillance (EAS) 1.5.3 RFID 1.5.4 Sensing Label 1.5.5 NFC 1.5.6 Electronic Shelf Label (ESL) 1.6 Market by Application 1.6.1 Global Smart Labels Market Share by Application (2020-2026) 1.6.2 Retail 1.6.3 Healthcare & Pharmaceutical 1.6.4 Logistics 1.6.5 Manufacturing 1.6.6 Other End-user Industries 1.7 Smart Labels Industry Development Trends under COVID-19 Outbreak 1.7.1 Global COVID-19 Status Overview 1.7.2 Influence of COVID-19 Outbreak on Smart Labels Industry Development 2. Global Market Growth Trends 2.1 Industry Trends 2.1.1 SWOT Analysis 2.1.2 Porter’s Five Forces Analysis 2.2 Potential Market and Growth Potential Analysis 2.3 Industry News and Policies by Regions 2.3.1 Industry News 2.3.2 Industry Policies 2.4 Industry Trends Under COVID-19 3 Value Chain of Smart Labels Market 3.1 Value Chain Status 3.2 Smart Labels Manufacturing Cost Structure Analysis 3.2.1 Production Process Analysis 3.2.2 Manufacturing Cost Structure of Smart Labels 3.2.3 Labor Cost of Smart Labels 3.2.3.1 Labor Cost of Smart Labels Under COVID-19 3.3 Sales and Marketing Model Analysis 3.4 Downstream Major Customer Analysis (by Region) 3.5 Value Chain Status Under COVID-19 4 Players Profiles 4.1 Smartrac NV 4.1.1 Smartrac NV Basic Information 4.1.2 Smart Labels Product Profiles, Application and Specification 4.1.3 Smartrac NV Smart Labels Market Performance (2015-2020) 4.1.4 Smartrac NV Business Overview 4.2 Avery Dennison Corporation 4.2.1 Avery Dennison Corporation Basic Information 4.2.2 Smart Labels Product Profiles, Application and Specification 4.2.3 Avery Dennison Corporation Smart Labels Market Performance (2015-2020) 4.2.4 Avery Dennison Corporation Business Overview 4.3 Muehlbauer Holding AG & Co. 4.3.1 Muehlbauer Holding AG & Co. Basic Information 4.3.2 Smart Labels Product Profiles, Application and Specification 4.3.3 Muehlbauer Holding AG & Co. Smart Labels Market Performance (2015-2020) 4.3.4 Muehlbauer Holding AG & Co. Business Overview 4.4 CCL Industries Inc. 4.4.1 CCL Industries Inc. Basic Information 4.4.2 Smart Labels Product Profiles, Application and Specification 4.4.3 CCL Industries Inc. Smart Labels Market Performance (2015-2020) 4.4.4 CCL Industries Inc. Business Overview 4.5 Zebra Technologies Corporation 4.5.1 Zebra Technologies Corporation Basic Information 4.5.2 Smart Labels Product Profiles, Application and Specification 4.5.3 Zebra Technologies Corporation Smart Labels Market Performance (2015-2020) 4.5.4 Zebra Technologies Corporation Business Overview 4.6 Sato Holdings Corporation 4.6.1 Sato Holdings Corporation Basic Information 4.6.2 Smart Labels Product Profiles, Application and Specification 4.6.3 Sato Holdings Corporation Smart Labels Market Performance (2015-2020) 4.6.4 Sato Holdings Corporation Business Overview 4.7 Honeywell Productivity and Workflow Solutions (Intermec Inc.) 4.7.1 Honeywell Productivity and Workflow Solutions (Intermec Inc.) Basic Information 4.7.2 Smart Labels Product Profiles, Application and Specification 4.7.3 Honeywell Productivity and Workflow Solutions (Intermec Inc.) Smart Labels Market Performance (2015-2020) 4.7.4 Honeywell Productivity and Workflow Solutions (Intermec Inc.) Business Overview 4.8 Intermec 4.8.1 Intermec Basic Information 4.8.2 Smart Labels Product Profiles, Application and Specification 4.8.3 Intermec Smart Labels Market Performance (2015-2020) 4.8.4 Intermec Business Overview 4.9 Invengo Information Technology Co. Ltd 4.9.1 Invengo Information Technology Co. Ltd Basic Information 4.9.2 Smart Labels Product Profiles, Application and Specification 4.9.3 Invengo Information Technology Co. Ltd Smart Labels Market Performance (2015-2020) 4.9.4 Invengo Information Technology Co. Ltd Business Overview 4.10 Checkpoints Systems Inc. 4.10.1 Checkpoints Systems Inc. Basic Information 4.10.2 Smart Labels Product Profiles, Application and Specification 4.10.3 Checkpoints Systems Inc. Smart Labels Market Performance (2015-2020) 4.10.4 Checkpoints Systems Inc. Business Overview 4.11 Thin Film Electronics ASA 4.11.1 Thin Film Electronics ASA Basic Information 4.11.2 Smart Labels Product Profiles, Application and Specification 4.11.3 Thin Film Electronics ASA Smart Labels Market Performance (2015-2020) 4.11.4 Thin Film Electronics ASA Business Overview 4.12 Brady Corporation 4.12.1 Brady Corporation Basic Information 4.12.2 Smart Labels Product Profiles, Application and Specification 4.12.3 Brady Corporation Smart Labels Market Performance (2015-2020) 4.12.4 Brady Corporation Business Overview 5 Global Smart Labels Market Analysis by Regions 5.1 Global Smart Labels Sales, Revenue and Market Share by Regions 5.1.1 Global Smart Labels Sales by Regions (2015-2020) 5.1.2 Global Smart Labels Revenue by Regions (2015-2020) 5.2 North America Smart Labels Sales and Growth Rate (2015-2020) 5.3 Europe Smart Labels Sales and Growth Rate (2015-2020) 5.4 Asia-Pacific Smart Labels Sales and Growth Rate (2015-2020) 5.5 Middle East and Africa Smart Labels Sales and Growth Rate (2015-2020) 5.6 South America Smart Labels Sales and Growth Rate (2015-2020) 6 North America Smart Labels Market Analysis by Countries 6.1 North America Smart Labels Sales, Revenue and Market Share by Countries 6.1.1 North America Smart Labels Sales by Countries (2015-2020) 6.1.2 North America Smart Labels Revenue by Countries (2015-2020) 6.1.3 North America Smart Labels Market Under COVID-19 6.2 United States Smart Labels Sales and Growth Rate (2015-2020) 6.2.1 United States Smart Labels Market Under COVID-19 6.3 Canada Smart Labels Sales and Growth Rate (2015-2020) 6.4 Mexico Smart Labels Sales and Growth Rate (2015-2020) 7 Europe Smart Labels Market Analysis by Countries 7.1 Europe Smart Labels Sales, Revenue and Market Share by Countries 7.1.1 Europe Smart Labels Sales by Countries (2015-2020) 7.1.2 Europe Smart Labels Revenue by Countries (2015-2020) 7.1.3 Europe Smart Labels Market Under COVID-19 7.2 Germany Smart Labels Sales and Growth Rate (2015-2020) 7.2.1 Germany Smart Labels Market Under COVID-19 7.3 UK Smart Labels Sales and Growth Rate (2015-2020) 7.3.1 UK Smart Labels Market Under COVID-19 7.4 France Smart Labels Sales and Growth Rate (2015-2020) 7.4.1 France Smart Labels Market Under COVID-19 7.5 Italy Smart Labels Sales and Growth Rate (2015-2020) 7.5.1 Italy Smart Labels Market Under COVID-19 7.6 Spain Smart Labels Sales and Growth Rate (2015-2020) 7.6.1 Spain Smart Labels Market Under COVID-19 7.7 Russia Smart Labels Sales and Growth Rate (2015-2020) 7.7.1 Russia Smart Labels Market Under COVID-19 8 Asia-Pacific Smart Labels Market Analysis by Countries 8.1 Asia-Pacific Smart Labels Sales, Revenue and Market Share by Countries 8.1.1 Asia-Pacific Smart Labels Sales by Countries (2015-2020) 8.1.2 Asia-Pacific Smart Labels Revenue by Countries (2015-2020) 8.1.3 Asia-Pacific Smart Labels Market Under COVID-19 8.2 China Smart Labels Sales and Growth Rate (2015-2020) 8.2.1 China Smart Labels Market Under COVID-19 8.3 Japan Smart Labels Sales and Growth Rate (2015-2020) 8.3.1 Japan Smart Labels Market Under COVID-19 8.4 South Korea Smart Labels Sales and Growth Rate (2015-2020) 8.4.1 South Korea Smart Labels Market Under COVID-19 8.5 Australia Smart Labels Sales and Growth Rate (2015-2020) 8.6 India Smart Labels Sales and Growth Rate (2015-2020) 8.6.1 India Smart Labels Market Under COVID-19 8.7 Southeast Asia Smart Labels Sales and Growth Rate (2015-2020) 8.7.1 Southeast Asia Smart Labels Market Under COVID-19 9 Middle East and Africa Smart Labels Market Analysis by Countries 9.1 Middle East and Africa Smart Labels Sales, Revenue and Market Share by Countries 9.1.1 Middle East and Africa Smart Labels Sales by Countries (2015-2020) 9.1.2 Middle East and Africa Smart Labels Revenue by Countries (2015-2020) 9.1.3 Middle East and Africa Smart Labels Market Under COVID-19 9.2 Saudi Arabia Smart Labels Sales and Growth Rate (2015-2020) 9.3 UAE Smart Labels Sales and Growth Rate (2015-2020) 9.4 Egypt Smart Labels Sales and Growth Rate (2015-2020) 9.5 Nigeria Smart Labels Sales and Growth Rate (2015-2020) 9.6 South Africa Smart Labels Sales and Growth Rate (2015-2020) 10 South America Smart Labels Market Analysis by Countries 10.1 South America Smart Labels Sales, Revenue and Market Share by Countries 10.1.1 South America Smart Labels Sales by Countries (2015-2020) 10.1.2 South America Smart Labels Revenue by Countries (2015-2020) 10.1.3 South America Smart Labels Market Under COVID-19 10.2 Brazil Smart Labels Sales and Growth Rate (2015-2020) 10.2.1 Brazil Smart Labels Market Under COVID-19 10.3 Argentina Smart Labels Sales and Growth Rate (2015-2020) 10.4 Columbia Smart Labels Sales and Growth Rate (2015-2020) 10.5 Chile Smart Labels Sales and Growth Rate (2015-2020) 11 Global Smart Labels Market Segment by Types 11.1 Global Smart Labels Sales, Revenue and Market Share by Types (2015-2020) 11.1.1 Global Smart Labels Sales and Market Share by Types (2015-2020) 11.1.2 Global Smart Labels Revenue and Market Share by Types (2015-2020) 11.2 Electronic Article Surveillance (EAS) Sales and Price (2015-2020) 11.3 RFID Sales and Price (2015-2020) 11.4 Sensing Label Sales and Price (2015-2020) 11.5 NFC Sales and Price (2015-2020) 11.6 Electronic Shelf Label (ESL) Sales and Price (2015-2020) 12 Global Smart Labels Market Segment by Applications 12.1 Global Smart Labels Sales, Revenue and Market Share by Applications (2015-2020) 12.1.1 Global Smart Labels Sales and Market Share by Applications (2015-2020) 12.1.2 Global Smart Labels Revenue and Market Share by Applications (2015-2020) 12.2 Retail Sales, Revenue and Growth Rate (2015-2020) 12.3 Healthcare & Pharmaceutical Sales, Revenue and Growth Rate (2015-2020) 12.4 Logistics Sales, Revenue and Growth Rate (2015-2020) 12.5 Manufacturing Sales, Revenue and Growth Rate (2015-2020) 12.6 Other End-user Industries Sales, Revenue and Growth Rate (2015-2020) 13 Smart Labels Market Forecast by Regions (2020-2026) 13.1 Global Smart Labels Sales, Revenue and Growth Rate (2020-2026) 13.2 Smart Labels Market Forecast by Regions (2020-2026) 13.2.1 North America Smart Labels Market Forecast (2020-2026) 13.2.2 Europe Smart Labels Market Forecast (2020-2026) 13.2.3 Asia-Pacific Smart Labels Market Forecast (2020-2026) 13.2.4 Middle East and Africa Smart Labels Market Forecast (2020-2026) 13.2.5 South America Smart Labels Market Forecast (2020-2026) 13.3 Smart Labels Market Forecast by Types (2020-2026) 13.4 Smart Labels Market Forecast by Applications (2020-2026) 13.5 Smart Labels Market Forecast Under COVID-19 14 Appendix 14.1 Methodology 14.2 Research Data Source
Inquiry For Buying
Smart Labels
Request Sample
Smart Labels