Usb Market Size, Share, and Trends Analysis Report
CAGR :

| Market Size 2023 (Base Year) | USD 30.08 Billion |
| Market Size 2032 (Forecast Year) | USD 150.61 Billion |
| CAGR | 19.6% |
| Forecast Period | 2024 - 2032 |
| Historical Period | 2018 - 2023 |
Usb Market Insights
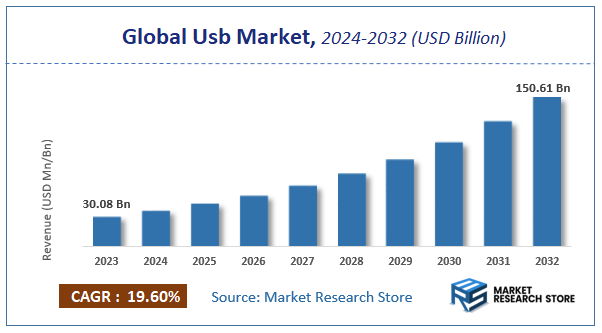
As per the published report by Market Research Store, the Global Usb Market size was estimated at USD 30.08 Billion in 2023 and is anticipated to reach reach USD 150.61 Billion by 2032, growing at a projected CAGR of 19.6% during the forecast period 2024-2032. The report provides a detailed analysis of the global Usb Market, including market trends, market dynamics, and market opportunities during the forecast period (2024-2032). It delves deeper into several market facets, such as market definition, size, growth, forecast, segmentation, competitive analysis, growth drivers, restraints, financial analysis, SWOT analysis, PORTER’s five force analysis, PESTEL analysis, market share analysis, cost-benefit analysis, challenges, restraints, strategic recommendations, and market players.
Usb Market: Overview
The growth of the USB market is fueled by rising global demand across various industries and applications. The report highlights lucrative opportunities, analyzing cost structures, key segments, emerging trends, regional dynamics, and advancements by leading players to provide comprehensive market insights. The USB market report offers a detailed industry analysis from 2024 to 2032, combining quantitative and qualitative insights. It examines key factors such as pricing, market penetration, GDP impact, industry dynamics, major players, consumer behavior, and socio-economic conditions. Structured into multiple sections, the report provides a comprehensive perspective on the market from all angles.
Key sections of the USB market report include market segments, outlook, competitive landscape, and company profiles. Market Segments offer in-depth details based on Product, Type, Connector Type, Application, and other relevant classifications to support strategic marketing initiatives. Market Outlook thoroughly analyzes market trends, growth drivers, restraints, opportunities, challenges, Porter’s Five Forces framework, macroeconomic factors, value chain analysis, and pricing trends shaping the market now and in the future. The Competitive Landscape and Company Profiles section highlights major players, their strategies, and market positioning to guide investment and business decisions. The report also identifies innovation trends, new business opportunities, and investment prospects for the forecast period.
Key Highlights:
- As per the analysis shared by our research analyst, the global USB market is estimated to grow annually at a CAGR of around 19.6% over the forecast period (2024-2032).
- In terms of revenue, the global USB market size was valued at around USD 30.08 Billion in 2023 and is projected to reach USD 150.61 Billion by 2032.
- The market is projected to grow at a significant rate due to increasing demand for data transfer and charging solutions, rising adoption of USB-C technology, growing consumer electronics usage, and advancements in high-speed and wireless connectivity.
- Based on the Product, the Webcam segment is growing at a high rate and will continue to dominate the global market as per industry projections.
- On the basis of Type, the USB 1.0 segment is anticipated to command the largest market share.
- In terms of Connector Type, the Type A segment is projected to lead the global market.
- By Application, the Consumer Electronics segment is predicted to dominate the global market.
- Based on region, Asia-Pacific is projected to dominate the global market during the forecast period.
Usb Market: Report Scope
This report thoroughly analyzes the USB market, exploring its historical trends, current state, and future projections. The market estimates presented result from a robust research methodology, incorporating primary research, secondary sources, and expert opinions. These estimates are influenced by the prevailing market dynamics as well as key economic, social, and political factors. Furthermore, the report considers the impact of regulations, government expenditures, and advancements in research and development on the market. Both positive and negative shifts are evaluated to ensure a comprehensive and accurate market outlook.
| Report Attributes | Report Details |
|---|---|
| Report Name | Usb Market |
| Market Size in 2023 | USD 30.08 Billion |
| Market Forecast in 2032 | USD 150.61 Billion |
| Growth Rate | CAGR of 19.6% |
| Number of Pages | 187 |
| Key Companies Covered | Corsair Memory Inc. (US), Adata Technology Co. Ltd. (Taiwan), Sandisk Corporation (US), Kingston Technology Corporation (US), Toshiba Corporation (Japan), Samsung Electronics Co. Ltd. (South Korea), Micron Consumer Products Group Inc. (US), Verbatim Americas LLC (US), Transcend Information Inc. (Taiwan), Intel Corporation (US), HP Inc. (US), Imation Corporation (Ojin Corporation) (US), Koninklijke Philips N.V. (Netherlands), Netac Technology Co Ltd. (China), Teclast Electronics Co. Ltd. (China) |
| Segments Covered | By Product, By Type, By Connector Type, By Application, and By Region |
| Regions Covered | North America, Europe, Asia Pacific (APAC), Latin America, Middle East, and Africa (MEA) |
| Base Year | 2023 |
| Historical Year | 2018 to 2023 |
| Forecast Year | 2024 to 2032 |
| Customization Scope | Avail customized purchase options to meet your exact research needs. Request For Customization |
Usb Market: Dynamics
Key Growth Drivers
The USB market in India is propelled by the ever-increasing demand for connectivity and data transfer across a vast ecosystem of electronic devices, including smartphones, laptops, tablets, and peripherals. The ubiquitous nature of USB ports as a standard interface for charging, data synchronization, and connecting accessories makes it indispensable for consumers and businesses alike. The continuous advancements in USB technology, such as the introduction of faster transfer speeds (USB 3.0, USB-C, USB4) and increased power delivery capabilities, drive adoption of newer devices and peripherals supporting these standards. Furthermore, the growing sales of consumer electronics in India, fueled by rising disposable incomes and digitalization, directly correlate with higher demand for USB-enabled devices and accessories. The convenience and plug-and-play functionality of USB further solidify its position as a primary connectivity solution.
Restraints
Despite its widespread adoption, the USB market in India faces certain restraints. The increasing popularity of wireless connectivity technologies like Bluetooth and Wi-Fi offers alternatives for certain data transfer and peripheral connection needs, potentially reducing reliance on physical USB connections in some applications. The proliferation of counterfeit and low-quality USB cables and chargers can lead to device damage and safety concerns, impacting consumer trust and potentially hindering the adoption of genuine products. The lack of standardization across all devices, with different USB connector types and power delivery capabilities sometimes causing compatibility issues, can frustrate users. The gradual shift towards USB-C as the dominant port may create a period of transition and require users to purchase new cables and adapters for older devices.
Opportunities
The USB market in India presents significant opportunities for innovation and growth. The increasing adoption of USB-C with its versatility for data, power, and video transfer opens up new possibilities for docking stations, portable displays, and high-speed data peripherals. The development of more robust and durable USB cables and connectors can address concerns about product lifespan and reliability. Furthermore, the integration of enhanced security features into USB devices, such as encryption and data protection, can cater to the growing awareness of cybersecurity. The rising demand for fast charging solutions via USB, particularly with the Power Delivery (PD) standard, creates a market for advanced chargers and power banks. Exploring niche applications like industrial USB solutions for data logging and device control in manufacturing and automation also presents growth avenues.
Challenges
The USB market in India faces challenges related to ensuring interoperability and compatibility across a diverse range of devices and USB standards. Combating the influx of counterfeit and substandard USB products requires stricter quality control measures and consumer awareness campaigns. Keeping pace with the rapid advancements in connectivity technologies and adapting USB to coexist and integrate with wireless solutions is crucial for long-term relevance. Managing the transition to USB-C and ensuring a smooth user experience during this shift requires clear communication and affordable adapter solutions. Finally, addressing the environmental concerns associated with electronic waste, including discarded USB cables and devices, through promoting recycling and sustainable manufacturing practices is an ongoing challenge for the industry.
Usb Market: Segmentation Insights
The global USB market is segmented based on Product, Type, Connector Type, Application, and Region. All the segments of the USB market have been analyzed based on present & future trends and the market is estimated from 2024 to 2032.
Based on Product, the global USB market is divided into Webcam, USB Flash Drives, Memory Card Readers, Digital Audio Players, Computer Peripherals, Scanners & Printers, Others.
On the basis of Type, the global USB market is bifurcated into USB 1.0, USB 2.0, USB 3.0, Others.
In terms of Connector Type, the global USB market is categorized into Type A, Type B, Type C, Lightning Connector.
Based on Application, the global USB market is split into Consumer Electronics, IT & Telecommunication, Automotive, Healthcare & Medical Devices, Others .
Usb Market: Regional Insights
The Asia-Pacific (APAC) region dominates the global USB market, holding the largest revenue share (over 50% in 2023), driven by massive electronics manufacturing hubs in China, South Korea, and Taiwan. The region benefits from strong demand for consumer electronics, data storage solutions, and industrial USB applications, supported by a robust semiconductor supply chain. North America follows as the second-largest market, fueled by high adoption of advanced USB technologies (USB4, Thunderbolt) in IT, automotive, and enterprise sectors.
Meanwhile, Europe shows steady growth due to increasing demand for high-speed data transfer in industrial and automotive applications. APAC is expected to maintain its lead, with China remaining the key production and consumption center, supported by rising 5G, IoT, and smart device adoption.
Usb Market: Competitive Landscape
The USB market report offers a thorough analysis of both established and emerging players within the market. It includes a detailed list of key companies, categorized based on the types of products they offer and other relevant factors. The report also highlights the market entry year for each player, providing further context for the research analysis.
The "Global Usb Market" study offers valuable insights, focusing on the global market landscape, with an emphasis on major industry players such as;
- Corsair Memory Inc. (US)
- Adata Technology Co. Ltd. (Taiwan)
- Sandisk Corporation (US)
- Kingston Technology Corporation (US)
- Toshiba Corporation (Japan)
- Samsung Electronics Co. Ltd. (South Korea)
- Micron Consumer Products Group Inc. (US)
- Verbatim Americas LLC (US)
- Transcend Information Inc. (Taiwan)
- Intel Corporation (US)
- HP Inc. (US)
- Imation Corporation (Ojin Corporation) (US)
- Koninklijke Philips N.V. (Netherlands)
- Netac Technology Co Ltd. (China)
- Teclast Electronics Co. Ltd. (China)
The Global Usb Market is Segmented as Follows:
By Product
- Webcam
- USB Flash Drives
- Memory Card Readers
- Digital Audio Players
- Computer Peripherals
- Scanners & Printers
- Others
By Type
- USB 1.0
- USB 2.0
- USB 3.0
- Others
By Connector Type
- Type A
- Type B
- Type C
- Lightning Connector
By Application
- Consumer Electronics
- IT & Telecommunication
- Automotive
- Healthcare & Medical Devices
- Others
By Region
- North America
- The U.S.
- Canada
- Mexico
- Europe
- France
- The UK
- Spain
- Germany
- Italy
- Rest of Europe
- Asia Pacific
- China
- Japan
- India
- Australia
- South Korea
- Rest of Asia Pacific
- The Middle East & Africa
- Saudi Arabia
- UAE
- Egypt
- Kuwait
- South Africa
- Rest of the Middle East & Africa
- Latin America
- Brazil
- Argentina
- Rest of Latin America
Market Evolution
This section evaluates the market position of the product or service by examining its development pathway and competitive dynamics. It provides a detailed overview of the product's growth stages, including the early (historical) phase, the mid-stage, and anticipated future advancements influenced by innovation and emerging technologies.
Porter’s Analysis
Porter’s Five Forces framework offers a strategic lens for assessing competitor behavior and the positioning of key players in the USB industry. This section explores the external factors shaping competitive dynamics and influencing market strategies in the years ahead. The analysis focuses on five critical forces:
- Competitive Rivalry
- Threat of New Entrants
- Threat of Substitutes
- Supplier Bargaining Power
- Buyer Bargaining Power
Value Chain & Market Attractiveness Analysis
The value chain analysis helps businesses optimize operations by mapping the product flow from suppliers to end consumers, identifying opportunities to streamline processes and gain a competitive edge. Segment-wise market attractiveness analysis evaluates key dimensions like product categories, demographics, and regions, assessing growth potential, market size, and profitability. This enables businesses to focus resources on high-potential segments for better ROI and long-term value.
PESTEL Analysis
PESTEL analysis is a powerful tool in market research reports that enhances market understanding by systematically examining the external macro-environmental factors influencing a business or industry. The acronym stands for Political, Economic, Social, Technological, Environmental, and Legal factors. By evaluating these dimensions, PESTEL analysis provides a comprehensive overview of the broader context within which a market operates, helping businesses identify potential opportunities and threats.
- Political factors assess government policies, stability, trade regulations, and political risks that could impact market operations.
- Economic factors examine variables like inflation, exchange rates, economic growth, and consumer spending power to determine market viability.
- Social factors explore cultural trends, demographics, and lifestyle changes that shape consumer behavior and preferences.
- Technological factors evaluate innovation, R&D, and technological advancements affecting product development and operational efficiencies.
- Environmental factors focus on sustainability, climate change impacts, and eco-friendly practices shaping market trends.
- Legal factors address compliance requirements, industry regulations, and intellectual property laws impacting market entry and operations.
Import-Export Analysis & Pricing Analysis
An import-export analysis is vital for market research, revealing global trade dynamics, trends, and opportunities. It examines trade volumes, product categories, and regional competitiveness, offering insights into supply chains and market demand. This section also analyzes past and future pricing trends, helping businesses optimize strategies and enabling consumers to assess product value effectively.
Usb Market: Company Profiles
The report identifies key players in the USB market through a competitive landscape and company profiles, evaluating their offerings, financial performance, strategies, and market positioning. It includes a SWOT analysis of the top 3-5 companies, assessing strengths, weaknesses, opportunities, and threats. The competitive landscape highlights rankings, recent activities (mergers, acquisitions, partnerships, product launches), and regional footprints using the Ace matrix. Customization is available to meet client-specific needs.
Regional & Industry Footprint
This section details the geographic reach, sales networks, and market penetration of companies profiled in the USB report, showcasing their operations and distribution across regions. It analyzes the alignment of companies with specific industry verticals, highlighting the industries they serve and the scope of their products and services within those sectors.
Ace Matrix
This section categorizes companies into four distinct groups—Active, Cutting Edge, Innovator, and Emerging—based on their product and business strategies. The evaluation of product strategy focuses on aspects such as the range and depth of offerings, commitment to innovation, product functionalities, and scalability. Key elements like global reach, sector coverage, strategic acquisitions, and long-term growth plans are considered for business strategy. This analysis provides a detailed view of companies' position within the market and highlights their potential for future growth and development.
Research Methodology
The qualitative and quantitative insights for the USB market are derived through a multi-faceted research approach, combining input from subject matter experts, primary research, and secondary data sources. Primary research includes gathering critical information via face-to-face or telephonic interviews, surveys, questionnaires, and feedback from industry professionals, key opinion leaders (KOLs), and customers. Regular interviews with industry experts are conducted to deepen the analysis and reinforce the existing data, ensuring a robust and well-rounded market understanding.
Secondary research for this report was carried out by the Market Research Store team, drawing on a variety of authoritative sources, such as:
- Official company websites, annual reports, financial statements, investor presentations, and SEC filings
- Internal and external proprietary databases, as well as relevant patent and regulatory databases
- Government publications, national statistical databases, and industry-specific market reports
- Media coverage, including news articles, press releases, and webcasts about market participants
- Paid industry databases for detailed market insights
Market Research Store conducted in-depth consultations with various key opinion leaders in the industry, including senior executives from top companies and regional leaders from end-user organizations. This effort aimed to gather critical insights on factors such as the market share of dominant brands in specific countries and regions, along with pricing strategies for products and services.
To determine total sales data, the research team conducted primary interviews across multiple countries with influential stakeholders, including:
- Distributors
- Marketing, Brand, and Product Managers
- Procurement and Production Managers
- Sales and Regional Sales Managers, Country Managers
- Technical Specialists
- C-Level Executives
These subject matter experts, with their extensive industry experience, helped validate and refine the findings. For secondary research, data were sourced from a wide range of materials, including online resources, company annual reports, industry publications, research papers, association reports, and government websites. These various sources provide a comprehensive and well-rounded perspective on the market.
Frequently Asked Questions
Table Of Content
List of Tables and Figures Figure Product Picture of Usb Table Product Specification of Usb Figure Market Concentration Ratio and Market Maturity Analysis of Usb Figure Global Usb Value ($) and Growth Rate from 2014-2024 Table Different Types of Usb Figure Global Usb Value ($) Segment by Type from 2014-2019 Figure 8G Picture Figure 16G Picture Figure 32G Picture Figure 64G Picture Figure 128G Picture Figure 256G Picture Figure 512G Picture Figure 1T Picture Table Different Applications of Usb Figure Global Usb Value ($) Segment by Applications from 2014-2019 Figure Personal Picture Figure Business Picture Figure Others Picture Table Research Regions of Usb Figure North America Usb Production Value ($) and Growth Rate (2014-2019) Figure Europe Usb Production Value ($) and Growth Rate (2014-2019) Table China Usb Production Value ($) and Growth Rate (2014-2019) Table Japan Usb Production Value ($) and Growth Rate (2014-2019) Table Middle East & Africa Usb Production Value ($) and Growth Rate (2014-2019) Table India Usb Production Value ($) and Growth Rate (2014-2019) Table South America Usb Production Value ($) and Growth Rate (2014-2019) Table Emerging Countries of Usb Table Growing Market of Usb Figure Industry Chain Analysis of Usb Table Upstream Raw Material Suppliers of Usb with Contact Information Table Major Players Manufacturing Base and Market Share ($) of Usb in 2018 Table Major Players Usb Product Types in 2018 Figure Production Process of Usb Figure Manufacturing Cost Structure of Usb Figure Channel Status of Usb Table Major Distributors of Usb with Contact Information Table Major Downstream Buyers of Usb with Contact Information Table Global Usb Value ($) by Type (2014-2019) Table Global Usb Value ($) Share by Type (2014-2019) Figure Global Usb Value ($) Share by Type (2014-2019) Table Global Usb Production by Type (2014-2019) Table Global Usb Production Share by Type (2014-2019) Figure Global Usb Production Share by Type (2014-2019) Figure Global Usb Value ($) and Growth Rate of 8G Figure Global Usb Value ($) and Growth Rate of 16G Figure Global Usb Value ($) and Growth Rate of 32G Figure Global Usb Value ($) and Growth Rate of 64G Figure Global Usb Value ($) and Growth Rate of 128G Figure Global Usb Value ($) and Growth Rate of 256G Figure Global Usb Value ($) and Growth Rate of 512G Figure Global Usb Value ($) and Growth Rate of 1T Figure Global Usb Price by Type (2014-2019) Table Global Usb Consumption by Application (2014-2019) Table Global Usb Consumption Market Share by Application (2014-2019) Figure Global Usb Consumption Market Share by Application (2014-2019) Table Downstream Buyers Introduction by Application Figure Global Usb Consumption and Growth Rate of Personal (2014-2019) Figure Global Usb Consumption and Growth Rate of Business (2014-2019) Figure Global Usb Consumption and Growth Rate of Others (2014-2019) Table Global Usb Value ($) by Region (2014-2019) Table Global Usb Value ($) Market Share by Region (2014-2019) Figure Global Usb Value ($) Market Share by Region (2014-2019) Table Global Usb Production by Region (2014-2019) Table Global Usb Production Market Share by Region (2014-2019) Figure Global Usb Production Market Share by Region (2014-2019) Table Global Usb Production, Value ($), Price and Gross Margin (2014-2019) Table North America Usb Production, Value ($), Price and Gross Margin (2014-2019) Table Europe Usb Production, Value ($), Price and Gross Margin (2014-2019) Table China Usb Production, Value ($), Price and Gross Margin (2014-2019) Table Japan Usb Production, Value ($), Price and Gross Margin (2014-2019) Table Middle East & Africa Usb Production, Value ($), Price and Gross Margin (2014-2019) Table India Usb Production, Value ($), Price and Gross Margin (2014-2019) Table South America Usb Production, Value ($), Price and Gross Margin (2014-2019) Table Global Usb Consumption by Regions (2014-2019) Figure Global Usb Consumption Share by Regions (2014-2019) Table North America Usb Production, Consumption, Export, Import (2014-2019) Table Europe Usb Production, Consumption, Export, Import (2014-2019) Table China Usb Production, Consumption, Export, Import (2014-2019) Table Japan Usb Production, Consumption, Export, Import (2014-2019) Table Middle East & Africa Usb Production, Consumption, Export, Import (2014-2019) Table India Usb Production, Consumption, Export, Import (2014-2019) Table South America Usb Production, Consumption, Export, Import (2014-2019) Figure North America Usb Production and Growth Rate Analysis Figure North America Usb Consumption and Growth Rate Analysis Figure North America Usb SWOT Analysis Figure Europe Usb Production and Growth Rate Analysis Figure Europe Usb Consumption and Growth Rate Analysis Figure Europe Usb SWOT Analysis Figure China Usb Production and Growth Rate Analysis Figure China Usb Consumption and Growth Rate Analysis Figure China Usb SWOT Analysis Figure Japan Usb Production and Growth Rate Analysis Figure Japan Usb Consumption and Growth Rate Analysis Figure Japan Usb SWOT Analysis Figure Middle East & Africa Usb Production and Growth Rate Analysis Figure Middle East & Africa Usb Consumption and Growth Rate Analysis Figure Middle East & Africa Usb SWOT Analysis Figure India Usb Production and Growth Rate Analysis Figure India Usb Consumption and Growth Rate Analysis Figure India Usb SWOT Analysis Figure South America Usb Production and Growth Rate Analysis Figure South America Usb Consumption and Growth Rate Analysis Figure South America Usb SWOT Analysis Figure Top 3 Market Share of Usb Companies Figure Top 6 Market Share of Usb Companies Table Mergers, Acquisitions and Expansion Analysis Table Company Profiles Table Product Introduction Table DM Production, Value ($), Price, Gross Margin 2014-2019 Figure DM Production and Growth Rate Figure DM Value ($) Market Share 2014-2019 Figure DM Market Share of Usb Segmented by Region in 2018 Table Company Profiles Table Product Introduction Table Sandisk Production, Value ($), Price, Gross Margin 2014-2019 Figure Sandisk Production and Growth Rate Figure Sandisk Value ($) Market Share 2014-2019 Figure Sandisk Market Share of Usb Segmented by Region in 2018 Table Company Profiles Table Product Introduction Table IDiskk Production, Value ($), Price, Gross Margin 2014-2019 Figure IDiskk Production and Growth Rate Figure IDiskk Value ($) Market Share 2014-2019 Figure IDiskk Market Share of Usb Segmented by Region in 2018 Table Company Profiles Table Product Introduction Table Moser Baer Production, Value ($), Price, Gross Margin 2014-2019 Figure Moser Baer Production and Growth Rate Figure Moser Baer Value ($) Market Share 2014-2019 Figure Moser Baer Market Share of Usb Segmented by Region in 2018 Table Company Profiles Table Product Introduction Table Sony Production, Value ($), Price, Gross Margin 2014-2019 Figure Sony Production and Growth Rate Figure Sony Value ($) Market Share 2014-2019 Figure Sony Market Share of Usb Segmented by Region in 2018 Table Company Profiles Table Product Introduction Table Corsair Production, Value ($), Price, Gross Margin 2014-2019 Figure Corsair Production and Growth Rate Figure Corsair Value ($) Market Share 2014-2019 Figure Corsair Market Share of Usb Segmented by Region in 2018 Table Company Profiles Table Product Introduction Table Kingston Production, Value ($), Price, Gross Margin 2014-2019 Figure Kingston Production and Growth Rate Figure Kingston Value ($) Market Share 2014-2019 Figure Kingston Market Share of Usb Segmented by Region in 2018 Table Company Profiles Table Product Introduction Table Toshiba Production, Value ($), Price, Gross Margin 2014-2019 Figure Toshiba Production and Growth Rate Figure Toshiba Value ($) Market Share 2014-2019 Figure Toshiba Market Share of Usb Segmented by Region in 2018 Table Company Profiles Table Product Introduction Table Transcend Production, Value ($), Price, Gross Margin 2014-2019 Figure Transcend Production and Growth Rate Figure Transcend Value ($) Market Share 2014-2019 Figure Transcend Market Share of Usb Segmented by Region in 2018 Table Company Profiles Table Product Introduction Table HP Production, Value ($), Price, Gross Margin 2014-2019 Figure HP Production and Growth Rate Figure HP Value ($) Market Share 2014-2019 Figure HP Market Share of Usb Segmented by Region in 2018 Table Company Profiles Table Product Introduction Table Imation Production, Value ($), Price, Gross Margin 2014-2019 Figure Imation Production and Growth Rate Figure Imation Value ($) Market Share 2014-2019 Figure Imation Market Share of Usb Segmented by Region in 2018 Table Global Usb Market Value ($) Forecast, by Type Table Global Usb Market Volume Forecast, by Type Figure Global Usb Market Value ($) and Growth Rate Forecast of 8G (2019-2024) Figure Global Usb Market Volume and Growth Rate Forecast of 8G (2019-2024) Figure Global Usb Market Value ($) and Growth Rate Forecast of 16G (2019-2024) Figure Global Usb Market Volume and Growth Rate Forecast of 16G (2019-2024) Figure Global Usb Market Value ($) and Growth Rate Forecast of 32G (2019-2024) Figure Global Usb Market Volume and Growth Rate Forecast of 32G (2019-2024) Figure Global Usb Market Value ($) and Growth Rate Forecast of 64G (2019-2024) Figure Global Usb Market Volume and Growth Rate Forecast of 64G (2019-2024) Figure Global Usb Market Value ($) and Growth Rate Forecast of 128G (2019-2024) Figure Global Usb Market Volume and Growth Rate Forecast of 128G (2019-2024) Figure Global Usb Market Value ($) and Growth Rate Forecast of 256G (2019-2024) Figure Global Usb Market Volume and Growth Rate Forecast of 256G (2019-2024) Figure Global Usb Market Value ($) and Growth Rate Forecast of 512G (2019-2024) Figure Global Usb Market Volume and Growth Rate Forecast of 512G (2019-2024) Figure Global Usb Market Value ($) and Growth Rate Forecast of 1T (2019-2024) Figure Global Usb Market Volume and Growth Rate Forecast of 1T (2019-2024) Table Global Market Value ($) Forecast by Application (2019-2024) Table Global Market Volume Forecast by Application (2019-2024) Figure Global Usb Consumption and Growth Rate of Personal (2014-2019) Figure Global Usb Consumption and Growth Rate of Business (2014-2019) Figure Global Usb Consumption and Growth Rate of Others (2014-2019) Figure Market Value ($) and Growth Rate Forecast of Others (2019-2024) Figure Market Volume and Growth Rate Forecast of Others (2019-2024) Figure North America Market Value ($) and Growth Rate Forecast (2019-2024) Table North America Consumption and Growth Rate Forecast (2019-2024) Figure Europe Market Value ($) and Growth Rate Forecast (2019-2024) Table Europe Consumption and Growth Rate Forecast (2019-2024) Figure China Market Value ($) and Growth Rate Forecast (2019-2024) Table China Consumption and Growth Rate Forecast (2019-2024) Figure Japan Market Value ($) and Growth Rate Forecast (2019-2024) Table Japan Consumption and Growth Rate Forecast (2019-2024) Figure Middle East & Africa Market Value ($) and Growth Rate Forecast (2019-2024) Table Middle East & Africa Consumption and Growth Rate Forecast (2019-2024) Figure India Market Value ($) and Growth Rate Forecast (2019-2024) Table India Consumption and Growth Rate Forecast (2019-2024) Figure South America Market Value ($) and Growth Rate Forecast (2019-2024) Table South America Consumption and Growth Rate Forecast (2019-2024) Figure Industry Resource/Technology/Labor Importance Analysis Table New Entrants SWOT Analysis Table New Project Analysis of Investment Recovery
Inquiry For Buying
Usb
Request Sample
Usb