Waterproof Camera Market Size, Share, and Trends Analysis Report
CAGR :

| Market Size 2023 (Base Year) | USD 1110.71 Million |
| Market Size 2032 (Forecast Year) | USD 2147.39 Million |
| CAGR | 7.6% |
| Forecast Period | 2024 - 2032 |
| Historical Period | 2018 - 2023 |
Waterproof Camera Market Insights
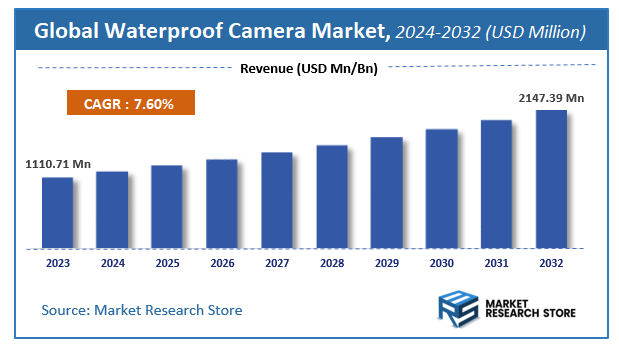
As per the published report by Market Research Store, the Global Waterproof Camera Market size was estimated at USD 1110.71 Million in 2023 and is anticipated to reach reach USD 2147.39 Million by 2032, growing at a projected CAGR of 7.6% during the forecast period 2024-2032. The report provides a detailed analysis of the global Waterproof Camera Market, including market trends, market dynamics, and market opportunities during the forecast period (2024-2032). It delves deeper into several market facets, such as market definition, size, growth, forecast, segmentation, competitive analysis, growth drivers, restraints, financial analysis, SWOT analysis, PORTER’s five force analysis, PESTEL analysis, market share analysis, cost-benefit analysis, challenges, restraints, strategic recommendations, and market players.
Waterproof Camera Market: Overview
The growth of the waterproof camera market is fueled by rising global demand across various industries and applications. The report highlights lucrative opportunities, analyzing cost structures, key segments, emerging trends, regional dynamics, and advancements by leading players to provide comprehensive market insights. The waterproof camera market report offers a detailed industry analysis from 2024 to 2032, combining quantitative and qualitative insights. It examines key factors such as pricing, market penetration, GDP impact, industry dynamics, major players, consumer behavior, and socio-economic conditions. Structured into multiple sections, the report provides a comprehensive perspective on the market from all angles.
Key sections of the waterproof camera market report include market segments, outlook, competitive landscape, and company profiles. Market Segments offer in-depth details based on Type, Range, Application, and other relevant classifications to support strategic marketing initiatives. Market Outlook thoroughly analyzes market trends, growth drivers, restraints, opportunities, challenges, Porter’s Five Forces framework, macroeconomic factors, value chain analysis, and pricing trends shaping the market now and in the future. The Competitive Landscape and Company Profiles section highlights major players, their strategies, and market positioning to guide investment and business decisions. The report also identifies innovation trends, new business opportunities, and investment prospects for the forecast period.
Key Highlights:
- As per the analysis shared by our research analyst, the global waterproof camera market is estimated to grow annually at a CAGR of around 7.6% over the forecast period (2024-2032).
- In terms of revenue, the global waterproof camera market size was valued at around USD 1110.71 Million in 2023 and is projected to reach USD 2147.39 Million by 2032.
- The market is projected to grow at a significant rate due to rising demand for adventure and outdoor photography, growth in tourism and water sports, and advancements in rugged, durable camera technology.
- Based on the Type, the Normal segment is growing at a high rate and will continue to dominate the global market as per industry projections.
- On the basis of Range, the 10-30M segment is anticipated to command the largest market share.
- In terms of Application, the Security & Surveillance segment is projected to lead the global market.
- Based on region, Asia-Pacific is projected to dominate the global market during the forecast period.
Waterproof Camera Market: Report Scope
This report thoroughly analyzes the waterproof camera market, exploring its historical trends, current state, and future projections. The market estimates presented result from a robust research methodology, incorporating primary research, secondary sources, and expert opinions. These estimates are influenced by the prevailing market dynamics as well as key economic, social, and political factors. Furthermore, the report considers the impact of regulations, government expenditures, and advancements in research and development on the market. Both positive and negative shifts are evaluated to ensure a comprehensive and accurate market outlook.
| Report Attributes | Report Details |
|---|---|
| Report Name | Waterproof Camera Market |
| Market Size in 2023 | USD 1110.71 Million |
| Market Forecast in 2032 | USD 2147.39 Million |
| Growth Rate | CAGR of 7.6% |
| Number of Pages | 172 |
| Key Companies Covered | Fujufilm (Japan), Nikon (Japan), Go-Pro (U.S.), Canon (Japan), Kodak (U.S.), Honeywell International Inc. (U.S.), Panasonic Corporation (Japan), Robert Bosch Gmbh (Germany), FLIR Systems (U.S.), Olympus (Japan) |
| Segments Covered | By Type, By Range, By Application, and By Region |
| Regions Covered | North America, Europe, Asia Pacific (APAC), Latin America, Middle East, and Africa (MEA) |
| Base Year | 2023 |
| Historical Year | 2018 to 2023 |
| Forecast Year | 2024 to 2032 |
| Customization Scope | Avail customized purchase options to meet your exact research needs. Request For Customization |
Waterproof Camera Market: Dynamics
Gemini =>>>> Industry Dynamics <<<<=
Key Growth Drivers
The waterproof camera market is primarily driven by the increasing popularity of outdoor and water-based activities, such as snorkeling, surfing, and scuba diving. Consumers are seeking durable and high-quality cameras to capture their adventures, fueling demand for waterproof models. Technological advancements, such as improved image stabilization, 4K video recording, and enhanced low-light performance, are also attracting photography enthusiasts. Additionally, the rise of social media platforms encourages users to share visually appealing content, further boosting the adoption of waterproof cameras for capturing unique underwater and action shots.
Restraints
Despite its growth, the waterproof camera market faces restraints, including competition from waterproof smartphone cases and action cameras like GoPro, which offer similar functionalities at competitive prices. The high cost of premium waterproof cameras can also deter budget-conscious consumers. Furthermore, limited innovation in certain segments and the niche appeal of waterproof cameras compared to versatile smartphones may restrict market expansion. These factors collectively challenge the growth potential of dedicated waterproof cameras.
Opportunities
The waterproof camera market presents significant opportunities, particularly in emerging markets where disposable incomes are rising, and outdoor recreational activities are gaining traction. Manufacturers can capitalize on the growing trend of adventure tourism by developing affordable, feature-rich cameras tailored to travelers. Partnerships with travel agencies and influencers can also enhance brand visibility. Additionally, integrating AI-powered features, such as automatic scene recognition and advanced editing tools, could differentiate products and attract tech-savvy consumers.
Challenges
One of the key challenges in the waterproof camera market is the rapid evolution of smartphone cameras, which increasingly incorporate waterproofing and high-end imaging capabilities. This convergence reduces the need for standalone waterproof cameras. Another challenge is maintaining product durability and performance standards, as defects or failures in harsh environments can damage brand reputation. Lastly, environmental concerns related to electronic waste and the need for sustainable manufacturing practices may pressure companies to adopt eco-friendly solutions, adding complexity to production processes.
Waterproof Camera Market: Segmentation Insights
The global waterproof camera market is segmented based on Type, Range, Application, and Region. All the segments of the waterproof camera market have been analyzed based on present & future trends and the market is estimated from 2024 to 2032.
Based on Type, the global waterproof camera market is divided into Normal, Disposable.
On the basis of Range, the global waterproof camera market is bifurcated into 10-30M, 30-60M, 60-80M.
In terms of Application, the global waterproof camera market is categorized into Security & Surveillance, Media & Entertainment, Travel & Tourism.
Waterproof Camera Market: Regional Insights
The Asia-Pacific region dominates the global waterproof camera market, driven by strong demand in countries like Japan, China, and Australia. Japan, a key player, leads in technological innovation, with major brands like Olympus, Fujifilm, and Sony headquartered there. China's growing middle class and increasing interest in outdoor activities and water sports further boost market growth. Australia's thriving tourism industry, particularly in coastal and marine activities, also contributes significantly. According to recent market reports, Asia-Pacific held over 40% of the global waterproof camera market share in 2023, with projections indicating sustained growth due to rising disposable incomes and expanding adventure tourism. North America and Europe follow, but Asia-Pacific remains the dominant force due to higher production capabilities and consumer adoption.
Waterproof Camera Market: Competitive Landscape
The waterproof camera market report offers a thorough analysis of both established and emerging players within the market. It includes a detailed list of key companies, categorized based on the types of products they offer and other relevant factors. The report also highlights the market entry year for each player, providing further context for the research analysis.
The "Global Waterproof Camera Market" study offers valuable insights, focusing on the global market landscape, with an emphasis on major industry players such as;
- Fujufilm (Japan)
- Nikon (Japan)
- Go-Pro (U.S.)
- Canon (Japan)
- Kodak (U.S.)
- Honeywell International Inc. (U.S.)
- Panasonic Corporation (Japan)
- Robert Bosch Gmbh (Germany)
- FLIR Systems (U.S.)
- Olympus (Japan)
The Global Waterproof Camera Market is Segmented as Follows:
By Type
- Normal
- Disposable
By Range
- 10-30M
- 30-60M
- 60-80M
By Application
- Security & Surveillance
- Media & Entertainment
- Travel & Tourism
By Region
- North America
- The U.S.
- Canada
- Mexico
- Europe
- France
- The UK
- Spain
- Germany
- Italy
- Rest of Europe
- Asia Pacific
- China
- Japan
- India
- Australia
- South Korea
- Rest of Asia Pacific
- The Middle East & Africa
- Saudi Arabia
- UAE
- Egypt
- Kuwait
- South Africa
- Rest of the Middle East & Africa
- Latin America
- Brazil
- Argentina
- Rest of Latin America
Market Evolution
This section evaluates the market position of the product or service by examining its development pathway and competitive dynamics. It provides a detailed overview of the product's growth stages, including the early (historical) phase, the mid-stage, and anticipated future advancements influenced by innovation and emerging technologies.
Porter’s Analysis
Porter’s Five Forces framework offers a strategic lens for assessing competitor behavior and the positioning of key players in the waterproof camera industry. This section explores the external factors shaping competitive dynamics and influencing market strategies in the years ahead. The analysis focuses on five critical forces:
- Competitive Rivalry
- Threat of New Entrants
- Threat of Substitutes
- Supplier Bargaining Power
- Buyer Bargaining Power
Value Chain & Market Attractiveness Analysis
The value chain analysis helps businesses optimize operations by mapping the product flow from suppliers to end consumers, identifying opportunities to streamline processes and gain a competitive edge. Segment-wise market attractiveness analysis evaluates key dimensions like product categories, demographics, and regions, assessing growth potential, market size, and profitability. This enables businesses to focus resources on high-potential segments for better ROI and long-term value.
PESTEL Analysis
PESTEL analysis is a powerful tool in market research reports that enhances market understanding by systematically examining the external macro-environmental factors influencing a business or industry. The acronym stands for Political, Economic, Social, Technological, Environmental, and Legal factors. By evaluating these dimensions, PESTEL analysis provides a comprehensive overview of the broader context within which a market operates, helping businesses identify potential opportunities and threats.
- Political factors assess government policies, stability, trade regulations, and political risks that could impact market operations.
- Economic factors examine variables like inflation, exchange rates, economic growth, and consumer spending power to determine market viability.
- Social factors explore cultural trends, demographics, and lifestyle changes that shape consumer behavior and preferences.
- Technological factors evaluate innovation, R&D, and technological advancements affecting product development and operational efficiencies.
- Environmental factors focus on sustainability, climate change impacts, and eco-friendly practices shaping market trends.
- Legal factors address compliance requirements, industry regulations, and intellectual property laws impacting market entry and operations.
Import-export Analysis & Pricing Analysis
An import-export analysis is vital for market research, revealing global trade dynamics, trends, and opportunities. It examines trade volumes, product categories, and regional competitiveness, offering insights into supply chains and market demand. This section also analyzes past and future pricing trends, helping businesses optimize strategies and enabling consumers to assess product value effectively.
Waterproof Camera Market: Company Profiles
The report identifies key players in the waterproof camera market through a competitive landscape and company profiles, evaluating their offerings, financial performance, strategies, and market positioning. It includes a SWOT analysis of the top 3-5 companies, assessing strengths, weaknesses, opportunities, and threats. The competitive landscape highlights rankings, recent activities (mergers, acquisitions, partnerships, product launches), and regional footprints using the Ace matrix. Customization is available to meet client-specific needs.
Regional & Industry Footprint
This section details the geographic reach, sales networks, and market penetration of companies profiled in the waterproof camera report, showcasing their operations and distribution across regions. It analyzes the alignment of companies with specific industry verticals, highlighting the industries they serve and the scope of their products and services within those sectors.
Ace Matrix
This section categorizes companies into four distinct groups—Active, Cutting Edge, Innovator, and Emerging—based on their product and business strategies. The evaluation of product strategy focuses on aspects such as the range and depth of offerings, commitment to innovation, product functionalities, and scalability. Key elements like global reach, sector coverage, strategic acquisitions, and long-term growth plans are considered for business strategy. This analysis provides a detailed view of companies' position within the market and highlights their potential for future growth and development.
Research Methodology
The qualitative and quantitative insights for the waterproof camera market are derived through a multi-faceted research approach, combining input from subject matter experts, primary research, and secondary data sources. Primary research includes gathering critical information via face-to-face or telephonic interviews, surveys, questionnaires, and feedback from industry professionals, key opinion leaders (KOLs), and customers. Regular interviews with industry experts are conducted to deepen the analysis and reinforce the existing data, ensuring a robust and well-rounded market understanding.
Secondary research for this report was carried out by the Market Research Store team, drawing on a variety of authoritative sources, such as:
- Official company websites, annual reports, financial statements, investor presentations, and SEC filings
- Internal and external proprietary databases, as well as relevant patent and regulatory databases
- Government publications, national statistical databases, and industry-specific market reports
- Media coverage, including news articles, press releases, and webcasts about market participants
- Paid industry databases for detailed market insights
Market Research Store conducted in-depth consultations with various key opinion leaders in the industry, including senior executives from top companies and regional leaders from end-user organizations. This effort aimed to gather critical insights on factors such as the market share of dominant brands in specific countries and regions, along with pricing strategies for products and services.
To determine total sales data, the research team conducted primary interviews across multiple countries with influential stakeholders, including:
- Distributors
- Marketing, Brand, and Product Managers
- Procurement and Production Managers
- Sales and Regional Sales Managers, Country Managers
- Technical Specialists
- C-Level Executives
These subject matter experts, with their extensive industry experience, helped validate and refine the findings. For secondary research, data was sourced from a wide range of materials, including online resources, company annual reports, industry publications, research papers, association reports, and government websites. These various sources provide a comprehensive and well-rounded perspective on the market.
Frequently Asked Questions
Table Of Content
List of Tables and Figures Figure Product Picture of Waterproof Camera Table Product Specification of Waterproof Camera Figure Market Concentration Ratio and Market Maturity Analysis of Waterproof Camera Figure Global Waterproof Camera Value ($) and Growth Rate from 2014-2024 Table Different Types of Waterproof Camera Figure Global Waterproof Camera Value ($) Segment by Type from 2014-2019 Figure Common Camera Picture Figure Disposable Camera Picture Table Different Applications of Waterproof Camera Figure Global Waterproof Camera Value ($) Segment by Applications from 2014-2019 Figure Professional Picture Figure Amateur Picture Table Research Regions of Waterproof Camera Figure North America Waterproof Camera Production Value ($) and Growth Rate (2014-2019) Figure Europe Waterproof Camera Production Value ($) and Growth Rate (2014-2019) Table China Waterproof Camera Production Value ($) and Growth Rate (2014-2019) Table Japan Waterproof Camera Production Value ($) and Growth Rate (2014-2019) Table Middle East & Africa Waterproof Camera Production Value ($) and Growth Rate (2014-2019) Table India Waterproof Camera Production Value ($) and Growth Rate (2014-2019) Table South America Waterproof Camera Production Value ($) and Growth Rate (2014-2019) Table Emerging Countries of Waterproof Camera Table Growing Market of Waterproof Camera Figure Industry Chain Analysis of Waterproof Camera Table Upstream Raw Material Suppliers of Waterproof Camera with Contact Information Table Major Players Manufacturing Base and Market Share ($) of Waterproof Camera in 2018 Table Major Players Waterproof Camera Product Types in 2018 Figure Production Process of Waterproof Camera Figure Manufacturing Cost Structure of Waterproof Camera Figure Channel Status of Waterproof Camera Table Major Distributors of Waterproof Camera with Contact Information Table Major Downstream Buyers of Waterproof Camera with Contact Information Table Global Waterproof Camera Value ($) by Type (2014-2019) Table Global Waterproof Camera Value ($) Share by Type (2014-2019) Figure Global Waterproof Camera Value ($) Share by Type (2014-2019) Table Global Waterproof Camera Production by Type (2014-2019) Table Global Waterproof Camera Production Share by Type (2014-2019) Figure Global Waterproof Camera Production Share by Type (2014-2019) Figure Global Waterproof Camera Value ($) and Growth Rate of Common Camera Figure Global Waterproof Camera Value ($) and Growth Rate of Disposable Camera Figure Global Waterproof Camera Price by Type (2014-2019) Table Global Waterproof Camera Consumption by Application (2014-2019) Table Global Waterproof Camera Consumption Market Share by Application (2014-2019) Figure Global Waterproof Camera Consumption Market Share by Application (2014-2019) Table Downstream Buyers Introduction by Application Figure Global Waterproof Camera Consumption and Growth Rate of Professional (2014-2019) Figure Global Waterproof Camera Consumption and Growth Rate of Amateur (2014-2019) Table Global Waterproof Camera Value ($) by Region (2014-2019) Table Global Waterproof Camera Value ($) Market Share by Region (2014-2019) Figure Global Waterproof Camera Value ($) Market Share by Region (2014-2019) Table Global Waterproof Camera Production by Region (2014-2019) Table Global Waterproof Camera Production Market Share by Region (2014-2019) Figure Global Waterproof Camera Production Market Share by Region (2014-2019) Table Global Waterproof Camera Production, Value ($), Price and Gross Margin (2014-2019) Table North America Waterproof Camera Production, Value ($), Price and Gross Margin (2014-2019) Table Europe Waterproof Camera Production, Value ($), Price and Gross Margin (2014-2019) Table China Waterproof Camera Production, Value ($), Price and Gross Margin (2014-2019) Table Japan Waterproof Camera Production, Value ($), Price and Gross Margin (2014-2019) Table Middle East & Africa Waterproof Camera Production, Value ($), Price and Gross Margin (2014-2019) Table India Waterproof Camera Production, Value ($), Price and Gross Margin (2014-2019) Table South America Waterproof Camera Production, Value ($), Price and Gross Margin (2014-2019) Table Global Waterproof Camera Consumption by Regions (2014-2019) Figure Global Waterproof Camera Consumption Share by Regions (2014-2019) Table North America Waterproof Camera Production, Consumption, Export, Import (2014-2019) Table Europe Waterproof Camera Production, Consumption, Export, Import (2014-2019) Table China Waterproof Camera Production, Consumption, Export, Import (2014-2019) Table Japan Waterproof Camera Production, Consumption, Export, Import (2014-2019) Table Middle East & Africa Waterproof Camera Production, Consumption, Export, Import (2014-2019) Table India Waterproof Camera Production, Consumption, Export, Import (2014-2019) Table South America Waterproof Camera Production, Consumption, Export, Import (2014-2019) Figure North America Waterproof Camera Production and Growth Rate Analysis Figure North America Waterproof Camera Consumption and Growth Rate Analysis Figure North America Waterproof Camera SWOT Analysis Figure Europe Waterproof Camera Production and Growth Rate Analysis Figure Europe Waterproof Camera Consumption and Growth Rate Analysis Figure Europe Waterproof Camera SWOT Analysis Figure China Waterproof Camera Production and Growth Rate Analysis Figure China Waterproof Camera Consumption and Growth Rate Analysis Figure China Waterproof Camera SWOT Analysis Figure Japan Waterproof Camera Production and Growth Rate Analysis Figure Japan Waterproof Camera Consumption and Growth Rate Analysis Figure Japan Waterproof Camera SWOT Analysis Figure Middle East & Africa Waterproof Camera Production and Growth Rate Analysis Figure Middle East & Africa Waterproof Camera Consumption and Growth Rate Analysis Figure Middle East & Africa Waterproof Camera SWOT Analysis Figure India Waterproof Camera Production and Growth Rate Analysis Figure India Waterproof Camera Consumption and Growth Rate Analysis Figure India Waterproof Camera SWOT Analysis Figure South America Waterproof Camera Production and Growth Rate Analysis Figure South America Waterproof Camera Consumption and Growth Rate Analysis Figure South America Waterproof Camera SWOT Analysis Figure Top 3 Market Share of Waterproof Camera Companies Figure Top 6 Market Share of Waterproof Camera Companies Table Mergers, Acquisitions and Expansion Analysis Table Company Profiles Table Product Introduction Table Nikon Production, Value ($), Price, Gross Margin 2014-2019 Figure Nikon Production and Growth Rate Figure Nikon Value ($) Market Share 2014-2019 Figure Nikon Market Share of Waterproof Camera Segmented by Region in 2018 Table Company Profiles Table Product Introduction Table Polaroid Production, Value ($), Price, Gross Margin 2014-2019 Figure Polaroid Production and Growth Rate Figure Polaroid Value ($) Market Share 2014-2019 Figure Polaroid Market Share of Waterproof Camera Segmented by Region in 2018 Table Company Profiles Table Product Introduction Table SeaLife Production, Value ($), Price, Gross Margin 2014-2019 Figure SeaLife Production and Growth Rate Figure SeaLife Value ($) Market Share 2014-2019 Figure SeaLife Market Share of Waterproof Camera Segmented by Region in 2018 Table Company Profiles Table Product Introduction Table Bell+Howell Production, Value ($), Price, Gross Margin 2014-2019 Figure Bell+Howell Production and Growth Rate Figure Bell+Howell Value ($) Market Share 2014-2019 Figure Bell+Howell Market Share of Waterproof Camera Segmented by Region in 2018 Table Company Profiles Table Product Introduction Table Canon Production, Value ($), Price, Gross Margin 2014-2019 Figure Canon Production and Growth Rate Figure Canon Value ($) Market Share 2014-2019 Figure Canon Market Share of Waterproof Camera Segmented by Region in 2018 Table Company Profiles Table Product Introduction Table Ricoh Production, Value ($), Price, Gross Margin 2014-2019 Figure Ricoh Production and Growth Rate Figure Ricoh Value ($) Market Share 2014-2019 Figure Ricoh Market Share of Waterproof Camera Segmented by Region in 2018 Table Company Profiles Table Product Introduction Table Pentax Production, Value ($), Price, Gross Margin 2014-2019 Figure Pentax Production and Growth Rate Figure Pentax Value ($) Market Share 2014-2019 Figure Pentax Market Share of Waterproof Camera Segmented by Region in 2018 Table Company Profiles Table Product Introduction Table Fujifilm Production, Value ($), Price, Gross Margin 2014-2019 Figure Fujifilm Production and Growth Rate Figure Fujifilm Value ($) Market Share 2014-2019 Figure Fujifilm Market Share of Waterproof Camera Segmented by Region in 2018 Table Company Profiles Table Product Introduction Table Olympus Production, Value ($), Price, Gross Margin 2014-2019 Figure Olympus Production and Growth Rate Figure Olympus Value ($) Market Share 2014-2019 Figure Olympus Market Share of Waterproof Camera Segmented by Region in 2018 Table Company Profiles Table Product Introduction Table Panasonic Production, Value ($), Price, Gross Margin 2014-2019 Figure Panasonic Production and Growth Rate Figure Panasonic Value ($) Market Share 2014-2019 Figure Panasonic Market Share of Waterproof Camera Segmented by Region in 2018 Table Company Profiles Table Product Introduction Table Sony Production, Value ($), Price, Gross Margin 2014-2019 Figure Sony Production and Growth Rate Figure Sony Value ($) Market Share 2014-2019 Figure Sony Market Share of Waterproof Camera Segmented by Region in 2018 Table Company Profiles Table Product Introduction Table Coleman Production, Value ($), Price, Gross Margin 2014-2019 Figure Coleman Production and Growth Rate Figure Coleman Value ($) Market Share 2014-2019 Figure Coleman Market Share of Waterproof Camera Segmented by Region in 2018 Table Company Profiles Table Product Introduction Table Vivitar Production, Value ($), Price, Gross Margin 2014-2019 Figure Vivitar Production and Growth Rate Figure Vivitar Value ($) Market Share 2014-2019 Figure Vivitar Market Share of Waterproof Camera Segmented by Region in 2018 Table Company Profiles Table Product Introduction Table Kodak Production, Value ($), Price, Gross Margin 2014-2019 Figure Kodak Production and Growth Rate Figure Kodak Value ($) Market Share 2014-2019 Figure Kodak Market Share of Waterproof Camera Segmented by Region in 2018 Table Global Waterproof Camera Market Value ($) Forecast, by Type Table Global Waterproof Camera Market Volume Forecast, by Type Figure Global Waterproof Camera Market Value ($) and Growth Rate Forecast of Common Camera (2019-2024) Figure Global Waterproof Camera Market Volume and Growth Rate Forecast of Common Camera (2019-2024) Figure Global Waterproof Camera Market Value ($) and Growth Rate Forecast of Disposable Camera (2019-2024) Figure Global Waterproof Camera Market Volume and Growth Rate Forecast of Disposable Camera (2019-2024) Table Global Market Value ($) Forecast by Application (2019-2024) Table Global Market Volume Forecast by Application (2019-2024) Figure Global Waterproof Camera Consumption and Growth Rate of Professional (2014-2019) Figure Global Waterproof Camera Consumption and Growth Rate of Amateur (2014-2019) Figure Market Value ($) and Growth Rate Forecast of Amateur (2019-2024) Figure Market Volume and Growth Rate Forecast of Amateur (2019-2024) Figure North America Market Value ($) and Growth Rate Forecast (2019-2024) Table North America Consumption and Growth Rate Forecast (2019-2024) Figure Europe Market Value ($) and Growth Rate Forecast (2019-2024) Table Europe Consumption and Growth Rate Forecast (2019-2024) Figure China Market Value ($) and Growth Rate Forecast (2019-2024) Table China Consumption and Growth Rate Forecast (2019-2024) Figure Japan Market Value ($) and Growth Rate Forecast (2019-2024) Table Japan Consumption and Growth Rate Forecast (2019-2024) Figure Middle East & Africa Market Value ($) and Growth Rate Forecast (2019-2024) Table Middle East & Africa Consumption and Growth Rate Forecast (2019-2024) Figure India Market Value ($) and Growth Rate Forecast (2019-2024) Table India Consumption and Growth Rate Forecast (2019-2024) Figure South America Market Value ($) and Growth Rate Forecast (2019-2024) Table South America Consumption and Growth Rate Forecast (2019-2024) Figure Industry Resource/Technology/Labor Importance Analysis Table New Entrants SWOT Analysis Table New Project Analysis of Investment Recovery
Inquiry For Buying
Waterproof Camera
Request Sample
Waterproof Camera