Wireless Smart Lighting Controls Market Size, Share, and Trends Analysis Report
CAGR :

| Market Size 2023 (Base Year) | USD 16.89 Billion |
| Market Size 2032 (Forecast Year) | USD 115.84 Billion |
| CAGR | 21.2% |
| Forecast Period | 2024 - 2032 |
| Historical Period | 2018 - 2023 |
Wireless Smart Lighting Controls Market Insights
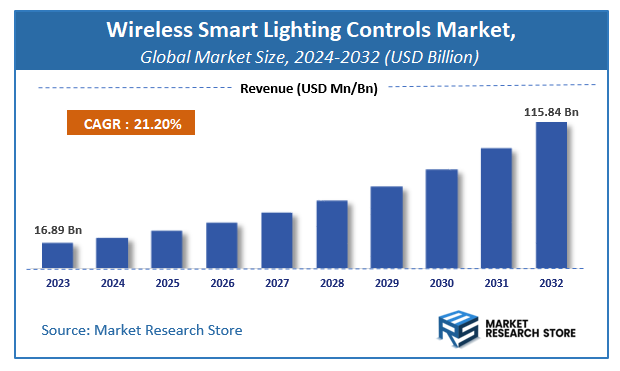
A latest report by Market Research Store estimates that the Global Wireless Smart Lighting Controls Market was valued at USD 16.89 Billion in 2023 and is expected to reach USD 115.84 Billion by 2032, with a CAGR of 21.2% during the forecast period 2024-2032. The report Wireless Smart Lighting Controls Market overview, growth factors, restraints, opportunities, segmentation, key developments, competitive landscape, consumer insights, and market growth forecast in terms of value or volume. These structured details offer an all-inclusive market overview, providing valuable insights for investment decisions, business decisions, strategic planning, and competitive analysis.
Wireless Smart Lighting Controls Market: Overview
The growth of the wireless smart lighting controls market is fueled by rising global demand across various industries and applications. The report highlights lucrative opportunities, analyzing cost structures, key segments, emerging trends, regional dynamics, and advancements by leading players to provide comprehensive market insights. The wireless smart lighting controls market report offers a detailed industry analysis from 2024 to 2032, combining quantitative and qualitative insights. It examines key factors such as pricing, market penetration, GDP impact, industry dynamics, major players, consumer behavior, and socio-economic conditions. Structured into multiple sections, the report provides a comprehensive perspective on the market from all angles.
Key sections of the wireless smart lighting controls market report include market segments, outlook, competitive landscape, and company profiles. Market Segments offer in-depth details based on Type, Application, and other relevant classifications to support strategic marketing initiatives. Market Outlook thoroughly analyzes market trends, growth drivers, restraints, opportunities, challenges, Porter’s Five Forces framework, macroeconomic factors, value chain analysis, and pricing trends shaping the market now and in the future. The Competitive Landscape and Company Profiles section highlights major players, their strategies, and market positioning to guide investment and business decisions. The report also identifies innovation trends, new business opportunities, and investment prospects for the forecast period.
Key Highlights:
- As per the analysis shared by our research analyst, the global wireless smart lighting controls market is estimated to grow annually at a CAGR of around 21.2% over the forecast period (2024-2032).
- In terms of revenue, the global wireless smart lighting controls market size was valued at around USD 16.89 Billion in 2023 and is projected to reach USD 115.84 Billion by 2032.
- The market is projected to grow at a significant rate due to increasing demand for energy-efficient lighting solutions and iot-based automation.
- Based on the Type, the Zigbee segment is growing at a high rate and will continue to dominate the global market as per industry projections.
- On the basis of Application, the Outdoor segment is anticipated to command the largest market share.
- Based on region, North America is projected to dominate the global market during the forecast period.
Wireless Smart Lighting Controls Market: Report Scope
This report thoroughly analyzes the wireless smart lighting controls market, exploring its historical trends, current state, and future projections. The market estimates presented result from a robust research methodology, incorporating primary research, secondary sources, and expert opinions. These estimates are influenced by the prevailing market dynamics as well as key economic, social, and political factors. Furthermore, the report considers the impact of regulations, government expenditures, and advancements in research and development on the market. Both positive and negative shifts are evaluated to ensure a comprehensive and accurate market outlook.
| Report Attributes | Report Details |
|---|---|
| Report Name | Wireless Smart Lighting Controls Market |
| Market Size in 2023 | USD 16.89 Billion |
| Market Forecast in 2032 | USD 115.84 Billion |
| Growth Rate | CAGR of 21.2% |
| Number of Pages | 178 |
| Key Companies Covered | Murata, Zengge, Control4, Telematics, Legrand, Schneider Electric, Venture Lighting, Honeywell, PHILIPS, Lutron, Petra Systems, DimOnOff, Osram, Huagong Lighting, TVILIGHT, GELighting, Echelon, Cimcon |
| Segments Covered | By Type, By Application, and By Region |
| Regions Covered | North America, Europe, Asia Pacific (APAC), Latin America, Middle East, and Africa (MEA) |
| Base Year | 2023 |
| Historical Year | 2018 to 2023 |
| Forecast Year | 2024 to 2032 |
| Customization Scope | Avail customized purchase options to meet your exact research needs. Request For Customization |
Wireless Smart Lighting Controls Market: Dynamics
Key Growth Drivers
The Wireless Smart Lighting Controls market in Pune, Maharashtra, India, is experiencing significant growth driven by the increasing adoption of smart home technologies and the growing consumer demand for convenience, energy efficiency, and enhanced 1 control over their lighting systems. The rising awareness about energy conservation and the potential for significant cost savings through automated lighting schedules and dimming capabilities are key drivers. Furthermore, the proliferation of affordable and user-friendly wireless communication protocols like Wi-Fi, Bluetooth, and Zigbee has made smart lighting controls more accessible. The increasing integration of smart lighting with voice assistants and other smart home ecosystems enhances user convenience and adoption. The growing trend of home automation and the desire for personalized lighting experiences further fuels market expansion in Pune's tech-savvy urban environment.
Restraints
Despite the strong growth drivers, the Wireless Smart Lighting Controls market in Pune and India faces certain restraints. The higher initial cost of smart lighting systems compared to traditional lighting solutions can be a barrier for budget-conscious consumers. Concerns about the complexity of installation and setup, as well as potential compatibility issues with existing electrical infrastructure, can deter some potential buyers. Furthermore, the reliance on wireless connectivity can lead to concerns about network stability, security vulnerabilities, and potential interference. The need for a stable internet connection for remote control and advanced features can be a limitation in areas with unreliable internet access. A lack of widespread awareness about the full benefits and functionalities of smart lighting controls among the general population can also slow down adoption.
Opportunities
The Wireless Smart Lighting Controls market in Pune and India presents numerous opportunities for innovation and expansion. The increasing focus on energy efficiency and sustainability in buildings will continue to drive demand for smart lighting solutions. The development of more affordable and user-friendly smart lighting systems with simplified installation processes can broaden market accessibility. Furthermore, the integration of advanced features such as occupancy sensing, daylight harvesting, and circadian rhythm lighting can enhance energy savings and user well-being. The growing trend of smart cities and infrastructure development in Pune and other urban centers will create demand for intelligent lighting solutions for public spaces. The potential for offering value-added services such as professional installation, customization, and energy management consulting can strengthen customer relationships.
Challenges
The Wireless Smart Lighting Controls market in Pune and India faces challenges related to educating consumers about the long-term cost savings and benefits of smart lighting that outweigh the initial investment. Ensuring the reliability and security of wireless communication protocols and preventing unauthorized access to lighting systems is crucial. Achieving seamless interoperability between different brands and smart home platforms remains a challenge. Furthermore, providing effective after-sales service and technical support for these technologically advanced systems is essential for customer satisfaction. Addressing the diverse electrical wiring standards and installation practices across India requires adaptable product designs. Finally, competing with the deeply entrenched use of traditional lighting solutions requires effective marketing and highlighting the added value and convenience of smart lighting.
Wireless Smart Lighting Controls Market: Segmentation Insights
The global wireless smart lighting controls market is segmented based on Type, Application, and Region. All the segments of the wireless smart lighting controls market have been analyzed based on present & future trends and the market is estimated from 2024 to 2032.
Based on Type, the global wireless smart lighting controls market is divided into Zigbee, Wifi, Bluetooth, Z-Wave, Enocean.
On the basis of Application, the global wireless smart lighting controls market is bifurcated into Outdoor, Residential, Commercial, Industrial.
Wireless Smart Lighting Controls Market: Regional Insights
The North American region dominates the global wireless smart lighting controls market, accounting for the largest revenue share due to high adoption of IoT-based smart home technologies, stringent energy efficiency regulations, and significant investments in smart city infrastructure. According to recent market analysis (2023–2024), North America held over 38% of the global market, with the U.S. as the primary contributor, driven by demand for energy-efficient lighting in commercial buildings and residential smart homes. Europe follows closely, led by Germany, the UK, and France, where government mandates on energy conservation and green building initiatives propel growth.
Meanwhile, the Asia-Pacific (APAC) region is projected to register the highest CAGR of 15–18% (2024–2030), fueled by rapid urbanization, smart city projects in China and India, and increasing disposable incomes. However, North America is expected to maintain its dominance, supported by technological advancements, strong presence of key players like Lutron, Signify (Philips Hue), and Acuity Brands, and rising demand for connected lighting systems in industrial and commercial sectors. The integration of AI and voice-controlled smart lighting further solidifies the region's leadership position.
Wireless Smart Lighting Controls Market: Competitive Landscape
The wireless smart lighting controls market report offers a thorough analysis of both established and emerging players within the market. It includes a detailed list of key companies, categorized based on the types of products they offer and other relevant factors. The report also highlights the market entry year for each player, providing further context for the research analysis.
The "Global Wireless Smart Lighting Controls Market" study offers valuable insights, focusing on the global market landscape, with an emphasis on major industry players such as;
- Murata
- Zengge
- Control4
- Telematics
- Legrand
- Schneider Electric
- Venture Lighting
- Honeywell
- PHILIPS
- Lutron
- Petra Systems
- DimOnOff
- Osram
- Huagong Lighting
- TVILIGHT
- GELighting
- Echelon
- Cimcon
The Global Wireless Smart Lighting Controls Market is Segmented as Follows:
By Type
- Zigbee
- Wifi
- Bluetooth
- Z-Wave
- Enocean
By Application
- Outdoor
- Residential
- Commercial
- Industrial
By Region
- North America
- The U.S.
- Canada
- Mexico
- Europe
- France
- The UK
- Spain
- Germany
- Italy
- Rest of Europe
- Asia Pacific
- China
- Japan
- India
- Australia
- South Korea
- Rest of Asia Pacific
- The Middle East & Africa
- Saudi Arabia
- UAE
- Egypt
- Kuwait
- South Africa
- Rest of the Middle East & Africa
- Latin America
- Brazil
- Argentina
- Rest of Latin America
Market Evolution
This section evaluates the market position of the product or service by examining its development pathway and competitive dynamics. It provides a detailed overview of the product's growth stages, including the early (historical) phase, the mid-stage, and anticipated future advancements influenced by innovation and emerging technologies.
Porter’s Analysis
Porter’s Five Forces framework offers a strategic lens for assessing competitor behavior and the positioning of key players in the wireless smart lighting controls industry. This section explores the external factors shaping competitive dynamics and influencing market strategies in the years ahead. The analysis focuses on five critical forces:
- Competitive Rivalry
- Threat of New Entrants
- Threat of Substitutes
- Supplier Bargaining Power
- Buyer Bargaining Power
Value Chain & Market Attractiveness Analysis
The value chain analysis helps businesses optimize operations by mapping the product flow from suppliers to end consumers, identifying opportunities to streamline processes and gain a competitive edge. Segment-wise market attractiveness analysis evaluates key dimensions like product categories, demographics, and regions, assessing growth potential, market size, and profitability. This enables businesses to focus resources on high-potential segments for better ROI and long-term value.
PESTEL Analysis
PESTEL analysis is a powerful tool in market research reports that enhances market understanding by systematically examining the external macro-environmental factors influencing a business or industry. The acronym stands for Political, Economic, Social, Technological, Environmental, and Legal factors. By evaluating these dimensions, PESTEL analysis provides a comprehensive overview of the broader context within which a market operates, helping businesses identify potential opportunities and threats.
- Political factors assess government policies, stability, trade regulations, and political risks that could impact market operations.
- Economic factors examine variables like inflation, exchange rates, economic growth, and consumer spending power to determine market viability.
- Social factors explore cultural trends, demographics, and lifestyle changes that shape consumer behavior and preferences.
- Technological factors evaluate innovation, R&D, and technological advancements affecting product development and operational efficiencies.
- Environmental factors focus on sustainability, climate change impacts, and eco-friendly practices shaping market trends.
- Legal factors address compliance requirements, industry regulations, and intellectual property laws impacting market entry and operations.
Import-Export Analysis & Pricing Analysis
An import-export analysis is vital for market research, revealing global trade dynamics, trends, and opportunities. It examines trade volumes, product categories, and regional competitiveness, offering insights into supply chains and market demand. This section also analyzes past and future pricing trends, helping businesses optimize strategies and enabling consumers to assess product value effectively.
Wireless Smart Lighting Controls Market: Company Profiles
The report identifies key players in the wireless smart lighting controls market through competitive landscape and company profiles, evaluating their offerings, financial performance, strategies, and market positioning. It includes a SWOT analysis of the top 3-5 companies, assessing strengths, weaknesses, opportunities, and threats. The competitive landscape highlights rankings, recent activities (mergers, acquisitions, partnerships, product launches), and regional footprints using the Ace matrix. Customization is available to meet client-specific needs.
Regional & Industry Footprint
This section details the geographic reach, sales networks, and market penetration of companies profiled in the wireless smart lighting controls report, showcasing their operations and distribution across regions. It analyzes the alignment of companies with specific industry verticals, highlighting the industries they serve and the scope of their products and services within those sectors.
Ace Matrix
This section categorizes companies into four distinct groups—Active, Cutting Edge, Innovator, and Emerging—based on their product and business strategies. The evaluation of product strategy focuses on aspects such as the range and depth of offerings, commitment to innovation, product functionalities, and scalability. Key elements like global reach, sector coverage, strategic acquisitions, and long-term growth plans are considered for business strategy. This analysis provides a detailed view of companies' position within the market and highlights their potential for future growth and development.
Research Methodology
The qualitative and quantitative insights for the wireless smart lighting controls market are derived through a multi-faceted research approach, combining input from subject matter experts, primary research, and secondary data sources. Primary research includes gathering critical information via face-to-face or telephonic interviews, surveys, questionnaires, and feedback from industry professionals, key opinion leaders (KOLs), and customers. Regular interviews with industry experts are conducted to deepen the analysis and reinforce the existing data, ensuring a robust and well-rounded market understanding.
Secondary research for this report was carried out by the Market Research Store team, drawing on a variety of authoritative sources, such as:
- Official company websites, annual reports, financial statements, investor presentations, and SEC filings
- Internal and external proprietary databases, as well as relevant patent and regulatory databases
- Government publications, national statistical databases, and industry-specific market reports
- Media coverage, including news articles, press releases, and webcasts about market participants
- Paid industry databases for detailed market insights
Market Research Store conducted in-depth consultations with various key opinion leaders in the industry, including senior executives from top companies and regional leaders from end-user organizations. This effort aimed to gather critical insights on factors such as the market share of dominant brands in specific countries and regions, along with pricing strategies for products and services.
To determine total sales data, the research team conducted primary interviews across multiple countries with influential stakeholders, including:
- Distributors
- Marketing, Brand, and Product Managers
- Procurement and Production Managers
- Sales and Regional Sales Managers, Country Managers
- Technical Specialists
- C-Level Executives
These subject matter experts, with their extensive industry experience, helped validate and refine the findings. For secondary research, data was sourced from a wide range of materials, including online resources, company annual reports, industry publications, research papers, association reports, and government websites. These various sources provide a comprehensive and well-rounded perspective on the market.
Frequently Asked Questions
Table Of Content
List of Tables and Figures Figure Product Picture of Wireless Smart Lighting Controls Table Product Specification of Wireless Smart Lighting Controls Figure Market Concentration Ratio and Market Maturity Analysis of Wireless Smart Lighting Controls Figure Global Wireless Smart Lighting Controls Value ($) and Growth Rate from 2014-2024 Table Different Types of Wireless Smart Lighting Controls Figure Global Wireless Smart Lighting Controls Value ($) Segment by Type from 2014-2019 Figure Zigbee Picture Figure Wifi Picture Figure Bluetooth Picture Figure Z-Wave Picture Figure Enocean Picture Table Different Applications of Wireless Smart Lighting Controls Figure Global Wireless Smart Lighting Controls Value ($) Segment by Applications from 2014-2019 Figure Outdoor Picture Figure Residential Picture Figure Commercial Picture Figure Industrial Picture Table Research Regions of Wireless Smart Lighting Controls Figure North America Wireless Smart Lighting Controls Production Value ($) and Growth Rate (2014-2019) Figure Europe Wireless Smart Lighting Controls Production Value ($) and Growth Rate (2014-2019) Table China Wireless Smart Lighting Controls Production Value ($) and Growth Rate (2014-2019) Table Japan Wireless Smart Lighting Controls Production Value ($) and Growth Rate (2014-2019) Table Middle East & Africa Wireless Smart Lighting Controls Production Value ($) and Growth Rate (2014-2019) Table India Wireless Smart Lighting Controls Production Value ($) and Growth Rate (2014-2019) Table South America Wireless Smart Lighting Controls Production Value ($) and Growth Rate (2014-2019) Table Emerging Countries of Wireless Smart Lighting Controls Table Growing Market of Wireless Smart Lighting Controls Figure Industry Chain Analysis of Wireless Smart Lighting Controls Table Upstream Raw Material Suppliers of Wireless Smart Lighting Controls with Contact Information Table Major Players Manufacturing Base and Market Share ($) of Wireless Smart Lighting Controls in 2018 Table Major Players Wireless Smart Lighting Controls Product Types in 2018 Figure Production Process of Wireless Smart Lighting Controls Figure Manufacturing Cost Structure of Wireless Smart Lighting Controls Figure Channel Status of Wireless Smart Lighting Controls Table Major Distributors of Wireless Smart Lighting Controls with Contact Information Table Major Downstream Buyers of Wireless Smart Lighting Controls with Contact Information Table Global Wireless Smart Lighting Controls Value ($) by Type (2014-2019) Table Global Wireless Smart Lighting Controls Value ($) Share by Type (2014-2019) Figure Global Wireless Smart Lighting Controls Value ($) Share by Type (2014-2019) Table Global Wireless Smart Lighting Controls Production by Type (2014-2019) Table Global Wireless Smart Lighting Controls Production Share by Type (2014-2019) Figure Global Wireless Smart Lighting Controls Production Share by Type (2014-2019) Figure Global Wireless Smart Lighting Controls Value ($) and Growth Rate of Zigbee Figure Global Wireless Smart Lighting Controls Value ($) and Growth Rate of Wifi Figure Global Wireless Smart Lighting Controls Value ($) and Growth Rate of Bluetooth Figure Global Wireless Smart Lighting Controls Value ($) and Growth Rate of Z-Wave Figure Global Wireless Smart Lighting Controls Value ($) and Growth Rate of Enocean Figure Global Wireless Smart Lighting Controls Price by Type (2014-2019) Table Global Wireless Smart Lighting Controls Consumption by Application (2014-2019) Table Global Wireless Smart Lighting Controls Consumption Market Share by Application (2014-2019) Figure Global Wireless Smart Lighting Controls Consumption Market Share by Application (2014-2019) Table Downstream Buyers Introduction by Application Figure Global Wireless Smart Lighting Controls Consumption and Growth Rate of Outdoor (2014-2019) Figure Global Wireless Smart Lighting Controls Consumption and Growth Rate of Residential (2014-2019) Figure Global Wireless Smart Lighting Controls Consumption and Growth Rate of Commercial (2014-2019) Figure Global Wireless Smart Lighting Controls Consumption and Growth Rate of Industrial (2014-2019) Table Global Wireless Smart Lighting Controls Value ($) by Region (2014-2019) Table Global Wireless Smart Lighting Controls Value ($) Market Share by Region (2014-2019) Figure Global Wireless Smart Lighting Controls Value ($) Market Share by Region (2014-2019) Table Global Wireless Smart Lighting Controls Production by Region (2014-2019) Table Global Wireless Smart Lighting Controls Production Market Share by Region (2014-2019) Figure Global Wireless Smart Lighting Controls Production Market Share by Region (2014-2019) Table Global Wireless Smart Lighting Controls Production, Value ($), Price and Gross Margin (2014-2019) Table North America Wireless Smart Lighting Controls Production, Value ($), Price and Gross Margin (2014-2019) Table Europe Wireless Smart Lighting Controls Production, Value ($), Price and Gross Margin (2014-2019) Table China Wireless Smart Lighting Controls Production, Value ($), Price and Gross Margin (2014-2019) Table Japan Wireless Smart Lighting Controls Production, Value ($), Price and Gross Margin (2014-2019) Table Middle East & Africa Wireless Smart Lighting Controls Production, Value ($), Price and Gross Margin (2014-2019) Table India Wireless Smart Lighting Controls Production, Value ($), Price and Gross Margin (2014-2019) Table South America Wireless Smart Lighting Controls Production, Value ($), Price and Gross Margin (2014-2019) Table Global Wireless Smart Lighting Controls Consumption by Regions (2014-2019) Figure Global Wireless Smart Lighting Controls Consumption Share by Regions (2014-2019) Table North America Wireless Smart Lighting Controls Production, Consumption, Export, Import (2014-2019) Table Europe Wireless Smart Lighting Controls Production, Consumption, Export, Import (2014-2019) Table China Wireless Smart Lighting Controls Production, Consumption, Export, Import (2014-2019) Table Japan Wireless Smart Lighting Controls Production, Consumption, Export, Import (2014-2019) Table Middle East & Africa Wireless Smart Lighting Controls Production, Consumption, Export, Import (2014-2019) Table India Wireless Smart Lighting Controls Production, Consumption, Export, Import (2014-2019) Table South America Wireless Smart Lighting Controls Production, Consumption, Export, Import (2014-2019) Figure North America Wireless Smart Lighting Controls Production and Growth Rate Analysis Figure North America Wireless Smart Lighting Controls Consumption and Growth Rate Analysis Figure North America Wireless Smart Lighting Controls SWOT Analysis Figure Europe Wireless Smart Lighting Controls Production and Growth Rate Analysis Figure Europe Wireless Smart Lighting Controls Consumption and Growth Rate Analysis Figure Europe Wireless Smart Lighting Controls SWOT Analysis Figure China Wireless Smart Lighting Controls Production and Growth Rate Analysis Figure China Wireless Smart Lighting Controls Consumption and Growth Rate Analysis Figure China Wireless Smart Lighting Controls SWOT Analysis Figure Japan Wireless Smart Lighting Controls Production and Growth Rate Analysis Figure Japan Wireless Smart Lighting Controls Consumption and Growth Rate Analysis Figure Japan Wireless Smart Lighting Controls SWOT Analysis Figure Middle East & Africa Wireless Smart Lighting Controls Production and Growth Rate Analysis Figure Middle East & Africa Wireless Smart Lighting Controls Consumption and Growth Rate Analysis Figure Middle East & Africa Wireless Smart Lighting Controls SWOT Analysis Figure India Wireless Smart Lighting Controls Production and Growth Rate Analysis Figure India Wireless Smart Lighting Controls Consumption and Growth Rate Analysis Figure India Wireless Smart Lighting Controls SWOT Analysis Figure South America Wireless Smart Lighting Controls Production and Growth Rate Analysis Figure South America Wireless Smart Lighting Controls Consumption and Growth Rate Analysis Figure South America Wireless Smart Lighting Controls SWOT Analysis Figure Top 3 Market Share of Wireless Smart Lighting Controls Companies Figure Top 6 Market Share of Wireless Smart Lighting Controls Companies Table Mergers, Acquisitions and Expansion Analysis Table Company Profiles Table Product Introduction Table Murata Production, Value ($), Price, Gross Margin 2014-2019 Figure Murata Production and Growth Rate Figure Murata Value ($) Market Share 2014-2019 Figure Murata Market Share of Wireless Smart Lighting Controls Segmented by Region in 2018 Table Company Profiles Table Product Introduction Table Zengge Production, Value ($), Price, Gross Margin 2014-2019 Figure Zengge Production and Growth Rate Figure Zengge Value ($) Market Share 2014-2019 Figure Zengge Market Share of Wireless Smart Lighting Controls Segmented by Region in 2018 Table Company Profiles Table Product Introduction Table Control4 Production, Value ($), Price, Gross Margin 2014-2019 Figure Control4 Production and Growth Rate Figure Control4 Value ($) Market Share 2014-2019 Figure Control4 Market Share of Wireless Smart Lighting Controls Segmented by Region in 2018 Table Company Profiles Table Product Introduction Table Telematics Production, Value ($), Price, Gross Margin 2014-2019 Figure Telematics Production and Growth Rate Figure Telematics Value ($) Market Share 2014-2019 Figure Telematics Market Share of Wireless Smart Lighting Controls Segmented by Region in 2018 Table Company Profiles Table Product Introduction Table Legrand Production, Value ($), Price, Gross Margin 2014-2019 Figure Legrand Production and Growth Rate Figure Legrand Value ($) Market Share 2014-2019 Figure Legrand Market Share of Wireless Smart Lighting Controls Segmented by Region in 2018 Table Company Profiles Table Product Introduction Table Schneider Electric Production, Value ($), Price, Gross Margin 2014-2019 Figure Schneider Electric Production and Growth Rate Figure Schneider Electric Value ($) Market Share 2014-2019 Figure Schneider Electric Market Share of Wireless Smart Lighting Controls Segmented by Region in 2018 Table Company Profiles Table Product Introduction Table Venture Lighting Production, Value ($), Price, Gross Margin 2014-2019 Figure Venture Lighting Production and Growth Rate Figure Venture Lighting Value ($) Market Share 2014-2019 Figure Venture Lighting Market Share of Wireless Smart Lighting Controls Segmented by Region in 2018 Table Company Profiles Table Product Introduction Table Honeywell Production, Value ($), Price, Gross Margin 2014-2019 Figure Honeywell Production and Growth Rate Figure Honeywell Value ($) Market Share 2014-2019 Figure Honeywell Market Share of Wireless Smart Lighting Controls Segmented by Region in 2018 Table Company Profiles Table Product Introduction Table PHILIPS Production, Value ($), Price, Gross Margin 2014-2019 Figure PHILIPS Production and Growth Rate Figure PHILIPS Value ($) Market Share 2014-2019 Figure PHILIPS Market Share of Wireless Smart Lighting Controls Segmented by Region in 2018 Table Company Profiles Table Product Introduction Table Lutron Production, Value ($), Price, Gross Margin 2014-2019 Figure Lutron Production and Growth Rate Figure Lutron Value ($) Market Share 2014-2019 Figure Lutron Market Share of Wireless Smart Lighting Controls Segmented by Region in 2018 Table Company Profiles Table Product Introduction Table Petra Systems Production, Value ($), Price, Gross Margin 2014-2019 Figure Petra Systems Production and Growth Rate Figure Petra Systems Value ($) Market Share 2014-2019 Figure Petra Systems Market Share of Wireless Smart Lighting Controls Segmented by Region in 2018 Table Company Profiles Table Product Introduction Table DimOnOff Production, Value ($), Price, Gross Margin 2014-2019 Figure DimOnOff Production and Growth Rate Figure DimOnOff Value ($) Market Share 2014-2019 Figure DimOnOff Market Share of Wireless Smart Lighting Controls Segmented by Region in 2018 Table Company Profiles Table Product Introduction Table Osram Production, Value ($), Price, Gross Margin 2014-2019 Figure Osram Production and Growth Rate Figure Osram Value ($) Market Share 2014-2019 Figure Osram Market Share of Wireless Smart Lighting Controls Segmented by Region in 2018 Table Company Profiles Table Product Introduction Table Huagong Lighting Production, Value ($), Price, Gross Margin 2014-2019 Figure Huagong Lighting Production and Growth Rate Figure Huagong Lighting Value ($) Market Share 2014-2019 Figure Huagong Lighting Market Share of Wireless Smart Lighting Controls Segmented by Region in 2018 Table Company Profiles Table Product Introduction Table TVILIGHT Production, Value ($), Price, Gross Margin 2014-2019 Figure TVILIGHT Production and Growth Rate Figure TVILIGHT Value ($) Market Share 2014-2019 Figure TVILIGHT Market Share of Wireless Smart Lighting Controls Segmented by Region in 2018 Table Company Profiles Table Product Introduction Table GELighting Production, Value ($), Price, Gross Margin 2014-2019 Figure GELighting Production and Growth Rate Figure GELighting Value ($) Market Share 2014-2019 Figure GELighting Market Share of Wireless Smart Lighting Controls Segmented by Region in 2018 Table Company Profiles Table Product Introduction Table Echelon Production, Value ($), Price, Gross Margin 2014-2019 Figure Echelon Production and Growth Rate Figure Echelon Value ($) Market Share 2014-2019 Figure Echelon Market Share of Wireless Smart Lighting Controls Segmented by Region in 2018 Table Company Profiles Table Product Introduction Table Cimcon Production, Value ($), Price, Gross Margin 2014-2019 Figure Cimcon Production and Growth Rate Figure Cimcon Value ($) Market Share 2014-2019 Figure Cimcon Market Share of Wireless Smart Lighting Controls Segmented by Region in 2018 Table Global Wireless Smart Lighting Controls Market Value ($) Forecast, by Type Table Global Wireless Smart Lighting Controls Market Volume Forecast, by Type Figure Global Wireless Smart Lighting Controls Market Value ($) and Growth Rate Forecast of Zigbee (2019-2024) Figure Global Wireless Smart Lighting Controls Market Volume and Growth Rate Forecast of Zigbee (2019-2024) Figure Global Wireless Smart Lighting Controls Market Value ($) and Growth Rate Forecast of Wifi (2019-2024) Figure Global Wireless Smart Lighting Controls Market Volume and Growth Rate Forecast of Wifi (2019-2024) Figure Global Wireless Smart Lighting Controls Market Value ($) and Growth Rate Forecast of Bluetooth (2019-2024) Figure Global Wireless Smart Lighting Controls Market Volume and Growth Rate Forecast of Bluetooth (2019-2024) Figure Global Wireless Smart Lighting Controls Market Value ($) and Growth Rate Forecast of Z-Wave (2019-2024) Figure Global Wireless Smart Lighting Controls Market Volume and Growth Rate Forecast of Z-Wave (2019-2024) Figure Global Wireless Smart Lighting Controls Market Value ($) and Growth Rate Forecast of Enocean (2019-2024) Figure Global Wireless Smart Lighting Controls Market Volume and Growth Rate Forecast of Enocean (2019-2024) Table Global Market Value ($) Forecast by Application (2019-2024) Table Global Market Volume Forecast by Application (2019-2024) Figure Global Wireless Smart Lighting Controls Consumption and Growth Rate of Outdoor (2014-2019) Figure Global Wireless Smart Lighting Controls Consumption and Growth Rate of Residential (2014-2019) Figure Global Wireless Smart Lighting Controls Consumption and Growth Rate of Commercial (2014-2019) Figure Global Wireless Smart Lighting Controls Consumption and Growth Rate of Industrial (2014-2019) Figure Market Value ($) and Growth Rate Forecast of Industrial (2019-2024) Figure Market Volume and Growth Rate Forecast of Industrial (2019-2024) Figure North America Market Value ($) and Growth Rate Forecast (2019-2024) Table North America Consumption and Growth Rate Forecast (2019-2024) Figure Europe Market Value ($) and Growth Rate Forecast (2019-2024) Table Europe Consumption and Growth Rate Forecast (2019-2024) Figure China Market Value ($) and Growth Rate Forecast (2019-2024) Table China Consumption and Growth Rate Forecast (2019-2024) Figure Japan Market Value ($) and Growth Rate Forecast (2019-2024) Table Japan Consumption and Growth Rate Forecast (2019-2024) Figure Middle East & Africa Market Value ($) and Growth Rate Forecast (2019-2024) Table Middle East & Africa Consumption and Growth Rate Forecast (2019-2024) Figure India Market Value ($) and Growth Rate Forecast (2019-2024) Table India Consumption and Growth Rate Forecast (2019-2024) Figure South America Market Value ($) and Growth Rate Forecast (2019-2024) Table South America Consumption and Growth Rate Forecast (2019-2024) Figure Industry Resource/Technology/Labor Importance Analysis Table New Entrants SWOT Analysis Table New Project Analysis of Investment Recovery
Inquiry For Buying
Wireless Smart Lighting Controls
Request Sample
Wireless Smart Lighting Controls