Automotive After Market Size, Share, and Trends Analysis Report
CAGR :

| Market Size 2023 (Base Year) | USD 448.24 Billion |
| Market Size 2032 (Forecast Year) | USD 649.11 Billion |
| CAGR | 4.2% |
| Forecast Period | 2024 - 2032 |
| Historical Period | 2018 - 2023 |
Automotive After Market Insights
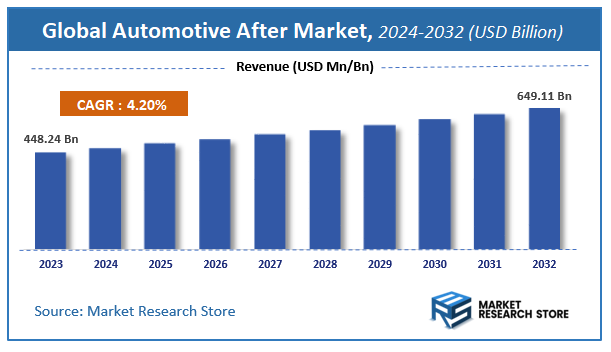
As per the published report by Market Research Store, the Global Automotive After Market size was estimated at USD 448.24 Billion in 2023 and is anticipated to reach reach USD 649.11 Billion by 2032, growing at a projected CAGR of 4.2% during the forecast period 2024-2032. The report provides a detailed analysis of the global Automotive After Market, including market trends, market dynamics, and market opportunities during the forecast period (2024-2032). It delves deeper into several market facets, such as market definition, size, growth, forecast, segmentation, competitive analysis, growth drivers, restraints, financial analysis, SWOT analysis, PORTER’s five force analysis, PESTEL analysis, market share analysis, cost-benefit analysis, challenges, restraints, strategic recommendations, and market players.
To Get more Insights, Request a Free Sample
Automotive After Market: Overview
The growth of the automotive after market is fueled by rising global demand across various industries and applications. The report highlights lucrative opportunities, analyzing cost structures, key segments, emerging trends, regional dynamics, and advancements by leading players to provide comprehensive market insights. The automotive after market report offers a detailed industry analysis from 2024 to 2032, combining quantitative and qualitative insights. It examines key factors such as pricing, market penetration, GDP impact, industry dynamics, major players, consumer behavior, and socio-economic conditions. Structured into multiple sections, the report provides a comprehensive perspective on the market from all angles.
Key sections of the automotive after market report include market segments, outlook, competitive landscape, and company profiles. Market Segments offer in-depth details based on Replacement Part Type, Vehicle Type, and other relevant classifications to support strategic marketing initiatives. Market Outlook thoroughly analyzes market trends, growth drivers, restraints, opportunities, challenges, Porter’s Five Forces framework, macroeconomic factors, value chain analysis, and pricing trends shaping the market now and in the future. The Competitive Landscape and Company Profiles section highlights major players, their strategies, and market positioning to guide investment and business decisions. The report also identifies innovation trends, new business opportunities, and investment prospects for the forecast period.
Key Highlights:
- As per the analysis shared by our research analyst, the global automotive after market is estimated to grow annually at a CAGR of around 4.2% over the forecast period (2024-2032).
- In terms of revenue, the global automotive after market size was valued at around USD 448.24 Billion in 2023 and is projected to reach USD 649.11 Billion by 2032.
- The market is projected to grow at a significant rate due to increasing vehicle lifespan, rising demand for replacement parts, growing DIY maintenance trends, and advancements in e-commerce platforms for auto parts.
- Based on the Replacement Part Type, the Battery segment is growing at a high rate and will continue to dominate the global market as per industry projections.
- On the basis of Vehicle Type, the Passenger Cars segment is anticipated to command the largest market share.
- Based on region, Asia-Pacific is projected to dominate the global market during the forecast period.
Automotive After Market: Report Scope
This report thoroughly analyzes the automotive after market, exploring its historical trends, current state, and future projections. The market estimates presented result from a robust research methodology, incorporating primary research, secondary sources, and expert opinions. These estimates are influenced by the prevailing market dynamics as well as key economic, social, and political factors. Furthermore, the report considers the impact of regulations, government expenditures, and advancements in research and development on the market. Both positive and negative shifts are evaluated to ensure a comprehensive and accurate market outlook.
| Report Attributes | Report Details |
|---|---|
| Report Name | Automotive After Market |
| Market Size in 2023 | USD 448.24 Billion |
| Market Forecast in 2032 | USD 649.11 Billion |
| Growth Rate | CAGR of 4.2% |
| Number of Pages | 172 |
| Key Companies Covered | Robert Bosch GmbH (Germany), Denso Corporation (Japan), Magna International Inc. (Canada), Continental AG (Germany), ZF Friedrichshafen AG (Germany), Aisin Seiki Co. (Japan), Lear Corp. (U.S.), Bridgestone Corporation (Japan), Faurecia (France), Valeo SA |
| Segments Covered | By Replacement Part Type, By Vehicle Type, and By Region |
| Regions Covered | North America, Europe, Asia Pacific (APAC), Latin America, Middle East, and Africa (MEA) |
| Base Year | 2023 |
| Historical Year | 2018 to 2023 |
| Forecast Year | 2024 to 2032 |
| Customization Scope | Avail customized purchase options to meet your exact research needs. Request For Customization |
Automotive After Market: Dynamics
Key Growth Drivers
The automotive aftermarket is experiencing consistent growth driven by the increasing average age of vehicles on the road globally, which necessitates more frequent maintenance and repairs. The rising vehicle parc, particularly in developing economies, also contributes significantly to the demand for aftermarket parts and services. The increasing complexity of modern vehicles, incorporating advanced electronics and software, often requires specialized knowledge and tools for repair and maintenance, driving consumers to professional aftermarket service providers. Furthermore, the growing consumer preference for personalization and customization of their vehicles through accessories and performance upgrades fuels demand in specific aftermarket segments. The cost-effectiveness of repairing and maintaining older vehicles compared to purchasing new ones, especially during economic downturns, also acts as a key growth driver.
Restraints
Despite the positive growth drivers, the automotive aftermarket faces certain restraints. The increasing sophistication and integration of vehicle systems can make repairs more complex and potentially limit the do-it-yourself (DIY) market. The growing penetration of electric vehicles (EVs), which generally require less maintenance than internal combustion engine (ICE) vehicles, could pose a long-term restraint on traditional aftermarket segments focused on engine and exhaust systems. The increasing consolidation within the automotive industry, including closer relationships between OEMs and dealerships, can potentially channel more repair and maintenance work towards authorized service centers. The rise of advanced driver-assistance systems (ADAS) and autonomous driving technologies might also impact the frequency and nature of accidents, influencing the demand for certain collision repair services. Furthermore, the availability and affordability of genuine and high-quality aftermarket parts can be a concern in some regions.
Opportunities
The automotive aftermarket presents numerous opportunities for innovation and growth. The increasing connectivity of vehicles and the rise of telematics offer opportunities for predictive maintenance services and remote diagnostics, creating new revenue streams for aftermarket players. The growing demand for sustainable and eco-friendly automotive products, such as recycled parts and environmentally friendly fluids, represents a developing market segment. The expansion of e-commerce platforms provides aftermarket parts suppliers and service providers with a wider reach and more efficient distribution channels. The increasing focus on vehicle customization and personalization, particularly among younger consumers, offers opportunities for specialized parts and accessories. Furthermore, the aftermarket for EVs is an emerging area with significant growth potential, requiring new skills and specialized parts and services. The development of standardized diagnostic tools and repair information accessible to independent repair shops can also level the playing field and expand their service capabilities.
Challenges
The automotive aftermarket faces several challenges that need to be addressed for sustained success. Counterfeiting and the proliferation of low-quality, potentially unsafe aftermarket parts pose a significant threat to consumer safety and the reputation of legitimate businesses. Keeping pace with the rapid technological advancements in vehicles, including software updates and complex electronic systems, requires continuous training and investment in new diagnostic tools and equipment for aftermarket technicians. Ensuring data security and privacy in connected car services and aftermarket telematics solutions is crucial for building consumer trust. Navigating the complex and often varying regulations related to vehicle repair and emissions across different regions can be challenging for aftermarket businesses operating internationally. The need to attract and retain skilled technicians in a competitive labor market is also a significant challenge. Furthermore, adapting business models to address the evolving needs of tech-savvy consumers and the increasing influence of digital platforms is essential for staying competitive.
Automotive After Market: Segmentation Insights
The global automotive after market is segmented based on Replacement Part Type, Vehicle Type, and Region. All the segments of the automotive after market have been analyzed based on present & future trends and the market is estimated from 2024 to 2032.
Based on Replacement Part Type, the global automotive after market is divided into Battery, Brake Pads, Filters, Gasket & Seals, Lighting Component, Body Part, Wheels & Tires, Others.
On the basis of Vehicle Type, the global automotive after market is bifurcated into Passenger Cars, Commercial Vehicles.
Automotive After Market: Regional Insights
The Automotive After market is witnessing robust growth, with North America dominating the global landscape. This leadership is driven by the region’s large vehicle fleet, high average vehicle age (over 12 years in the U.S.), and strong consumer demand for maintenance and customization. North America benefits from a well-established distribution network, advanced e-commerce platforms for auto parts, and a culture of DIY repairs and upgrades. Europe follows closely, supported by stringent vehicle safety and emissions regulations in Germany, France, and the UK, which drive demand for replacement parts and retrofits. Meanwhile, the Asia-Pacific region is projected to grow at the fastest CAGR, fueled by increasing vehicle ownership, urbanization, and expanding independent repair shops in China, India, and Southeast Asia. However, North America retains the largest market share (over 35%), owing to its mature ecosystem of retailers (e.g., AutoZone, O’Reilly), technological advancements in telematics for predictive maintenance, and rising demand for electric vehicle (EV) aftermarket solutions. The region’s dominance is further reinforced by investments in omnichannel retail and AI-driven part recommendations. With global vehicle longevity increasing, North America’s automotive aftermarket is poised to maintain its lead through 2030.
Automotive After Market: Competitive Landscape
The automotive after market report offers a thorough analysis of both established and emerging players within the market. It includes a detailed list of key companies, categorized based on the types of products they offer and other relevant factors. The report also highlights the market entry year for each player, providing further context for the research analysis.
The "Global Automotive After Market" study offers valuable insights, focusing on the global market landscape, with an emphasis on major industry players such as;
- Robert Bosch GmbH (Germany)
- Denso Corporation (Japan)
- Magna International Inc. (Canada)
- Continental AG (Germany)
- ZF Friedrichshafen AG (Germany)
- Aisin Seiki Co. (Japan)
- Lear Corp. (U.S.)
- Bridgestone Corporation (Japan)
- Faurecia (France)
- Valeo SA (France)
The Global Automotive After Market is Segmented as Follows:
By Replacement Part Type
- Battery
- Brake Pads
- Filters
- Gasket & Seals
- Lighting Component
- Body Part
- Wheels & Tires
- Others
By Vehicle Type
- Passenger Cars
- Commercial Vehicles
By Region
- North America
- The U.S.
- Canada
- Mexico
- Europe
- France
- The UK
- Spain
- Germany
- Italy
- Rest of Europe
- Asia Pacific
- China
- Japan
- India
- Australia
- South Korea
- Rest of Asia Pacific
- The Middle East & Africa
- Saudi Arabia
- UAE
- Egypt
- Kuwait
- South Africa
- Rest of the Middle East & Africa
- Latin America
- Brazil
- Argentina
- Rest of Latin America
Market Evolution
This section evaluates the market position of the product or service by examining its development pathway and competitive dynamics. It provides a detailed overview of the product's growth stages, including the early (historical) phase, the mid-stage, and anticipated future advancements influenced by innovation and emerging technologies.
Porter’s Analysis
Porter’s Five Forces framework offers a strategic lens for assessing competitor behavior and the positioning of key players in the automotive after industry. This section explores the external factors shaping competitive dynamics and influencing market strategies in the years ahead. The analysis focuses on five critical forces:
- Competitive Rivalry
- Threat of New Entrants
- Threat of Substitutes
- Supplier Bargaining Power
- Buyer Bargaining Power
Value Chain & Market Attractiveness Analysis
The value chain analysis helps businesses optimize operations by mapping the product flow from suppliers to end consumers, identifying opportunities to streamline processes and gain a competitive edge. Segment-wise market attractiveness analysis evaluates key dimensions like product categories, demographics, and regions, assessing growth potential, market size, and profitability. This enables businesses to focus resources on high-potential segments for better ROI and long-term value.
PESTEL Analysis
PESTEL analysis is a powerful tool in market research reports that enhances market understanding by systematically examining the external macro-environmental factors influencing a business or industry. The acronym stands for Political, Economic, Social, Technological, Environmental, and Legal factors. By evaluating these dimensions, PESTEL analysis provides a comprehensive overview of the broader context within which a market operates, helping businesses identify potential opportunities and threats.
- Political factors assess government policies, stability, trade regulations, and political risks that could impact market operations.
- Economic factors examine variables like inflation, exchange rates, economic growth, and consumer spending power to determine market viability.
- Social factors explore cultural trends, demographics, and lifestyle changes that shape consumer behavior and preferences.
- Technological factors evaluate innovation, R&D, and technological advancements affecting product development and operational efficiencies.
- Environmental factors focus on sustainability, climate change impacts, and eco-friendly practices shaping market trends.
- Legal factors address compliance requirements, industry regulations, and intellectual property laws impacting market entry and operations.
Import-Export Analysis & Pricing Analysis
An import-export analysis is vital for market research, revealing global trade dynamics, trends, and opportunities. It examines trade volumes, product categories, and regional competitiveness, offering insights into supply chains and market demand. This section also analyzes past and future pricing trends, helping businesses optimize strategies and enabling consumers to assess product value effectively.
Automotive After Market: Company Profiles
The report identifies key players in the automotive after market through competitive landscape and company profiles, evaluating their offerings, financial performance, strategies, and market positioning. It includes a SWOT analysis of the top 3-5 companies, assessing strengths, weaknesses, opportunities, and threats. The competitive landscape highlights rankings, recent activities (mergers, acquisitions, partnerships, product launches), and regional footprints using the Ace matrix. Customization is available to meet client-specific needs.
Regional & Industry Footprint
This section details the geographic reach, sales networks, and market penetration of companies profiled in the automotive after report, showcasing their operations and distribution across regions. It analyzes the alignment of companies with specific industry verticals, highlighting the industries they serve and the scope of their products and services within those sectors.
Ace Matrix
This section categorizes companies into four distinct groups—Active, Cutting Edge, Innovator, and Emerging—based on their product and business strategies. The evaluation of product strategy focuses on aspects such as the range and depth of offerings, commitment to innovation, product functionalities, and scalability. Key elements like global reach, sector coverage, strategic acquisitions, and long-term growth plans are considered for business strategy. This analysis provides a detailed view of companies' position within the market and highlights their potential for future growth and development.
Research Methodology
The qualitative and quantitative insights for the automotive after market are derived through a multi-faceted research approach, combining input from subject matter experts, primary research, and secondary data sources. Primary research includes gathering critical information via face-to-face or telephonic interviews, surveys, questionnaires, and feedback from industry professionals, key opinion leaders (KOLs), and customers. Regular interviews with industry experts are conducted to deepen the analysis and reinforce the existing data, ensuring a robust and well-rounded market understanding.
Secondary research for this report was carried out by the Market Research Store team, drawing on a variety of authoritative sources, such as:
- Official company websites, annual reports, financial statements, investor presentations, and SEC filings
- Internal and external proprietary databases, as well as relevant patent and regulatory databases
- Government publications, national statistical databases, and industry-specific market reports
- Media coverage, including news articles, press releases, and webcasts about market participants
- Paid industry databases for detailed market insights
Market Research Store conducted in-depth consultations with various key opinion leaders in the industry, including senior executives from top companies and regional leaders from end-user organizations. This effort aimed to gather critical insights on factors such as the market share of dominant brands in specific countries and regions, along with pricing strategies for products and services.
To determine total sales data, the research team conducted primary interviews across multiple countries with influential stakeholders, including:
- Distributors
- Marketing, Brand, and Product Managers
- Procurement and Production Managers
- Sales and Regional Sales Managers, Country Managers
- Technical Specialists
- C-Level Executives
These subject matter experts, with their extensive industry experience, helped validate and refine the findings. For secondary research, data was sourced from a wide range of materials, including online resources, company annual reports, industry publications, research papers, association reports, and government websites. These various sources provide a comprehensive and well-rounded perspective on the market.
Frequently Asked Questions
Table Of Content
List of Tables and Figures Figure Product Picture of Automotive Aftermarket Table Product Specification of Automotive Aftermarket Figure Market Concentration Ratio and Market Maturity Analysis of Automotive Aftermarket Figure Global Automotive Aftermarket Value ($) and Growth Rate from 2014-2024 Table Different Types of Automotive Aftermarket Figure Global Automotive Aftermarket Value ($) Segment by Type from 2014-2019 Figure Braking disks Picture Figure Calipers Picture Figure Engine Compnents (ICE) Picture Figure Power trains (except ICE) Picture Figure Others Picture Table Different Applications of Automotive Aftermarket Figure Global Automotive Aftermarket Value ($) Segment by Applications from 2014-2019 Figure Passenger Car Picture Figure Commercial Vehicle Picture Table Research Regions of Automotive Aftermarket Figure North America Automotive Aftermarket Production Value ($) and Growth Rate (2014-2019) Figure Europe Automotive Aftermarket Production Value ($) and Growth Rate (2014-2019) Table China Automotive Aftermarket Production Value ($) and Growth Rate (2014-2019) Table Japan Automotive Aftermarket Production Value ($) and Growth Rate (2014-2019) Table Middle East & Africa Automotive Aftermarket Production Value ($) and Growth Rate (2014-2019) Table India Automotive Aftermarket Production Value ($) and Growth Rate (2014-2019) Table South America Automotive Aftermarket Production Value ($) and Growth Rate (2014-2019) Table Emerging Countries of Automotive Aftermarket Table Growing Market of Automotive Aftermarket Figure Industry Chain Analysis of Automotive Aftermarket Table Upstream Raw Material Suppliers of Automotive Aftermarket with Contact Information Table Major Players Manufacturing Base and Market Share ($) of Automotive Aftermarket in 2018 Table Major Players Automotive Aftermarket Product Types in 2018 Figure Production Process of Automotive Aftermarket Figure Manufacturing Cost Structure of Automotive Aftermarket Figure Channel Status of Automotive Aftermarket Table Major Distributors of Automotive Aftermarket with Contact Information Table Major Downstream Buyers of Automotive Aftermarket with Contact Information Table Global Automotive Aftermarket Value ($) by Type (2014-2019) Table Global Automotive Aftermarket Value ($) Share by Type (2014-2019) Figure Global Automotive Aftermarket Value ($) Share by Type (2014-2019) Table Global Automotive Aftermarket Production by Type (2014-2019) Table Global Automotive Aftermarket Production Share by Type (2014-2019) Figure Global Automotive Aftermarket Production Share by Type (2014-2019) Figure Global Automotive Aftermarket Value ($) and Growth Rate of Braking disks Figure Global Automotive Aftermarket Value ($) and Growth Rate of Calipers Figure Global Automotive Aftermarket Value ($) and Growth Rate of Engine Compnents (ICE) Figure Global Automotive Aftermarket Value ($) and Growth Rate of Power trains (except ICE) Figure Global Automotive Aftermarket Value ($) and Growth Rate of Others Figure Global Automotive Aftermarket Price by Type (2014-2019) Table Global Automotive Aftermarket Consumption by Application (2014-2019) Table Global Automotive Aftermarket Consumption Market Share by Application (2014-2019) Figure Global Automotive Aftermarket Consumption Market Share by Application (2014-2019) Table Downstream Buyers Introduction by Application Figure Global Automotive Aftermarket Consumption and Growth Rate of Passenger Car (2014-2019) Figure Global Automotive Aftermarket Consumption and Growth Rate of Commercial Vehicle (2014-2019) Table Global Automotive Aftermarket Value ($) by Region (2014-2019) Table Global Automotive Aftermarket Value ($) Market Share by Region (2014-2019) Figure Global Automotive Aftermarket Value ($) Market Share by Region (2014-2019) Table Global Automotive Aftermarket Production by Region (2014-2019) Table Global Automotive Aftermarket Production Market Share by Region (2014-2019) Figure Global Automotive Aftermarket Production Market Share by Region (2014-2019) Table Global Automotive Aftermarket Production, Value ($), Price and Gross Margin (2014-2019) Table North America Automotive Aftermarket Production, Value ($), Price and Gross Margin (2014-2019) Table Europe Automotive Aftermarket Production, Value ($), Price and Gross Margin (2014-2019) Table China Automotive Aftermarket Production, Value ($), Price and Gross Margin (2014-2019) Table Japan Automotive Aftermarket Production, Value ($), Price and Gross Margin (2014-2019) Table Middle East & Africa Automotive Aftermarket Production, Value ($), Price and Gross Margin (2014-2019) Table India Automotive Aftermarket Production, Value ($), Price and Gross Margin (2014-2019) Table South America Automotive Aftermarket Production, Value ($), Price and Gross Margin (2014-2019) Table Global Automotive Aftermarket Consumption by Regions (2014-2019) Figure Global Automotive Aftermarket Consumption Share by Regions (2014-2019) Table North America Automotive Aftermarket Production, Consumption, Export, Import (2014-2019) Table Europe Automotive Aftermarket Production, Consumption, Export, Import (2014-2019) Table China Automotive Aftermarket Production, Consumption, Export, Import (2014-2019) Table Japan Automotive Aftermarket Production, Consumption, Export, Import (2014-2019) Table Middle East & Africa Automotive Aftermarket Production, Consumption, Export, Import (2014-2019) Table India Automotive Aftermarket Production, Consumption, Export, Import (2014-2019) Table South America Automotive Aftermarket Production, Consumption, Export, Import (2014-2019) Figure North America Automotive Aftermarket Production and Growth Rate Analysis Figure North America Automotive Aftermarket Consumption and Growth Rate Analysis Figure North America Automotive Aftermarket SWOT Analysis Figure Europe Automotive Aftermarket Production and Growth Rate Analysis Figure Europe Automotive Aftermarket Consumption and Growth Rate Analysis Figure Europe Automotive Aftermarket SWOT Analysis Figure China Automotive Aftermarket Production and Growth Rate Analysis Figure China Automotive Aftermarket Consumption and Growth Rate Analysis Figure China Automotive Aftermarket SWOT Analysis Figure Japan Automotive Aftermarket Production and Growth Rate Analysis Figure Japan Automotive Aftermarket Consumption and Growth Rate Analysis Figure Japan Automotive Aftermarket SWOT Analysis Figure Middle East & Africa Automotive Aftermarket Production and Growth Rate Analysis Figure Middle East & Africa Automotive Aftermarket Consumption and Growth Rate Analysis Figure Middle East & Africa Automotive Aftermarket SWOT Analysis Figure India Automotive Aftermarket Production and Growth Rate Analysis Figure India Automotive Aftermarket Consumption and Growth Rate Analysis Figure India Automotive Aftermarket SWOT Analysis Figure South America Automotive Aftermarket Production and Growth Rate Analysis Figure South America Automotive Aftermarket Consumption and Growth Rate Analysis Figure South America Automotive Aftermarket SWOT Analysis Figure Top 3 Market Share of Automotive Aftermarket Companies Figure Top 6 Market Share of Automotive Aftermarket Companies Table Mergers, Acquisitions and Expansion Analysis Table Company Profiles Table Product Introduction Table Denso Corporation Production, Value ($), Price, Gross Margin 2014-2019 Figure Denso Corporation Production and Growth Rate Figure Denso Corporation Value ($) Market Share 2014-2019 Figure Denso Corporation Market Share of Automotive Aftermarket Segmented by Region in 2018 Table Company Profiles Table Product Introduction Table The Michelin Group Production, Value ($), Price, Gross Margin 2014-2019 Figure The Michelin Group Production and Growth Rate Figure The Michelin Group Value ($) Market Share 2014-2019 Figure The Michelin Group Market Share of Automotive Aftermarket Segmented by Region in 2018 Table Company Profiles Table Product Introduction Table Magneti Marelli S.p.A. Production, Value ($), Price, Gross Margin 2014-2019 Figure Magneti Marelli S.p.A. Production and Growth Rate Figure Magneti Marelli S.p.A. Value ($) Market Share 2014-2019 Figure Magneti Marelli S.p.A. Market Share of Automotive Aftermarket Segmented by Region in 2018 Table Company Profiles Table Product Introduction Table Hyundai Mobis Production, Value ($), Price, Gross Margin 2014-2019 Figure Hyundai Mobis Production and Growth Rate Figure Hyundai Mobis Value ($) Market Share 2014-2019 Figure Hyundai Mobis Market Share of Automotive Aftermarket Segmented by Region in 2018 Table Company Profiles Table Product Introduction Table Bridgestone Corporation Production, Value ($), Price, Gross Margin 2014-2019 Figure Bridgestone Corporation Production and Growth Rate Figure Bridgestone Corporation Value ($) Market Share 2014-2019 Figure Bridgestone Corporation Market Share of Automotive Aftermarket Segmented by Region in 2018 Table Company Profiles Table Product Introduction Table Aisin Seiki Co., Ltd. Production, Value ($), Price, Gross Margin 2014-2019 Figure Aisin Seiki Co., Ltd. Production and Growth Rate Figure Aisin Seiki Co., Ltd. Value ($) Market Share 2014-2019 Figure Aisin Seiki Co., Ltd. Market Share of Automotive Aftermarket Segmented by Region in 2018 Table Company Profiles Table Product Introduction Table Robert Bosch GmbH Production, Value ($), Price, Gross Margin 2014-2019 Figure Robert Bosch GmbH Production and Growth Rate Figure Robert Bosch GmbH Value ($) Market Share 2014-2019 Figure Robert Bosch GmbH Market Share of Automotive Aftermarket Segmented by Region in 2018 Table Company Profiles Table Product Introduction Table Continental AG Production, Value ($), Price, Gross Margin 2014-2019 Figure Continental AG Production and Growth Rate Figure Continental AG Value ($) Market Share 2014-2019 Figure Continental AG Market Share of Automotive Aftermarket Segmented by Region in 2018 Table Company Profiles Table Product Introduction Table 3M Production, Value ($), Price, Gross Margin 2014-2019 Figure 3M Production and Growth Rate Figure 3M Value ($) Market Share 2014-2019 Figure 3M Market Share of Automotive Aftermarket Segmented by Region in 2018 Table Company Profiles Table Product Introduction Table Goodyear Tire & Rubber Company Production, Value ($), Price, Gross Margin 2014-2019 Figure Goodyear Tire & Rubber Company Production and Growth Rate Figure Goodyear Tire & Rubber Company Value ($) Market Share 2014-2019 Figure Goodyear Tire & Rubber Company Market Share of Automotive Aftermarket Segmented by Region in 2018 Table Company Profiles Table Product Introduction Table ZF Friedrichshafen AG Production, Value ($), Price, Gross Margin 2014-2019 Figure ZF Friedrichshafen AG Production and Growth Rate Figure ZF Friedrichshafen AG Value ($) Market Share 2014-2019 Figure ZF Friedrichshafen AG Market Share of Automotive Aftermarket Segmented by Region in 2018 Table Global Automotive Aftermarket Market Value ($) Forecast, by Type Table Global Automotive Aftermarket Market Volume Forecast, by Type Figure Global Automotive Aftermarket Market Value ($) and Growth Rate Forecast of Braking disks (2019-2024) Figure Global Automotive Aftermarket Market Volume and Growth Rate Forecast of Braking disks (2019-2024) Figure Global Automotive Aftermarket Market Value ($) and Growth Rate Forecast of Calipers (2019-2024) Figure Global Automotive Aftermarket Market Volume and Growth Rate Forecast of Calipers (2019-2024) Figure Global Automotive Aftermarket Market Value ($) and Growth Rate Forecast of Engine Compnents (ICE) (2019-2024) Figure Global Automotive Aftermarket Market Volume and Growth Rate Forecast of Engine Compnents (ICE) (2019-2024) Figure Global Automotive Aftermarket Market Value ($) and Growth Rate Forecast of Power trains (except ICE) (2019-2024) Figure Global Automotive Aftermarket Market Volume and Growth Rate Forecast of Power trains (except ICE) (2019-2024) Figure Global Automotive Aftermarket Market Value ($) and Growth Rate Forecast of Others (2019-2024) Figure Global Automotive Aftermarket Market Volume and Growth Rate Forecast of Others (2019-2024) Table Global Market Value ($) Forecast by Application (2019-2024) Table Global Market Volume Forecast by Application (2019-2024) Figure Global Automotive Aftermarket Consumption and Growth Rate of Passenger Car (2014-2019) Figure Global Automotive Aftermarket Consumption and Growth Rate of Commercial Vehicle (2014-2019) Figure Market Value ($) and Growth Rate Forecast of Commercial Vehicle (2019-2024) Figure Market Volume and Growth Rate Forecast of Commercial Vehicle (2019-2024) Figure North America Market Value ($) and Growth Rate Forecast (2019-2024) Table North America Consumption and Growth Rate Forecast (2019-2024) Figure Europe Market Value ($) and Growth Rate Forecast (2019-2024) Table Europe Consumption and Growth Rate Forecast (2019-2024) Figure China Market Value ($) and Growth Rate Forecast (2019-2024) Table China Consumption and Growth Rate Forecast (2019-2024) Figure Japan Market Value ($) and Growth Rate Forecast (2019-2024) Table Japan Consumption and Growth Rate Forecast (2019-2024) Figure Middle East & Africa Market Value ($) and Growth Rate Forecast (2019-2024) Table Middle East & Africa Consumption and Growth Rate Forecast (2019-2024) Figure India Market Value ($) and Growth Rate Forecast (2019-2024) Table India Consumption and Growth Rate Forecast (2019-2024) Figure South America Market Value ($) and Growth Rate Forecast (2019-2024) Table South America Consumption and Growth Rate Forecast (2019-2024) Figure Industry Resource/Technology/Labor Importance Analysis Table New Entrants SWOT Analysis Table New Project Analysis of Investment Recovery
Inquiry For Buying
Automotive After
Request Sample
Automotive After