Biogas Generator Sets Market Size, Share, and Trends Analysis Report
CAGR :

| Market Size 2023 (Base Year) | USD 240.16 Million |
| Market Size 2032 (Forecast Year) | USD 353.23 Million |
| CAGR | 4.38% |
| Forecast Period | 2024 - 2032 |
| Historical Period | 2018 - 2023 |
Biogas Generator Sets Market Insights
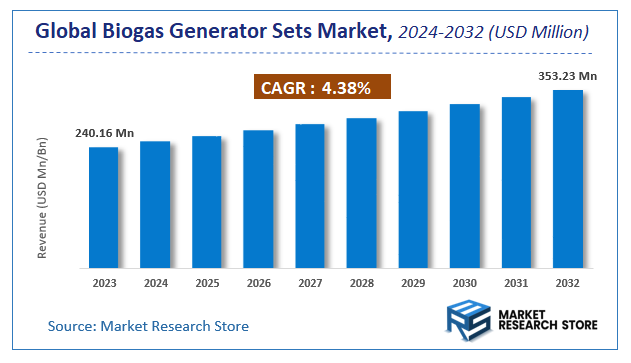
A latest report by Market Research Store estimates that the Global Biogas Generator Sets Market was valued at USD 240.16 Million in 2023 and is expected to reach USD 353.23 Million by 2032, with a CAGR of 4.38% during the forecast period 2024-2032. The report Biogas Generator Sets Market overview, growth factors, restraints, opportunities, segmentation, key developments, competitive landscape, consumer insights, and market growth forecast in terms of value or volume. These structured details offer an all-inclusive market overview, providing valuable insights for investment decisions, business decisions, strategic planning, and competitive analysis.
To Get more Insights, Request a Free Sample
Biogas Generator Sets Market: Overview
The growth of the biogas generator sets market is fueled by rising global demand across various industries and applications. The report highlights lucrative opportunities, analyzing cost structures, key segments, emerging trends, regional dynamics, and advancements by leading players to provide comprehensive market insights. The biogas generator sets market report offers a detailed industry analysis from 2024 to 2032, combining quantitative and qualitative insights. It examines key factors such as pricing, market penetration, GDP impact, industry dynamics, major players, consumer behavior, and socio-economic conditions. Structured into multiple sections, the report provides a comprehensive perspective on the market from all angles.
Key sections of the biogas generator sets market report include market segments, outlook, competitive landscape, and company profiles. Market Segments offer in-depth details based on Feedstock Type, Technology, End-Use Application, Size of Installation, Operational Mode, and other relevant classifications to support strategic marketing initiatives. Market Outlook thoroughly analyzes market trends, growth drivers, restraints, opportunities, challenges, Porter’s Five Forces framework, macroeconomic factors, value chain analysis, and pricing trends shaping the market now and in the future. The Competitive Landscape and Company Profiles section highlights major players, their strategies, and market positioning to guide investment and business decisions. The report also identifies innovation trends, new business opportunities, and investment prospects for the forecast period.
Key Highlights:
- As per the analysis shared by our research analyst, the global biogas generator sets market is estimated to grow annually at a CAGR of around 4.38% over the forecast period (2024-2032).
- In terms of revenue, the global biogas generator sets market size was valued at around USD 240.16 Million in 2023 and is projected to reach USD 353.23 Million by 2032.
- The market is projected to grow at a significant rate due to increasing focus on renewable energy sources, stringent environmental regulations regarding waste management, and the growing demand for decentralized power generation using readily available organic waste.
- Based on the Feedstock Type, the Agricultural Waste segment is growing at a high rate and will continue to dominate the global market as per industry projections.
- On the basis of Technology, the Mesophilic Digestion segment is anticipated to command the largest market share.
- In terms of End-Use Application, the Electricity Generation segment is projected to lead the global market.
- By Size of Installation, the Small Scale (Up to 50 kW) segment is predicted to dominate the global market.
- Based on the Operational Mode, the Standalone Systems segment is expected to swipe the largest market share.
- Based on region, Europe is projected to dominate the global market during the forecast period.
Biogas Generator Sets Market: Report Scope
This report thoroughly analyzes the biogas generator sets market, exploring its historical trends, current state, and future projections. The market estimates presented result from a robust research methodology, incorporating primary research, secondary sources, and expert opinions. These estimates are influenced by the prevailing market dynamics as well as key economic, social, and political factors. Furthermore, the report considers the impact of regulations, government expenditures, and advancements in research and development on the market. Both positive and negative shifts are evaluated to ensure a comprehensive and accurate market outlook.
| Report Attributes | Report Details |
|---|---|
| Report Name | Biogas Generator Sets Market |
| Market Size in 2023 | USD 240.16 Million |
| Market Forecast in 2032 | USD 353.23 Million |
| Growth Rate | CAGR of 4.38% |
| Number of Pages | 193 |
| Key Companies Covered | Caterpillar, GE, Kohler, Cummins, SLPM, JDEC, Zibo Diesel Engine, Shandong Lvhuan Power Equipment |
| Segments Covered | By Feedstock Type, By Technology, By End-Use Application, By Size of Installation, By Operational Mode, and By Region |
| Regions Covered | North America, Europe, Asia Pacific (APAC), Latin America, Middle East, and Africa (MEA) |
| Base Year | 2023 |
| Historical Year | 2018 to 2023 |
| Forecast Year | 2024 to 2032 |
| Customization Scope | Avail customized purchase options to meet your exact research needs. Request For Customization |
Biogas Generator Sets Market: Dynamics
Key Growth Drivers:
The biogas generator sets market is experiencing significant growth, primarily driven by the increasing global focus on renewable energy sources and waste management. The need for decentralized power generation and energy independence, particularly in rural and remote areas, is a significant driver. Stringent environmental regulations aimed at reducing greenhouse gas emissions and promoting sustainable energy practices further fuel market expansion. Furthermore, the growing adoption of biogas generator sets in agricultural and industrial sectors, where organic waste is readily available, contributes to market growth. The increasing focus on circular economy principles and the utilization of waste-to-energy technologies also drive demand. The development of efficient and reliable biogas generator sets with improved performance and reduced emissions further supports market expansion.
Restraints:
A significant restraint on the biogas generator sets market is the variability in biogas quality and availability, which can affect generator performance and reliability. The potential for high initial investment costs associated with biogas plant construction and generator set installation can be a barrier for some users. The need for specialized maintenance and operational expertise can increase operational costs. Furthermore, the potential for regulatory uncertainties and permitting challenges related to biogas production and utilization can create complexities. The potential for environmental concerns related to biogas leakage and emissions, if not properly managed, can also limit adoption. The competition from alternative renewable energy sources, such as solar and wind power, can also limit market growth.
Opportunities:
The biogas generator sets market presents considerable growth opportunities by focusing on developing innovative and efficient biogas utilization technologies. The integration of advanced gas cleaning and conditioning systems can improve biogas quality and generator performance. The development of modular and portable biogas generator sets can enhance accessibility for small-scale applications and remote locations. Furthermore, the potential for developing combined heat and power (CHP) systems, which utilize waste heat for heating or cooling, can enhance energy efficiency. The growing demand for decentralized power generation in developing economies offers significant growth potential. The development of biogas generator sets for specialized applications, such as landfill gas utilization and wastewater treatment plants, can create niche markets. The increasing focus on carbon capture and utilization (CCU) technologies can drive the development of biogas-based power generation with carbon sequestration.
Challenges:
The biogas generator sets market faces challenges related to ensuring the reliable and efficient operation of generator sets with variable biogas quality and composition. Developing and implementing robust gas cleaning and conditioning systems is crucial. Addressing the potential for high maintenance requirements and ensuring long-term generator performance requires advanced design and component selection. Competing with established renewable energy technologies and demonstrating the cost-effectiveness and performance benefits of biogas generator sets is an ongoing challenge. Furthermore, managing the integration of diverse biogas production and utilization technologies can be technically challenging. Building trust and credibility with users and regulatory agencies requires robust performance data and transparent communication. Adapting to the rapidly evolving renewable energy policies and ensuring compliance with environmental regulations is a continuous challenge. Providing comprehensive installation guides and maintenance instructions is also a key concern.
Biogas Generator Sets Market: Segmentation Insights
The global biogas generator sets market is segmented based on Feedstock Type, Technology, End-Use Application, Size of Installation, Operational Mode, and Region. All the segments of the biogas generator sets market have been analyzed based on present & future trends and the market is estimated from 2024 to 2032.
Based on Feedstock Type, the global biogas generator sets market is divided into Agricultural Waste, Food Waste, Municipal Solid Waste, Animal Manure, Energy Crops.
On the basis of Technology, the global biogas generator sets market is bifurcated into Mesophilic Digestion, Thermophilic Digestion, Batch Digestion, Continuous Digestion, Co-Digestion.
In terms of End-Use Application, the global biogas generator sets market is categorized into Electricity Generation, Heat Generation, Combined Heat and Power (CHP), Biomethane Generation, Transport Fuel.
Based on Size of Installation, the global biogas generator sets market is split into Small Scale (Up to 50 kW), Medium Scale (51 kW to 1 MW), Large Scale (Above 1 MW), Microbial Fuel Cells.
By Operational Mode, the global biogas generator sets market is divided into Standalone Systems, Grid-Connected Systems, Hybrid Systems, Decentralized Systems.
Biogas Generator Sets Market: Regional Insights
The European market dominates the global biogas generator sets sector, capturing 42.6% of the $3.8 billion market in 2024 (Frost & Sullivan), propelled by aggressive renewable energy policies and circular economy adoption. Germany accounts for 34% of regional demand (German Biogas Association 2024), with its 9,800 operational biogas plants, while Italy's biomethane decree drives 18.2% YoY growth.
North America follows with 28.3% market share, where U.S. RNG projects require 40% more gen-sets in 2024 (EPA data), and APAC shows the fastest growth (14.7% CAGR 2024-2030) through Thailand's agro-waste initiatives and China's 15GW biogas power target. Europe's technological edge in combined heat and power (CHP) systems (72% of global installations) and 200-500kW premium models (55% market share) ensures continued dominance through 2030.
Key Innovations:
EU's 2-stage fermentation systems boost output by 27% vs conventional models
North America's landfill-gas gen-sets grow 23% annually (Waste Management Inc. data)
APAC's containerized solutions capture 38% of emerging market purchases
Europe's hydrogen-blending ready units command 60% price premium
Biogas Generator Sets Market: Competitive Landscape
The biogas generator sets market Report offers a thorough analysis of both established and emerging players within the market. It includes a detailed list of key companies, categorized based on the types of products they offer and other relevant factors. The report also highlights the market entry year for each player, providing further context for the research analysis.
The "Global Biogas Generator Sets Market" study offers valuable insights, focusing on the global market landscape, with an emphasis on major industry players such as;
- Caterpillar
- GE
- Kohler
- Cummins
- SLPM
- JDEC
- Zibo Diesel Engine
- Shandong Lvhuan Power Equipment
The Global Biogas Generator Sets Market is Segmented as Follows:
By Feedstock Type
- Agricultural Waste
- Food Waste
- Municipal Solid Waste
- Animal Manure
- Energy Crops
By Technology
- Mesophilic Digestion
- Thermophilic Digestion
- Batch Digestion
- Continuous Digestion
- Co-Digestion
By End-Use Application
- Electricity Generation
- Heat Generation
- Combined Heat and Power (CHP)
- Biomethane Generation
- Transport Fuel
By Size of Installation
- Small Scale (Up to 50 kW)
- Medium Scale (51 kW to 1 MW)
- Large Scale (Above 1 MW)
- Microbial Fuel Cells
By Operational Mode
- Standalone Systems
- Grid-Connected Systems
- Hybrid Systems
- Decentralized Systems
By Region
- North America
- The U.S.
- Canada
- Mexico
- Europe
- France
- The UK
- Spain
- Germany
- Italy
- Rest of Europe
- Asia Pacific
- China
- Japan
- India
- Australia
- South Korea
- Rest of Asia Pacific
- The Middle East & Africa
- Saudi Arabia
- UAE
- Egypt
- Kuwait
- South Africa
- Rest of the Middle East & Africa
- Latin America
- Brazil
- Argentina
- Rest of Latin America
Market Evolution
This section evaluates the market position of the product or service by examining its development pathway and competitive dynamics. It provides a detailed overview of the product's growth stages, including the early (historical) phase, the mid-stage, and anticipated future advancements influenced by innovation and emerging technologies.
Porter’s Analysis
Porter’s Five Forces framework offers a strategic lens for assessing competitor behavior and the positioning of key players in the biogas generator sets industry. This section explores the external factors shaping competitive dynamics and influencing market strategies in the years ahead. The analysis focuses on five critical forces:
- Competitive Rivalry
- Threat of New Entrants
- Threat of Substitutes
- Supplier Bargaining Power
- Buyer Bargaining Power
Value Chain & Market Attractiveness Analysis
The value chain analysis helps businesses optimize operations by mapping the product flow from suppliers to end consumers, identifying opportunities to streamline processes and gain a competitive edge. Segment-wise market attractiveness analysis evaluates key dimensions like product categories, demographics, and regions, assessing growth potential, market size, and profitability. This enables businesses to focus resources on high-potential segments for better ROI and long-term value.
PESTEL Analysis
PESTEL analysis is a powerful tool in market research reports that enhances market understanding by systematically examining the external macro-environmental factors influencing a business or industry. The acronym stands for Political, Economic, Social, Technological, Environmental, and Legal factors. By evaluating these dimensions, PESTEL analysis provides a comprehensive overview of the broader context within which a market operates, helping businesses identify potential opportunities and threats.
- Political factors assess government policies, stability, trade regulations, and political risks that could impact market operations.
- Economic factors examine variables like inflation, exchange rates, economic growth, and consumer spending power to determine market viability.
- Social factors explore cultural trends, demographics, and lifestyle changes that shape consumer behavior and preferences.
- Technological factors evaluate innovation, R&D, and technological advancements affecting product development and operational efficiencies.
- Environmental factors focus on sustainability, climate change impacts, and eco-friendly practices shaping market trends.
- Legal factors address compliance requirements, industry regulations, and intellectual property laws impacting market entry and operations.
Import-Export Analysis & Pricing Analysis
An import-export analysis is vital for market research, revealing global trade dynamics, trends, and opportunities. It examines trade volumes, product categories, and regional competitiveness, offering insights into supply chains and market demand. This section also analyzes past and future pricing trends, helping businesses optimize strategies and enabling consumers to assess product value effectively.
Biogas Generator Sets Market: Company Profiles
The report identifies key players in the biogas generator sets market through a competitive landscape and company profiles, evaluating their offerings, financial performance, strategies, and market positioning. It includes a SWOT analysis of the top 3-5 companies, assessing strengths, weaknesses, opportunities, and threats. The competitive landscape highlights rankings, recent activities (mergers, acquisitions, partnerships, product launches), and regional footprints using the Ace matrix. Customization is available to meet client-specific needs.
Regional & Industry Footprint
This section details the geographic reach, sales networks, and market penetration of companies profiled in the biogas generator sets report, showcasing their operations and distribution across regions. It analyzes the alignment of companies with specific industry verticals, highlighting the industries they serve and the scope of their products and services within those sectors.
Ace Matrix
This section categorizes companies into four distinct groups—Active, Cutting Edge, Innovator, and Emerging—based on their product and business strategies. The evaluation of product strategy focuses on aspects such as the range and depth of offerings, commitment to innovation, product functionalities, and scalability. Key elements like global reach, sector coverage, strategic acquisitions, and long-term growth plans are considered for business strategy. This analysis provides a detailed view of companies' position within the market and highlights their potential for future growth and development.
Research Methodology
The qualitative and quantitative insights for the biogas generator sets market are derived through a multi-faceted research approach, combining input from subject matter experts, primary research, and secondary data sources. Primary research includes gathering critical information via face-to-face or telephonic interviews, surveys, questionnaires, and feedback from industry professionals, key opinion leaders (KOLs), and customers. Regular interviews with industry experts are conducted to deepen the analysis and reinforce the existing data, ensuring a robust and well-rounded market understanding.
Secondary research for this report was carried out by the Market Research Store team, drawing on a variety of authoritative sources, such as:
- Official company websites, annual reports, financial statements, investor presentations, and SEC filings
- Internal and external proprietary databases, as well as relevant patent and regulatory databases
- Government publications, national statistical databases, and industry-specific market reports
- Media coverage, including news articles, press releases, and webcasts about market participants
- Paid industry databases for detailed market insights
Market Research Store conducted in-depth consultations with various key opinion leaders in the industry, including senior executives from top companies and regional leaders from end-user organizations. This effort aimed to gather critical insights on factors such as the market share of dominant brands in specific countries and regions, along with pricing strategies for products and services.
To determine total sales data, the research team conducted primary interviews across multiple countries with influential stakeholders, including:
- Distributors
- Marketing, Brand, and Product Managers
- Procurement and Production Managers
- Sales and Regional Sales Managers, Country Managers
- Technical Specialists
- C-Level Executives
These subject matter experts, with their extensive industry experience, helped validate and refine the findings. For secondary research, data were sourced from a wide range of materials, including online resources, company annual reports, industry publications, research papers, association reports, and government websites. These various sources provide a comprehensive and well-rounded perspective on the market.
Frequently Asked Questions
Table Of Content
List of Tables and Figures Figure Product Picture of Biogas Generator Sets Table Product Specification of Biogas Generator Sets Figure Market Concentration Ratio and Market Maturity Analysis of Biogas Generator Sets Figure Global Biogas Generator Sets Value ($) and Growth Rate from 2014-2024 Table Different Types of Biogas Generator Sets Figure Global Biogas Generator Sets Value ($) Segment by Type from 2014-2019 Figure Single-Fuel BioGas Generator Sets Picture Figure Dual-Fuel BioGas Generator Sets Picture Table Different Applications of Biogas Generator Sets Figure Global Biogas Generator Sets Value ($) Segment by Applications from 2014-2019 Figure Power Industry Picture Figure Agriculture Picture Table Research Regions of Biogas Generator Sets Figure North America Biogas Generator Sets Production Value ($) and Growth Rate (2014-2019) Figure Europe Biogas Generator Sets Production Value ($) and Growth Rate (2014-2019) Table China Biogas Generator Sets Production Value ($) and Growth Rate (2014-2019) Table Japan Biogas Generator Sets Production Value ($) and Growth Rate (2014-2019) Table Middle East & Africa Biogas Generator Sets Production Value ($) and Growth Rate (2014-2019) Table India Biogas Generator Sets Production Value ($) and Growth Rate (2014-2019) Table South America Biogas Generator Sets Production Value ($) and Growth Rate (2014-2019) Table Emerging Countries of Biogas Generator Sets Table Growing Market of Biogas Generator Sets Figure Industry Chain Analysis of Biogas Generator Sets Table Upstream Raw Material Suppliers of Biogas Generator Sets with Contact Information Table Major Players Manufacturing Base and Market Share ($) of Biogas Generator Sets in 2018 Table Major Players Biogas Generator Sets Product Types in 2018 Figure Production Process of Biogas Generator Sets Figure Manufacturing Cost Structure of Biogas Generator Sets Figure Channel Status of Biogas Generator Sets Table Major Distributors of Biogas Generator Sets with Contact Information Table Major Downstream Buyers of Biogas Generator Sets with Contact Information Table Global Biogas Generator Sets Value ($) by Type (2014-2019) Table Global Biogas Generator Sets Value ($) Share by Type (2014-2019) Figure Global Biogas Generator Sets Value ($) Share by Type (2014-2019) Table Global Biogas Generator Sets Production by Type (2014-2019) Table Global Biogas Generator Sets Production Share by Type (2014-2019) Figure Global Biogas Generator Sets Production Share by Type (2014-2019) Figure Global Biogas Generator Sets Value ($) and Growth Rate of Single-Fuel BioGas Generator Sets Figure Global Biogas Generator Sets Value ($) and Growth Rate of Dual-Fuel BioGas Generator Sets Figure Global Biogas Generator Sets Price by Type (2014-2019) Table Global Biogas Generator Sets Consumption by Application (2014-2019) Table Global Biogas Generator Sets Consumption Market Share by Application (2014-2019) Figure Global Biogas Generator Sets Consumption Market Share by Application (2014-2019) Table Downstream Buyers Introduction by Application Figure Global Biogas Generator Sets Consumption and Growth Rate of Power Industry (2014-2019) Figure Global Biogas Generator Sets Consumption and Growth Rate of Agriculture (2014-2019) Table Global Biogas Generator Sets Value ($) by Region (2014-2019) Table Global Biogas Generator Sets Value ($) Market Share by Region (2014-2019) Figure Global Biogas Generator Sets Value ($) Market Share by Region (2014-2019) Table Global Biogas Generator Sets Production by Region (2014-2019) Table Global Biogas Generator Sets Production Market Share by Region (2014-2019) Figure Global Biogas Generator Sets Production Market Share by Region (2014-2019) Table Global Biogas Generator Sets Production, Value ($), Price and Gross Margin (2014-2019) Table North America Biogas Generator Sets Production, Value ($), Price and Gross Margin (2014-2019) Table Europe Biogas Generator Sets Production, Value ($), Price and Gross Margin (2014-2019) Table China Biogas Generator Sets Production, Value ($), Price and Gross Margin (2014-2019) Table Japan Biogas Generator Sets Production, Value ($), Price and Gross Margin (2014-2019) Table Middle East & Africa Biogas Generator Sets Production, Value ($), Price and Gross Margin (2014-2019) Table India Biogas Generator Sets Production, Value ($), Price and Gross Margin (2014-2019) Table South America Biogas Generator Sets Production, Value ($), Price and Gross Margin (2014-2019) Table Global Biogas Generator Sets Consumption by Regions (2014-2019) Figure Global Biogas Generator Sets Consumption Share by Regions (2014-2019) Table North America Biogas Generator Sets Production, Consumption, Export, Import (2014-2019) Table Europe Biogas Generator Sets Production, Consumption, Export, Import (2014-2019) Table China Biogas Generator Sets Production, Consumption, Export, Import (2014-2019) Table Japan Biogas Generator Sets Production, Consumption, Export, Import (2014-2019) Table Middle East & Africa Biogas Generator Sets Production, Consumption, Export, Import (2014-2019) Table India Biogas Generator Sets Production, Consumption, Export, Import (2014-2019) Table South America Biogas Generator Sets Production, Consumption, Export, Import (2014-2019) Figure North America Biogas Generator Sets Production and Growth Rate Analysis Figure North America Biogas Generator Sets Consumption and Growth Rate Analysis Figure North America Biogas Generator Sets SWOT Analysis Figure Europe Biogas Generator Sets Production and Growth Rate Analysis Figure Europe Biogas Generator Sets Consumption and Growth Rate Analysis Figure Europe Biogas Generator Sets SWOT Analysis Figure China Biogas Generator Sets Production and Growth Rate Analysis Figure China Biogas Generator Sets Consumption and Growth Rate Analysis Figure China Biogas Generator Sets SWOT Analysis Figure Japan Biogas Generator Sets Production and Growth Rate Analysis Figure Japan Biogas Generator Sets Consumption and Growth Rate Analysis Figure Japan Biogas Generator Sets SWOT Analysis Figure Middle East & Africa Biogas Generator Sets Production and Growth Rate Analysis Figure Middle East & Africa Biogas Generator Sets Consumption and Growth Rate Analysis Figure Middle East & Africa Biogas Generator Sets SWOT Analysis Figure India Biogas Generator Sets Production and Growth Rate Analysis Figure India Biogas Generator Sets Consumption and Growth Rate Analysis Figure India Biogas Generator Sets SWOT Analysis Figure South America Biogas Generator Sets Production and Growth Rate Analysis Figure South America Biogas Generator Sets Consumption and Growth Rate Analysis Figure South America Biogas Generator Sets SWOT Analysis Figure Top 3 Market Share of Biogas Generator Sets Companies Figure Top 6 Market Share of Biogas Generator Sets Companies Table Mergers, Acquisitions and Expansion Analysis Table Company Profiles Table Product Introduction Table Cummins Production, Value ($), Price, Gross Margin 2014-2019 Figure Cummins Production and Growth Rate Figure Cummins Value ($) Market Share 2014-2019 Figure Cummins Market Share of Biogas Generator Sets Segmented by Region in 2018 Table Company Profiles Table Product Introduction Table Lvhuan Production, Value ($), Price, Gross Margin 2014-2019 Figure Lvhuan Production and Growth Rate Figure Lvhuan Value ($) Market Share 2014-2019 Figure Lvhuan Market Share of Biogas Generator Sets Segmented by Region in 2018 Table Company Profiles Table Product Introduction Table SLPM Production, Value ($), Price, Gross Margin 2014-2019 Figure SLPM Production and Growth Rate Figure SLPM Value ($) Market Share 2014-2019 Figure SLPM Market Share of Biogas Generator Sets Segmented by Region in 2018 Table Company Profiles Table Product Introduction Table Kohler Production, Value ($), Price, Gross Margin 2014-2019 Figure Kohler Production and Growth Rate Figure Kohler Value ($) Market Share 2014-2019 Figure Kohler Market Share of Biogas Generator Sets Segmented by Region in 2018 Table Company Profiles Table Product Introduction Table Zibo Diesel Engine Production, Value ($), Price, Gross Margin 2014-2019 Figure Zibo Diesel Engine Production and Growth Rate Figure Zibo Diesel Engine Value ($) Market Share 2014-2019 Figure Zibo Diesel Engine Market Share of Biogas Generator Sets Segmented by Region in 2018 Table Company Profiles Table Product Introduction Table GE Production, Value ($), Price, Gross Margin 2014-2019 Figure GE Production and Growth Rate Figure GE Value ($) Market Share 2014-2019 Figure GE Market Share of Biogas Generator Sets Segmented by Region in 2018 Table Company Profiles Table Product Introduction Table JDEC Production, Value ($), Price, Gross Margin 2014-2019 Figure JDEC Production and Growth Rate Figure JDEC Value ($) Market Share 2014-2019 Figure JDEC Market Share of Biogas Generator Sets Segmented by Region in 2018 Table Company Profiles Table Product Introduction Table Caterpillar Production, Value ($), Price, Gross Margin 2014-2019 Figure Caterpillar Production and Growth Rate Figure Caterpillar Value ($) Market Share 2014-2019 Figure Caterpillar Market Share of Biogas Generator Sets Segmented by Region in 2018 Table Global Biogas Generator Sets Market Value ($) Forecast, by Type Table Global Biogas Generator Sets Market Volume Forecast, by Type Figure Global Biogas Generator Sets Market Value ($) and Growth Rate Forecast of Single-Fuel BioGas Generator Sets (2019-2024) Figure Global Biogas Generator Sets Market Volume and Growth Rate Forecast of Single-Fuel BioGas Generator Sets (2019-2024) Figure Global Biogas Generator Sets Market Value ($) and Growth Rate Forecast of Dual-Fuel BioGas Generator Sets (2019-2024) Figure Global Biogas Generator Sets Market Volume and Growth Rate Forecast of Dual-Fuel BioGas Generator Sets (2019-2024) Table Global Market Value ($) Forecast by Application (2019-2024) Table Global Market Volume Forecast by Application (2019-2024) Figure Global Biogas Generator Sets Consumption and Growth Rate of Power Industry (2014-2019) Figure Global Biogas Generator Sets Consumption and Growth Rate of Agriculture (2014-2019) Figure Market Value ($) and Growth Rate Forecast of Agriculture (2019-2024) Figure Market Volume and Growth Rate Forecast of Agriculture (2019-2024) Figure North America Market Value ($) and Growth Rate Forecast (2019-2024) Table North America Consumption and Growth Rate Forecast (2019-2024) Figure Europe Market Value ($) and Growth Rate Forecast (2019-2024) Table Europe Consumption and Growth Rate Forecast (2019-2024) Figure China Market Value ($) and Growth Rate Forecast (2019-2024) Table China Consumption and Growth Rate Forecast (2019-2024) Figure Japan Market Value ($) and Growth Rate Forecast (2019-2024) Table Japan Consumption and Growth Rate Forecast (2019-2024) Figure Middle East & Africa Market Value ($) and Growth Rate Forecast (2019-2024) Table Middle East & Africa Consumption and Growth Rate Forecast (2019-2024) Figure India Market Value ($) and Growth Rate Forecast (2019-2024) Table India Consumption and Growth Rate Forecast (2019-2024) Figure South America Market Value ($) and Growth Rate Forecast (2019-2024) Table South America Consumption and Growth Rate Forecast (2019-2024) Figure Industry Resource/Technology/Labor Importance Analysis Table New Entrants SWOT Analysis Table New Project Analysis of Investment Recovery
Inquiry For Buying
Biogas Generator Sets
Request Sample
Biogas Generator Sets