Glaucoma Medications Market Size, Share, and Trends Analysis Report
CAGR :

| Market Size 2023 (Base Year) | USD 1.78 Billion |
| Market Size 2032 (Forecast Year) | USD 2.68 Billion |
| CAGR | 4.2% |
| Forecast Period | 2024 - 2032 |
| Historical Period | 2018 - 2023 |
Glaucoma Medications Market Insights
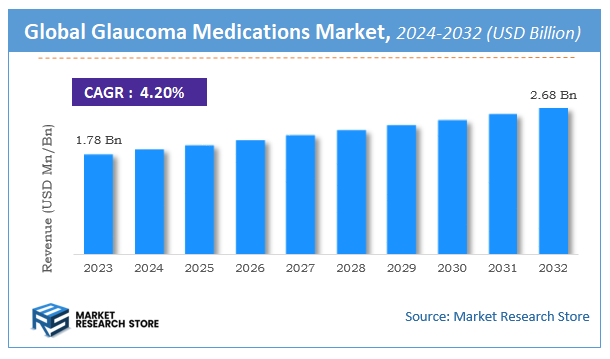
A latest report by Market Research Store estimates that the Global Glaucoma Medications Market was valued at USD 1.78 Billion in 2023 and is expected to reach USD 2.68 Billion by 2032, with a CAGR of 4.2% during the forecast period 2024-2032. The report Glaucoma Medications Market overview, growth factors, restraints, opportunities, segmentation, key developments, competitive landscape, consumer insights, and market growth forecast in terms of value or volume. These structured details offer an all-inclusive market overview, providing valuable insights for investment decisions, business decisions, strategic planning, and competitive analysis.
To Get more Insights, Request a Free Sample
Glaucoma Medications Market: Overview
The growth of the glaucoma medications market is fueled by rising global demand across various industries and applications. The report highlights lucrative opportunities, analyzing cost structures, key segments, emerging trends, regional dynamics, and advancements by leading players to provide comprehensive market insights. The glaucoma medications market report offers a detailed industry analysis from 2024 to 2032, combining quantitative and qualitative insights. It examines key factors such as pricing, market penetration, GDP impact, industry dynamics, major players, consumer behavior, and socio-economic conditions. Structured into multiple sections, the report provides a comprehensive perspective on the market from all angles.
Key sections of the glaucoma medications market report include market segments, outlook, competitive landscape, and company profiles. Market Segments offer in-depth details based on Type, Application, and other relevant classifications to support strategic marketing initiatives. Market Outlook thoroughly analyzes market trends, growth drivers, restraints, opportunities, challenges, Porter’s Five Forces framework, macroeconomic factors, value chain analysis, and pricing trends shaping the market now and in the future. The Competitive Landscape and Company Profiles section highlights major players, their strategies, and market positioning to guide investment and business decisions. The report also identifies innovation trends, new business opportunities, and investment prospects for the forecast period.
Key Highlights:
- As per the analysis shared by our research analyst, the global glaucoma medications market is estimated to grow annually at a CAGR of around 4.2% over the forecast period (2024-2032).
- In terms of revenue, the global glaucoma medications market size was valued at around USD 1.78 Billion in 2023 and is projected to reach USD 2.68 Billion by 2032.
- The market is projected to grow at a significant rate due to rising incidence of glaucoma, growing awareness about eye health, and advancements in medication formulations and treatment efficacy.
- Based on the Type, the Prostaglandin Analogs segment is growing at a high rate and will continue to dominate the global market as per industry projections.
- On the basis of Application, the Open-angle Glaucoma segment is anticipated to command the largest market share.
- Based on region, North America is projected to dominate the global market during the forecast period.
Glaucoma Medications Market: Report Scope
This report thoroughly analyzes the glaucoma medications market, exploring its historical trends, current state, and future projections. The market estimates presented result from a robust research methodology, incorporating primary research, secondary sources, and expert opinions. These estimates are influenced by the prevailing market dynamics as well as key economic, social, and political factors. Furthermore, the report considers the impact of regulations, government expenditures, and advancements in research and development on the market. Both positive and negative shifts are evaluated to ensure a comprehensive and accurate market outlook.
| Report Attributes | Report Details |
|---|---|
| Report Name | Glaucoma Medications Market |
| Market Size in 2023 | USD 1.78 Billion |
| Market Forecast in 2032 | USD 2.68 Billion |
| Growth Rate | CAGR of 4.2% |
| Number of Pages | 186 |
| Key Companies Covered | Pfizer, Novartis, bausch Lomb, Laboratoire Riva, Jamp Pharma, Fresenius, Teva Pharmaceutical?, SANDOZ, Greenstone, Mylan, GE Medical, Mint Pharmaceuticals, Laboratoires Thea, Taj Pharmaceuticals, Actavis, APOTEX, Sun Pharma |
| Segments Covered | By Type, By Application, and By Region |
| Regions Covered | North America, Europe, Asia Pacific (APAC), Latin America, Middle East, and Africa (MEA) |
| Base Year | 2023 |
| Historical Year | 2018 to 2023 |
| Forecast Year | 2024 to 2032 |
| Customization Scope | Avail customized purchase options to meet your exact research needs. Request For Customization |
Glaucoma Medications Market: Dynamics
Key Growth Drivers
The Glaucoma Medications market in Pune, Maharashtra, India, is experiencing growth driven by the increasing prevalence of glaucoma due to the aging population and rising awareness about the disease. Government initiatives and awareness programs aimed at early detection and treatment of glaucoma are also contributing significantly. Furthermore, advancements in diagnostic techniques are leading to earlier diagnosis and a larger patient pool requiring medication. The rising disposable incomes in urban areas like Pune allow more individuals to afford treatment and regular medication. The availability of a wider range of drug classes, including prostaglandin analogs, beta-blockers, and combination therapies, provides more treatment options for patients with varying conditions and preferences.
Restraints
Despite the growing need, the Glaucoma Medications market in Pune and India faces certain restraints. The high cost of some advanced glaucoma medications, particularly branded and novel therapies, can be a significant barrier for many patients, especially in lower-income segments. Issues with patient compliance and adherence to long-term medication regimens are a major challenge in glaucoma management. Furthermore, limited access to specialized ophthalmologists and healthcare facilities in rural and semi-urban areas can hinder timely diagnosis and treatment initiation. The availability of generic alternatives for older medications can put price pressure on branded drugs, although it also improves affordability for a larger population. Side effects associated with certain glaucoma medications can also lead to discontinuation of treatment by some patients.
Opportunities
The Glaucoma Medications market in Pune and India presents numerous opportunities for expansion. The increasing focus on developing more patient-friendly drug delivery systems, such as preservative-free formulations and sustained-release options, can improve compliance. The growing potential for telemedicine and online pharmacies can enhance access to medications and consultations, particularly in remote areas. Furthermore, increasing research and development activities by pharmaceutical companies are leading to the introduction of novel therapeutic agents with improved efficacy and fewer side effects. The rising emphasis on early diagnosis and proactive management of glaucoma creates a larger market for preventative and early-stage treatment options. Government support for affordable healthcare and potential subsidies for essential glaucoma medications can improve accessibility for economically weaker sections.
Challenges
The Glaucoma Medications market in Pune and India faces challenges related to ensuring early diagnosis and treatment initiation to prevent irreversible vision loss. Improving patient education and awareness about the importance of adherence to long-term medication is crucial. Addressing the affordability issues associated with glaucoma treatment through cost-effective generic options and potential financial assistance programs is essential. Furthermore, strengthening the healthcare infrastructure to ensure wider access to ophthalmological care and medication dispensing is necessary. Managing the potential for drug recalls and ensuring the quality and safety of available medications are ongoing challenges for regulatory bodies and pharmaceutical companies. Finally, competing with alternative or complementary therapies and ensuring evidence-based treatment approaches requires continuous medical education and awareness among healthcare professionals.
Glaucoma Medications Market: Segmentation Insights
The global glaucoma medications market is segmented based on Type, Application, and Region. All the segments of the glaucoma medications market have been analyzed based on present & future trends and the market is estimated from 2024 to 2032.
Based on Type, the global glaucoma medications market is divided into Prostaglandin Analogs, Beta Blockers, Alpha Agonists, Carbonic Anhydrase Inhibitors, Combined Medications.
On the basis of Application, the global glaucoma medications market is bifurcated into Open-angle Glaucoma, Closed-angle Glaucoma.
Glaucoma Medications Market: Regional Insights
The glaucoma medications market is currently dominated by North America, which held 42% of global market share ($2.1 billion) in 2023, according to pharmaceutical industry reports. This leadership stems from the region's high glaucoma prevalence (affecting over 3 million Americans), advanced healthcare infrastructure, and early adoption of innovative drug formulations like Rho kinase inhibitors and sustained-release implants. Europe follows with 28% market share, driven by Germany and France's aging populations and robust reimbursement policies.
The Asia-Pacific region shows the fastest growth (9.3% CAGR projected for 2024-2030), particularly in Japan (world's highest glaucoma medication prices) and India (expanding diagnostic rates). However, North America will maintain dominance through 2030 due to increasing combination therapy usage, with the U.S. alone accounting for 75% of regional sales, supported by Medicare coverage and strong R&D investment from major ophthalmic pharmaceutical companies.
Glaucoma Medications Market: Competitive Landscape
The glaucoma medications market report offers a thorough analysis of both established and emerging players within the market. It includes a detailed list of key companies, categorized based on the types of products they offer and other relevant factors. The report also highlights the market entry year for each player, providing further context for the research analysis.
The "Global Glaucoma Medications Market" study offers valuable insights, focusing on the global market landscape, with an emphasis on major industry players such as;
- Pfizer
- Novartis
- bausch Lomb
- Laboratoire Riva
- Jamp Pharma
- Fresenius
- Teva Pharmaceutical?
- SANDOZ
- Greenstone
- Mylan
- GE Medical
- Mint Pharmaceuticals
- Laboratoires Thea
- Taj Pharmaceuticals
- Actavis
- APOTEX
- Sun Pharma
The Global Glaucoma Medications Market is Segmented as Follows:
By Type
- Prostaglandin Analogs
- Beta Blockers
- Alpha Agonists
- Carbonic Anhydrase Inhibitors
- Combined Medications
By Application
- Open-angle Glaucoma
- Closed-angle Glaucoma
By Region
- North America
- The U.S.
- Canada
- Mexico
- Europe
- France
- The UK
- Spain
- Germany
- Italy
- Rest of Europe
- Asia Pacific
- China
- Japan
- India
- Australia
- South Korea
- Rest of Asia Pacific
- The Middle East & Africa
- Saudi Arabia
- UAE
- Egypt
- Kuwait
- South Africa
- Rest of the Middle East & Africa
- Latin America
- Brazil
- Argentina
- Rest of Latin America
Market Evolution
This section evaluates the market position of the product or service by examining its development pathway and competitive dynamics. It provides a detailed overview of the product's growth stages, including the early (historical) phase, the mid-stage, and anticipated future advancements influenced by innovation and emerging technologies.
Porter’s Analysis
Porter’s Five Forces framework offers a strategic lens for assessing competitor behavior and the positioning of key players in the glaucoma medications industry. This section explores the external factors shaping competitive dynamics and influencing market strategies in the years ahead. The analysis focuses on five critical forces:
- Competitive Rivalry
- Threat of New Entrants
- Threat of Substitutes
- Supplier Bargaining Power
- Buyer Bargaining Power
Value Chain & Market Attractiveness Analysis
The value chain analysis helps businesses optimize operations by mapping the product flow from suppliers to end consumers, identifying opportunities to streamline processes and gain a competitive edge. Segment-wise market attractiveness analysis evaluates key dimensions like product categories, demographics, and regions, assessing growth potential, market size, and profitability. This enables businesses to focus resources on high-potential segments for better ROI and long-term value.
PESTEL Analysis
PESTEL analysis is a powerful tool in market research reports that enhances market understanding by systematically examining the external macro-environmental factors influencing a business or industry. The acronym stands for Political, Economic, Social, Technological, Environmental, and Legal factors. By evaluating these dimensions, PESTEL analysis provides a comprehensive overview of the broader context within which a market operates, helping businesses identify potential opportunities and threats.
- Political factors assess government policies, stability, trade regulations, and political risks that could impact market operations.
- Economic factors examine variables like inflation, exchange rates, economic growth, and consumer spending power to determine market viability.
- Social factors explore cultural trends, demographics, and lifestyle changes that shape consumer behavior and preferences.
- Technological factors evaluate innovation, R&D, and technological advancements affecting product development and operational efficiencies.
- Environmental factors focus on sustainability, climate change impacts, and eco-friendly practices shaping market trends.
- Legal factors address compliance requirements, industry regulations, and intellectual property laws impacting market entry and operations.
Import-Export Analysis & Pricing Analysis
An import-export analysis is vital for market research, revealing global trade dynamics, trends, and opportunities. It examines trade volumes, product categories, and regional competitiveness, offering insights into supply chains and market demand. This section also analyzes past and future pricing trends, helping businesses optimize strategies and enabling consumers to assess product value effectively.
Glaucoma Medications Market: Company Profiles
The report identifies key players in the glaucoma medications market through competitive landscape and company profiles, evaluating their offerings, financial performance, strategies, and market positioning. It includes a SWOT analysis of the top 3-5 companies, assessing strengths, weaknesses, opportunities, and threats. The competitive landscape highlights rankings, recent activities (mergers, acquisitions, partnerships, product launches), and regional footprints using the Ace matrix. Customization is available to meet client-specific needs.
Regional & Industry Footprint
This section details the geographic reach, sales networks, and market penetration of companies profiled in the glaucoma medications report, showcasing their operations and distribution across regions. It analyzes the alignment of companies with specific industry verticals, highlighting the industries they serve and the scope of their products and services within those sectors.
Ace Matrix
This section categorizes companies into four distinct groups—Active, Cutting Edge, Innovator, and Emerging—based on their product and business strategies. The evaluation of product strategy focuses on aspects such as the range and depth of offerings, commitment to innovation, product functionalities, and scalability. Key elements like global reach, sector coverage, strategic acquisitions, and long-term growth plans are considered for business strategy. This analysis provides a detailed view of companies' position within the market and highlights their potential for future growth and development.
Research Methodology
The qualitative and quantitative insights for the glaucoma medications market are derived through a multi-faceted research approach, combining input from subject matter experts, primary research, and secondary data sources. Primary research includes gathering critical information via face-to-face or telephonic interviews, surveys, questionnaires, and feedback from industry professionals, key opinion leaders (KOLs), and customers. Regular interviews with industry experts are conducted to deepen the analysis and reinforce the existing data, ensuring a robust and well-rounded market understanding.
Secondary research for this report was carried out by the Market Research Store team, drawing on a variety of authoritative sources, such as:
- Official company websites, annual reports, financial statements, investor presentations, and SEC filings
- Internal and external proprietary databases, as well as relevant patent and regulatory databases
- Government publications, national statistical databases, and industry-specific market reports
- Media coverage, including news articles, press releases, and webcasts about market participants
- Paid industry databases for detailed market insights
Market Research Store conducted in-depth consultations with various key opinion leaders in the industry, including senior executives from top companies and regional leaders from end-user organizations. This effort aimed to gather critical insights on factors such as the market share of dominant brands in specific countries and regions, along with pricing strategies for products and services.
To determine total sales data, the research team conducted primary interviews across multiple countries with influential stakeholders, including:
- Distributors
- Marketing, Brand, and Product Managers
- Procurement and Production Managers
- Sales and Regional Sales Managers, Country Managers
- Technical Specialists
- C-Level Executives
These subject matter experts, with their extensive industry experience, helped validate and refine the findings. For secondary research, data was sourced from a wide range of materials, including online resources, company annual reports, industry publications, research papers, association reports, and government websites. These various sources provide a comprehensive and well-rounded perspective on the market.
Frequently Asked Questions
Table Of Content
List of Tables and Figures Figure Product Picture of Glaucoma Medications Table Product Specification of Glaucoma Medications Figure Market Concentration Ratio and Market Maturity Analysis of Glaucoma Medications Figure Global Glaucoma Medications Value ($) and Growth Rate from 2014-2024 Table Different Types of Glaucoma Medications Figure Global Glaucoma Medications Value ($) Segment by Type from 2014-2019 Figure Prostaglandin Analogs Picture Figure Beta Blockers Picture Figure Alpha Agonists Picture Figure Carbonic Anhydrase Inhibitors Picture Figure Combined Medications Picture Table Different Applications of Glaucoma Medications Figure Global Glaucoma Medications Value ($) Segment by Applications from 2014-2019 Figure Open-angle Glaucoma Picture Figure Closed-angle Glaucoma Picture Table Research Regions of Glaucoma Medications Figure North America Glaucoma Medications Production Value ($) and Growth Rate (2014-2019) Figure Europe Glaucoma Medications Production Value ($) and Growth Rate (2014-2019) Table China Glaucoma Medications Production Value ($) and Growth Rate (2014-2019) Table Japan Glaucoma Medications Production Value ($) and Growth Rate (2014-2019) Table Middle East & Africa Glaucoma Medications Production Value ($) and Growth Rate (2014-2019) Table India Glaucoma Medications Production Value ($) and Growth Rate (2014-2019) Table South America Glaucoma Medications Production Value ($) and Growth Rate (2014-2019) Table Emerging Countries of Glaucoma Medications Table Growing Market of Glaucoma Medications Figure Industry Chain Analysis of Glaucoma Medications Table Upstream Raw Material Suppliers of Glaucoma Medications with Contact Information Table Major Players Manufacturing Base and Market Share ($) of Glaucoma Medications in 2018 Table Major Players Glaucoma Medications Product Types in 2018 Figure Production Process of Glaucoma Medications Figure Manufacturing Cost Structure of Glaucoma Medications Figure Channel Status of Glaucoma Medications Table Major Distributors of Glaucoma Medications with Contact Information Table Major Downstream Buyers of Glaucoma Medications with Contact Information Table Global Glaucoma Medications Value ($) by Type (2014-2019) Table Global Glaucoma Medications Value ($) Share by Type (2014-2019) Figure Global Glaucoma Medications Value ($) Share by Type (2014-2019) Table Global Glaucoma Medications Production by Type (2014-2019) Table Global Glaucoma Medications Production Share by Type (2014-2019) Figure Global Glaucoma Medications Production Share by Type (2014-2019) Figure Global Glaucoma Medications Value ($) and Growth Rate of Prostaglandin Analogs Figure Global Glaucoma Medications Value ($) and Growth Rate of Beta Blockers Figure Global Glaucoma Medications Value ($) and Growth Rate of Alpha Agonists Figure Global Glaucoma Medications Value ($) and Growth Rate of Carbonic Anhydrase Inhibitors Figure Global Glaucoma Medications Value ($) and Growth Rate of Combined Medications Figure Global Glaucoma Medications Price by Type (2014-2019) Table Global Glaucoma Medications Consumption by Application (2014-2019) Table Global Glaucoma Medications Consumption Market Share by Application (2014-2019) Figure Global Glaucoma Medications Consumption Market Share by Application (2014-2019) Table Downstream Buyers Introduction by Application Figure Global Glaucoma Medications Consumption and Growth Rate of Open-angle Glaucoma (2014-2019) Figure Global Glaucoma Medications Consumption and Growth Rate of Closed-angle Glaucoma (2014-2019) Table Global Glaucoma Medications Value ($) by Region (2014-2019) Table Global Glaucoma Medications Value ($) Market Share by Region (2014-2019) Figure Global Glaucoma Medications Value ($) Market Share by Region (2014-2019) Table Global Glaucoma Medications Production by Region (2014-2019) Table Global Glaucoma Medications Production Market Share by Region (2014-2019) Figure Global Glaucoma Medications Production Market Share by Region (2014-2019) Table Global Glaucoma Medications Production, Value ($), Price and Gross Margin (2014-2019) Table North America Glaucoma Medications Production, Value ($), Price and Gross Margin (2014-2019) Table Europe Glaucoma Medications Production, Value ($), Price and Gross Margin (2014-2019) Table China Glaucoma Medications Production, Value ($), Price and Gross Margin (2014-2019) Table Japan Glaucoma Medications Production, Value ($), Price and Gross Margin (2014-2019) Table Middle East & Africa Glaucoma Medications Production, Value ($), Price and Gross Margin (2014-2019) Table India Glaucoma Medications Production, Value ($), Price and Gross Margin (2014-2019) Table South America Glaucoma Medications Production, Value ($), Price and Gross Margin (2014-2019) Table Global Glaucoma Medications Consumption by Regions (2014-2019) Figure Global Glaucoma Medications Consumption Share by Regions (2014-2019) Table North America Glaucoma Medications Production, Consumption, Export, Import (2014-2019) Table Europe Glaucoma Medications Production, Consumption, Export, Import (2014-2019) Table China Glaucoma Medications Production, Consumption, Export, Import (2014-2019) Table Japan Glaucoma Medications Production, Consumption, Export, Import (2014-2019) Table Middle East & Africa Glaucoma Medications Production, Consumption, Export, Import (2014-2019) Table India Glaucoma Medications Production, Consumption, Export, Import (2014-2019) Table South America Glaucoma Medications Production, Consumption, Export, Import (2014-2019) Figure North America Glaucoma Medications Production and Growth Rate Analysis Figure North America Glaucoma Medications Consumption and Growth Rate Analysis Figure North America Glaucoma Medications SWOT Analysis Figure Europe Glaucoma Medications Production and Growth Rate Analysis Figure Europe Glaucoma Medications Consumption and Growth Rate Analysis Figure Europe Glaucoma Medications SWOT Analysis Figure China Glaucoma Medications Production and Growth Rate Analysis Figure China Glaucoma Medications Consumption and Growth Rate Analysis Figure China Glaucoma Medications SWOT Analysis Figure Japan Glaucoma Medications Production and Growth Rate Analysis Figure Japan Glaucoma Medications Consumption and Growth Rate Analysis Figure Japan Glaucoma Medications SWOT Analysis Figure Middle East & Africa Glaucoma Medications Production and Growth Rate Analysis Figure Middle East & Africa Glaucoma Medications Consumption and Growth Rate Analysis Figure Middle East & Africa Glaucoma Medications SWOT Analysis Figure India Glaucoma Medications Production and Growth Rate Analysis Figure India Glaucoma Medications Consumption and Growth Rate Analysis Figure India Glaucoma Medications SWOT Analysis Figure South America Glaucoma Medications Production and Growth Rate Analysis Figure South America Glaucoma Medications Consumption and Growth Rate Analysis Figure South America Glaucoma Medications SWOT Analysis Figure Top 3 Market Share of Glaucoma Medications Companies Figure Top 6 Market Share of Glaucoma Medications Companies Table Mergers, Acquisitions and Expansion Analysis Table Company Profiles Table Product Introduction Table Laboratoires Thea Production, Value ($), Price, Gross Margin 2014-2019 Figure Laboratoires Thea Production and Growth Rate Figure Laboratoires Thea Value ($) Market Share 2014-2019 Figure Laboratoires Thea Market Share of Glaucoma Medications Segmented by Region in 2018 Table Company Profiles Table Product Introduction Table Actavis Production, Value ($), Price, Gross Margin 2014-2019 Figure Actavis Production and Growth Rate Figure Actavis Value ($) Market Share 2014-2019 Figure Actavis Market Share of Glaucoma Medications Segmented by Region in 2018 Table Company Profiles Table Product Introduction Table APOTEX Production, Value ($), Price, Gross Margin 2014-2019 Figure APOTEX Production and Growth Rate Figure APOTEX Value ($) Market Share 2014-2019 Figure APOTEX Market Share of Glaucoma Medications Segmented by Region in 2018 Table Company Profiles Table Product Introduction Table GE Medical Production, Value ($), Price, Gross Margin 2014-2019 Figure GE Medical Production and Growth Rate Figure GE Medical Value ($) Market Share 2014-2019 Figure GE Medical Market Share of Glaucoma Medications Segmented by Region in 2018 Table Company Profiles Table Product Introduction Table Mylan Production, Value ($), Price, Gross Margin 2014-2019 Figure Mylan Production and Growth Rate Figure Mylan Value ($) Market Share 2014-2019 Figure Mylan Market Share of Glaucoma Medications Segmented by Region in 2018 Table Company Profiles Table Product Introduction Table Taj Pharmaceuticals Production, Value ($), Price, Gross Margin 2014-2019 Figure Taj Pharmaceuticals Production and Growth Rate Figure Taj Pharmaceuticals Value ($) Market Share 2014-2019 Figure Taj Pharmaceuticals Market Share of Glaucoma Medications Segmented by Region in 2018 Table Company Profiles Table Product Introduction Table Teva Pharmaceutical Production, Value ($), Price, Gross Margin 2014-2019 Figure Teva Pharmaceutical Production and Growth Rate Figure Teva Pharmaceutical Value ($) Market Share 2014-2019 Figure Teva Pharmaceutical Market Share of Glaucoma Medications Segmented by Region in 2018 Table Company Profiles Table Product Introduction Table Jamp Pharma Production, Value ($), Price, Gross Margin 2014-2019 Figure Jamp Pharma Production and Growth Rate Figure Jamp Pharma Value ($) Market Share 2014-2019 Figure Jamp Pharma Market Share of Glaucoma Medications Segmented by Region in 2018 Table Company Profiles Table Product Introduction Table Greenstone Production, Value ($), Price, Gross Margin 2014-2019 Figure Greenstone Production and Growth Rate Figure Greenstone Value ($) Market Share 2014-2019 Figure Greenstone Market Share of Glaucoma Medications Segmented by Region in 2018 Table Company Profiles Table Product Introduction Table Mint Pharmaceuticals Production, Value ($), Price, Gross Margin 2014-2019 Figure Mint Pharmaceuticals Production and Growth Rate Figure Mint Pharmaceuticals Value ($) Market Share 2014-2019 Figure Mint Pharmaceuticals Market Share of Glaucoma Medications Segmented by Region in 2018 Table Company Profiles Table Product Introduction Table SANDOZ Production, Value ($), Price, Gross Margin 2014-2019 Figure SANDOZ Production and Growth Rate Figure SANDOZ Value ($) Market Share 2014-2019 Figure SANDOZ Market Share of Glaucoma Medications Segmented by Region in 2018 Table Company Profiles Table Product Introduction Table Bausch + Lomb Production, Value ($), Price, Gross Margin 2014-2019 Figure Bausch + Lomb Production and Growth Rate Figure Bausch + Lomb Value ($) Market Share 2014-2019 Figure Bausch + Lomb Market Share of Glaucoma Medications Segmented by Region in 2018 Table Company Profiles Table Product Introduction Table Fresenius Production, Value ($), Price, Gross Margin 2014-2019 Figure Fresenius Production and Growth Rate Figure Fresenius Value ($) Market Share 2014-2019 Figure Fresenius Market Share of Glaucoma Medications Segmented by Region in 2018 Table Company Profiles Table Product Introduction Table Sun Pharma Production, Value ($), Price, Gross Margin 2014-2019 Figure Sun Pharma Production and Growth Rate Figure Sun Pharma Value ($) Market Share 2014-2019 Figure Sun Pharma Market Share of Glaucoma Medications Segmented by Region in 2018 Table Company Profiles Table Product Introduction Table Laboratoire Riva Production, Value ($), Price, Gross Margin 2014-2019 Figure Laboratoire Riva Production and Growth Rate Figure Laboratoire Riva Value ($) Market Share 2014-2019 Figure Laboratoire Riva Market Share of Glaucoma Medications Segmented by Region in 2018 Table Company Profiles Table Product Introduction Table Pfizer Production, Value ($), Price, Gross Margin 2014-2019 Figure Pfizer Production and Growth Rate Figure Pfizer Value ($) Market Share 2014-2019 Figure Pfizer Market Share of Glaucoma Medications Segmented by Region in 2018 Table Company Profiles Table Product Introduction Table Novartis Production, Value ($), Price, Gross Margin 2014-2019 Figure Novartis Production and Growth Rate Figure Novartis Value ($) Market Share 2014-2019 Figure Novartis Market Share of Glaucoma Medications Segmented by Region in 2018 Table Global Glaucoma Medications Market Value ($) Forecast, by Type Table Global Glaucoma Medications Market Volume Forecast, by Type Figure Global Glaucoma Medications Market Value ($) and Growth Rate Forecast of Prostaglandin Analogs (2019-2024) Figure Global Glaucoma Medications Market Volume and Growth Rate Forecast of Prostaglandin Analogs (2019-2024) Figure Global Glaucoma Medications Market Value ($) and Growth Rate Forecast of Beta Blockers (2019-2024) Figure Global Glaucoma Medications Market Volume and Growth Rate Forecast of Beta Blockers (2019-2024) Figure Global Glaucoma Medications Market Value ($) and Growth Rate Forecast of Alpha Agonists (2019-2024) Figure Global Glaucoma Medications Market Volume and Growth Rate Forecast of Alpha Agonists (2019-2024) Figure Global Glaucoma Medications Market Value ($) and Growth Rate Forecast of Carbonic Anhydrase Inhibitors (2019-2024) Figure Global Glaucoma Medications Market Volume and Growth Rate Forecast of Carbonic Anhydrase Inhibitors (2019-2024) Figure Global Glaucoma Medications Market Value ($) and Growth Rate Forecast of Combined Medications (2019-2024) Figure Global Glaucoma Medications Market Volume and Growth Rate Forecast of Combined Medications (2019-2024) Table Global Market Value ($) Forecast by Application (2019-2024) Table Global Market Volume Forecast by Application (2019-2024) Figure Global Glaucoma Medications Consumption and Growth Rate of Open-angle Glaucoma (2014-2019) Figure Global Glaucoma Medications Consumption and Growth Rate of Closed-angle Glaucoma (2014-2019) Figure Market Value ($) and Growth Rate Forecast of Closed-angle Glaucoma (2019-2024) Figure Market Volume and Growth Rate Forecast of Closed-angle Glaucoma (2019-2024) Figure North America Market Value ($) and Growth Rate Forecast (2019-2024) Table North America Consumption and Growth Rate Forecast (2019-2024) Figure Europe Market Value ($) and Growth Rate Forecast (2019-2024) Table Europe Consumption and Growth Rate Forecast (2019-2024) Figure China Market Value ($) and Growth Rate Forecast (2019-2024) Table China Consumption and Growth Rate Forecast (2019-2024) Figure Japan Market Value ($) and Growth Rate Forecast (2019-2024) Table Japan Consumption and Growth Rate Forecast (2019-2024) Figure Middle East & Africa Market Value ($) and Growth Rate Forecast (2019-2024) Table Middle East & Africa Consumption and Growth Rate Forecast (2019-2024) Figure India Market Value ($) and Growth Rate Forecast (2019-2024) Table India Consumption and Growth Rate Forecast (2019-2024) Figure South America Market Value ($) and Growth Rate Forecast (2019-2024) Table South America Consumption and Growth Rate Forecast (2019-2024) Figure Industry Resource/Technology/Labor Importance Analysis Table New Entrants SWOT Analysis Table New Project Analysis of Investment Recovery
Inquiry For Buying
Glaucoma Medications
Request Sample
Glaucoma Medications