Luxury Furniture Market Size, Share, and Trends Analysis Report
CAGR :

| Market Size 2024 (Base Year) | USD 28.75 Billion |
| Market Size 2032 (Forecast Year) | USD 41.04 Billion |
| CAGR | 4.55% |
| Forecast Period | 2025 - 2032 |
| Historical Period | 2020 - 2024 |
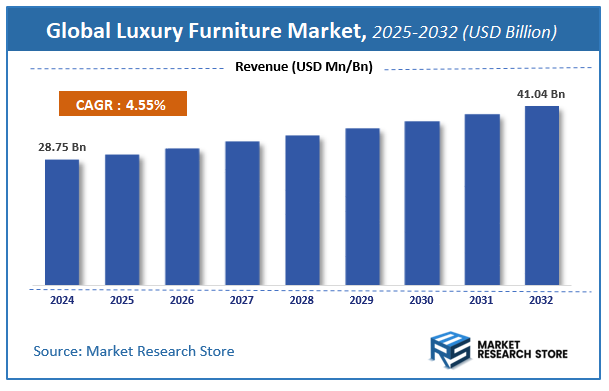
Market Research Store has published a report on the global luxury furniture market, estimating its value at USD 28.75 Billion in 2024, with projections indicating it will reach USD 41.04 Billion by the end of 2032. The market is expected to expand at a compound annual growth rate (CAGR) of around 4.55% over the forecast period. The report examines the factors driving market growth, the obstacles that could hinder this expansion, and the opportunities that may emerge in the luxury furniture industry. Additionally, it offers a detailed analysis of how these elements will affect demand dynamics and market performance throughout the forecast period.
To Get more Insights, Request a Free Sample
Luxury Furniture Market: Overview
The growth of the luxury furniture market is fueled by rising global demand across various industries and applications. The report highlights lucrative opportunities, analyzing cost structures, key segments, emerging trends, regional dynamics, and advancements by leading players to provide comprehensive market insights. The luxury furniture market report offers a detailed industry analysis from 2024 to 2032, combining quantitative and qualitative insights. It examines key factors such as pricing, market penetration, GDP impact, industry dynamics, major players, consumer behavior, and socio-economic conditions. Structured into multiple sections, the report provides a comprehensive perspective on the market from all angles.
Key sections of the luxury furniture market report include market segments, outlook, competitive landscape, and company profiles. Market Segments offer in-depth details based on Raw Material, End-User, Distribution Channel, and other relevant classifications to support strategic marketing initiatives. Market Outlook thoroughly analyzes market trends, growth drivers, restraints, opportunities, challenges, Porter’s Five Forces framework, macroeconomic factors, value chain analysis, and pricing trends shaping the market now and in the future. The Competitive Landscape and Company Profiles section highlights major players, their strategies, and market positioning to guide investment and business decisions. The report also identifies innovation trends, new business opportunities, and investment prospects for the forecast period.
Key Highlights:
- As per the analysis shared by our research analyst, the global luxury furniture market is estimated to grow annually at a CAGR of around 4.55% over the forecast period (2025-2032).
- In terms of revenue, the global luxury furniture market size was valued at around USD 28.75 Billion in 2024 and is projected to reach USD 41.04 Billion by 2032.
- The market is projected to grow at a significant rate due to Increasing disposable incomes, growing preference for premium home interiors, and rising demand for customized and designer furniture are driving the Luxury Furniture market.
- Based on the Raw Material, the Wood segment is growing at a high rate and will continue to dominate the global market as per industry projections.
- On the basis of End-User, the Residential segment is anticipated to command the largest market share.
- In terms of Distribution Channel, the Online segment is projected to lead the global market.
- Based on region, North America is projected to dominate the global market during the forecast period.
Luxury Furniture Market: Report Scope
This report thoroughly analyzes the luxury furniture market, exploring its historical trends, current state, and future projections. The market estimates presented result from a robust research methodology, incorporating primary research, secondary sources, and expert opinions. These estimates are influenced by the prevailing market dynamics as well as key economic, social, and political factors. Furthermore, the report considers the impact of regulations, government expenditures, and advancements in research and development on the market. Both positive and negative shifts are evaluated to ensure a comprehensive and accurate market outlook.
| Report Attributes | Report Details |
|---|---|
| Report Name | Luxury Furniture Market |
| Market Size in 2024 | USD 28.75 Billion |
| Market Forecast in 2032 | USD 41.04 Billion |
| Growth Rate | CAGR of 4.55% |
| Number of Pages | 248 |
| Key Companies Covered | Duresta, Mobelcenter, Valderamobili, Giovanni Visentin, SCAVOLINI S.P.A., LAURA ASHLEY HOLDINGS PLC, Iola Modern, Nella Vetrina, Henredon |
| Segments Covered | By Raw Material, By End-User, By Distribution Channel, and By Region |
| Regions Covered | North America, Europe, Asia Pacific (APAC), Latin America, The Middle East and Africa (MEA) |
| Base Year | 2024 |
| Historical Year | 2018 to 2024 |
| Forecast Year | 2025 to 2032 |
| Customization Scope | Avail customized purchase options to meet your exact research needs. Request For Customization |
Luxury Furniture Market: Dynamics
Key Growth Drivers :
The luxury furniture market is primarily driven by rising disposable incomes, particularly among high-net-worth individuals and a growing middle class in emerging economies. This increased spending power fuels demand for high-quality, aesthetically pleasing, and exclusive home and office environments. Rapid urbanization and the expansion of the real estate sector, including new luxury residential projects and high-end commercial spaces, are also significant catalysts. The rising influence of social media and interior design trends has made consumers more conscious of home aesthetics, prompting them to invest in unique, branded, and designer furniture pieces that reflect their personal style and status. Furthermore, the increasing trend of home renovation and a focus on creating comfortable, high-end living spaces, especially post-pandemic, are contributing to market growth.
Restraints :
Despite its strong growth, the luxury furniture market faces several notable restraints. One major challenge is the high initial cost of luxury products, which can limit the consumer base to a small, affluent demographic. Fluctuations in the price of raw materials, such as premium woods, metals, and fine leathers, can also impact production costs and market prices. Additionally, the industry is vulnerable to economic downturns and geopolitical uncertainties, which can lead to reduced consumer spending on non-essential, high-value goods. The market also faces stiff competition from a growing number of "affordable luxury" and high-quality mass-market furniture brands that offer similar aesthetics at lower price points.
Opportunities :
The luxury furniture market has significant opportunities for expansion, particularly through digitalization and a focus on sustainability. The increasing adoption of e-commerce and innovative technologies like Augmented Reality (AR) and Virtual Reality (VR) allows brands to provide immersive online shopping experiences, enabling customers to visualize products in their spaces. This can help overcome the traditional preference for in-store purchases of high-value items. The growing demand for eco-friendly and sustainable products is another major opportunity. Brands that use ethically sourced, recycled, or environmentally friendly materials and production methods can attract a new generation of conscious consumers and gain a competitive edge. The expansion into new geographic regions, especially in Asia-Pacific and the Middle East, where wealth and urbanization are rapidly increasing, also presents a lucrative market.
Challenges :
The luxury furniture market is not without its challenges. Maintaining exclusivity and brand integrity in a rapidly expanding and increasingly digital market is a key concern. As brands become more accessible, there is a risk of overexposure, which can dilute the perception of luxury and uniqueness. Supply chain complexities, especially for custom-made or rare-material furniture, can lead to production delays and logistical hurdles. The market is also challenged by the need to continuously innovate and adapt to rapidly changing design trends and consumer preferences, requiring significant investment in research and development. Finally, the ability to deliver a consistent, high-end customer experience, both online and offline, is crucial but can be difficult to scale globally.
Luxury Furniture Market: Segmentation Insights
The global luxury furniture market is segmented based on Raw Material, End-User, Distribution Channel, and Region. All the segments of the luxury furniture market have been analyzed based on present & future trends and the market is estimated from 2024 to 2032.
Based on Raw Material, the global luxury furniture market is divided into Wood, Metal, Plastic, Others.
On the basis of End-User, the global luxury furniture market is bifurcated into Residential, Commercial.
In terms of Distribution Channel, the global luxury furniture market is categorized into Online, Offline.
Luxury Furniture Market: Regional Insights
Europe is the dominant region in the global luxury furniture market, holding the largest revenue share. This leadership is anchored by Italy, France, and the United Kingdom, which are renowned for their heritage of craftsmanship, iconic design houses (e.g., Poltrona Frau, Roche Bobois), and association with timeless artistry.
The region's dominance is driven by high disposable incomes, a strong culture of interior design, and status-driven consumption, particularly within the bespoke and ultra-luxury segments. While the Asia-Pacific region is the fastest-growing market due to rising wealth, Europe's unparalleled brand legacy, concentration of high-net-worth individuals, and control of the luxury supply chain solidify its position as the established global leader.
Luxury Furniture Market: Competitive Landscape
The luxury furniture market report offers a thorough analysis of both established and emerging players within the market. It includes a detailed list of key companies, categorized based on the types of products they offer and other relevant factors. The report also highlights the market entry year for each player, providing further context for the research analysis.
The "Global Luxury Furniture Market" study offers valuable insights, focusing on the global market landscape, with an emphasis on major industry players such as;
- Duresta
- Mobelcenter
- Valderamobili
- Giovanni Visentin
- SCAVOLINI S.P.A.
- LAURA ASHLEY HOLDINGS PLC
- Iola Modern
- Nella Vetrina
- Henredon
The Global Luxury Furniture Market is Segmented as Follows:
By Raw Material
- Wood
- Metal
- Plastic
- Others
By End-User
- Residential
- Commercial
By Distribution Channel
- Online
- Offline
By Region
- North America
- The U.S.
- Canada
- Mexico
- Europe
- France
- The UK
- Spain
- Germany
- Italy
- Rest of Europe
- Asia Pacific
- China
- Japan
- India
- Australia
- South Korea
- Rest of Asia Pacific
- The Middle East & Africa
- Saudi Arabia
- UAE
- Egypt
- Kuwait
- South Africa
- Rest of the Middle East & Africa
- Latin America
- Brazil
- Argentina
- Rest of Latin America
Frequently Asked Questions
Table Of Content
List of Tables and Figures Figure Product Picture of Luxury Furniture Table Product Specification of Luxury Furniture Figure Market Concentration Ratio and Market Maturity Analysis of Luxury Furniture Figure Global Luxury Furniture Value ($) and Growth Rate from 2014-2024 Table Different Types of Luxury Furniture Figure Global Luxury Furniture Value ($) Segment by Type from 2014-2019 Figure Metal Picture Figure Plastic Picture Figure Wood Picture Figure Glass Picture Figure Leather Picture Figure Others Picture Table Different Applications of Luxury Furniture Figure Global Luxury Furniture Value ($) Segment by Applications from 2014-2019 Figure Commercial Use Picture Figure Domestic Use Picture Table Research Regions of Luxury Furniture Figure North America Luxury Furniture Production Value ($) and Growth Rate (2014-2019) Figure Europe Luxury Furniture Production Value ($) and Growth Rate (2014-2019) Table China Luxury Furniture Production Value ($) and Growth Rate (2014-2019) Table Japan Luxury Furniture Production Value ($) and Growth Rate (2014-2019) Table Middle East & Africa Luxury Furniture Production Value ($) and Growth Rate (2014-2019) Table India Luxury Furniture Production Value ($) and Growth Rate (2014-2019) Table South America Luxury Furniture Production Value ($) and Growth Rate (2014-2019) Table Emerging Countries of Luxury Furniture Table Growing Market of Luxury Furniture Figure Industry Chain Analysis of Luxury Furniture Table Upstream Raw Material Suppliers of Luxury Furniture with Contact Information Table Major Players Manufacturing Base and Market Share ($) of Luxury Furniture in 2018 Table Major Players Luxury Furniture Product Types in 2018 Figure Production Process of Luxury Furniture Figure Manufacturing Cost Structure of Luxury Furniture Figure Channel Status of Luxury Furniture Table Major Distributors of Luxury Furniture with Contact Information Table Major Downstream Buyers of Luxury Furniture with Contact Information Table Global Luxury Furniture Value ($) by Type (2014-2019) Table Global Luxury Furniture Value ($) Share by Type (2014-2019) Figure Global Luxury Furniture Value ($) Share by Type (2014-2019) Table Global Luxury Furniture Production by Type (2014-2019) Table Global Luxury Furniture Production Share by Type (2014-2019) Figure Global Luxury Furniture Production Share by Type (2014-2019) Figure Global Luxury Furniture Value ($) and Growth Rate of Metal Figure Global Luxury Furniture Value ($) and Growth Rate of Plastic Figure Global Luxury Furniture Value ($) and Growth Rate of Wood Figure Global Luxury Furniture Value ($) and Growth Rate of Glass Figure Global Luxury Furniture Value ($) and Growth Rate of Leather Figure Global Luxury Furniture Value ($) and Growth Rate of Others Figure Global Luxury Furniture Price by Type (2014-2019) Table Global Luxury Furniture Consumption by Application (2014-2019) Table Global Luxury Furniture Consumption Market Share by Application (2014-2019) Figure Global Luxury Furniture Consumption Market Share by Application (2014-2019) Table Downstream Buyers Introduction by Application Figure Global Luxury Furniture Consumption and Growth Rate of Commercial Use (2014-2019) Figure Global Luxury Furniture Consumption and Growth Rate of Domestic Use (2014-2019) Table Global Luxury Furniture Value ($) by Region (2014-2019) Table Global Luxury Furniture Value ($) Market Share by Region (2014-2019) Figure Global Luxury Furniture Value ($) Market Share by Region (2014-2019) Table Global Luxury Furniture Production by Region (2014-2019) Table Global Luxury Furniture Production Market Share by Region (2014-2019) Figure Global Luxury Furniture Production Market Share by Region (2014-2019) Table Global Luxury Furniture Production, Value ($), Price and Gross Margin (2014-2019) Table North America Luxury Furniture Production, Value ($), Price and Gross Margin (2014-2019) Table Europe Luxury Furniture Production, Value ($), Price and Gross Margin (2014-2019) Table China Luxury Furniture Production, Value ($), Price and Gross Margin (2014-2019) Table Japan Luxury Furniture Production, Value ($), Price and Gross Margin (2014-2019) Table Middle East & Africa Luxury Furniture Production, Value ($), Price and Gross Margin (2014-2019) Table India Luxury Furniture Production, Value ($), Price and Gross Margin (2014-2019) Table South America Luxury Furniture Production, Value ($), Price and Gross Margin (2014-2019) Table Global Luxury Furniture Consumption by Regions (2014-2019) Figure Global Luxury Furniture Consumption Share by Regions (2014-2019) Table North America Luxury Furniture Production, Consumption, Export, Import (2014-2019) Table Europe Luxury Furniture Production, Consumption, Export, Import (2014-2019) Table China Luxury Furniture Production, Consumption, Export, Import (2014-2019) Table Japan Luxury Furniture Production, Consumption, Export, Import (2014-2019) Table Middle East & Africa Luxury Furniture Production, Consumption, Export, Import (2014-2019) Table India Luxury Furniture Production, Consumption, Export, Import (2014-2019) Table South America Luxury Furniture Production, Consumption, Export, Import (2014-2019) Figure North America Luxury Furniture Production and Growth Rate Analysis Figure North America Luxury Furniture Consumption and Growth Rate Analysis Figure North America Luxury Furniture SWOT Analysis Figure Europe Luxury Furniture Production and Growth Rate Analysis Figure Europe Luxury Furniture Consumption and Growth Rate Analysis Figure Europe Luxury Furniture SWOT Analysis Figure China Luxury Furniture Production and Growth Rate Analysis Figure China Luxury Furniture Consumption and Growth Rate Analysis Figure China Luxury Furniture SWOT Analysis Figure Japan Luxury Furniture Production and Growth Rate Analysis Figure Japan Luxury Furniture Consumption and Growth Rate Analysis Figure Japan Luxury Furniture SWOT Analysis Figure Middle East & Africa Luxury Furniture Production and Growth Rate Analysis Figure Middle East & Africa Luxury Furniture Consumption and Growth Rate Analysis Figure Middle East & Africa Luxury Furniture SWOT Analysis Figure India Luxury Furniture Production and Growth Rate Analysis Figure India Luxury Furniture Consumption and Growth Rate Analysis Figure India Luxury Furniture SWOT Analysis Figure South America Luxury Furniture Production and Growth Rate Analysis Figure South America Luxury Furniture Consumption and Growth Rate Analysis Figure South America Luxury Furniture SWOT Analysis Figure Top 3 Market Share of Luxury Furniture Companies Figure Top 6 Market Share of Luxury Furniture Companies Table Mergers, Acquisitions and Expansion Analysis Table Company Profiles Table Product Introduction Table Henredon Furniture Industries Production, Value ($), Price, Gross Margin 2014-2019 Figure Henredon Furniture Industries Production and Growth Rate Figure Henredon Furniture Industries Value ($) Market Share 2014-2019 Figure Henredon Furniture Industries Market Share of Luxury Furniture Segmented by Region in 2018 Table Company Profiles Table Product Introduction Table Armani Casa Production, Value ($), Price, Gross Margin 2014-2019 Figure Armani Casa Production and Growth Rate Figure Armani Casa Value ($) Market Share 2014-2019 Figure Armani Casa Market Share of Luxury Furniture Segmented by Region in 2018 Table Company Profiles Table Product Introduction Table Herman Miller Production, Value ($), Price, Gross Margin 2014-2019 Figure Herman Miller Production and Growth Rate Figure Herman Miller Value ($) Market Share 2014-2019 Figure Herman Miller Market Share of Luxury Furniture Segmented by Region in 2018 Table Company Profiles Table Product Introduction Table Heritage Home Group Production, Value ($), Price, Gross Margin 2014-2019 Figure Heritage Home Group Production and Growth Rate Figure Heritage Home Group Value ($) Market Share 2014-2019 Figure Heritage Home Group Market Share of Luxury Furniture Segmented by Region in 2018 Table Company Profiles Table Product Introduction Table Laura Ashley Production, Value ($), Price, Gross Margin 2014-2019 Figure Laura Ashley Production and Growth Rate Figure Laura Ashley Value ($) Market Share 2014-2019 Figure Laura Ashley Market Share of Luxury Furniture Segmented by Region in 2018 Table Company Profiles Table Product Introduction Table Valderamobili Production, Value ($), Price, Gross Margin 2014-2019 Figure Valderamobili Production and Growth Rate Figure Valderamobili Value ($) Market Share 2014-2019 Figure Valderamobili Market Share of Luxury Furniture Segmented by Region in 2018 Table Company Profiles Table Product Introduction Table Nella Vetrina Production, Value ($), Price, Gross Margin 2014-2019 Figure Nella Vetrina Production and Growth Rate Figure Nella Vetrina Value ($) Market Share 2014-2019 Figure Nella Vetrina Market Share of Luxury Furniture Segmented by Region in 2018 Table Company Profiles Table Product Introduction Table Restoration Hardware Production, Value ($), Price, Gross Margin 2014-2019 Figure Restoration Hardware Production and Growth Rate Figure Restoration Hardware Value ($) Market Share 2014-2019 Figure Restoration Hardware Market Share of Luxury Furniture Segmented by Region in 2018 Table Company Profiles Table Product Introduction Table Bentley Home Production, Value ($), Price, Gross Margin 2014-2019 Figure Bentley Home Production and Growth Rate Figure Bentley Home Value ($) Market Share 2014-2019 Figure Bentley Home Market Share of Luxury Furniture Segmented by Region in 2018 Table Company Profiles Table Product Introduction Table Turri S.r.l. Production, Value ($), Price, Gross Margin 2014-2019 Figure Turri S.r.l. Production and Growth Rate Figure Turri S.r.l. Value ($) Market Share 2014-2019 Figure Turri S.r.l. Market Share of Luxury Furniture Segmented by Region in 2018 Table Company Profiles Table Product Introduction Table Duresta Upholstery Production, Value ($), Price, Gross Margin 2014-2019 Figure Duresta Upholstery Production and Growth Rate Figure Duresta Upholstery Value ($) Market Share 2014-2019 Figure Duresta Upholstery Market Share of Luxury Furniture Segmented by Region in 2018 Table Company Profiles Table Product Introduction Table Poliform Production, Value ($), Price, Gross Margin 2014-2019 Figure Poliform Production and Growth Rate Figure Poliform Value ($) Market Share 2014-2019 Figure Poliform Market Share of Luxury Furniture Segmented by Region in 2018 Table Company Profiles Table Product Introduction Table Muebles Pico Production, Value ($), Price, Gross Margin 2014-2019 Figure Muebles Pico Production and Growth Rate Figure Muebles Pico Value ($) Market Share 2014-2019 Figure Muebles Pico Market Share of Luxury Furniture Segmented by Region in 2018 Table Company Profiles Table Product Introduction Table Scavolini Production, Value ($), Price, Gross Margin 2014-2019 Figure Scavolini Production and Growth Rate Figure Scavolini Value ($) Market Share 2014-2019 Figure Scavolini Market Share of Luxury Furniture Segmented by Region in 2018 Table Global Luxury Furniture Market Value ($) Forecast, by Type Table Global Luxury Furniture Market Volume Forecast, by Type Figure Global Luxury Furniture Market Value ($) and Growth Rate Forecast of Metal (2019-2024) Figure Global Luxury Furniture Market Volume and Growth Rate Forecast of Metal (2019-2024) Figure Global Luxury Furniture Market Value ($) and Growth Rate Forecast of Plastic (2019-2024) Figure Global Luxury Furniture Market Volume and Growth Rate Forecast of Plastic (2019-2024) Figure Global Luxury Furniture Market Value ($) and Growth Rate Forecast of Wood (2019-2024) Figure Global Luxury Furniture Market Volume and Growth Rate Forecast of Wood (2019-2024) Figure Global Luxury Furniture Market Value ($) and Growth Rate Forecast of Glass (2019-2024) Figure Global Luxury Furniture Market Volume and Growth Rate Forecast of Glass (2019-2024) Figure Global Luxury Furniture Market Value ($) and Growth Rate Forecast of Leather (2019-2024) Figure Global Luxury Furniture Market Volume and Growth Rate Forecast of Leather (2019-2024) Figure Global Luxury Furniture Market Value ($) and Growth Rate Forecast of Others (2019-2024) Figure Global Luxury Furniture Market Volume and Growth Rate Forecast of Others (2019-2024) Table Global Market Value ($) Forecast by Application (2019-2024) Table Global Market Volume Forecast by Application (2019-2024) Figure Global Luxury Furniture Consumption and Growth Rate of Commercial Use (2014-2019) Figure Global Luxury Furniture Consumption and Growth Rate of Domestic Use (2014-2019) Figure Market Value ($) and Growth Rate Forecast of Domestic Use (2019-2024) Figure Market Volume and Growth Rate Forecast of Domestic Use (2019-2024) Figure North America Market Value ($) and Growth Rate Forecast (2019-2024) Table North America Consumption and Growth Rate Forecast (2019-2024) Figure Europe Market Value ($) and Growth Rate Forecast (2019-2024) Table Europe Consumption and Growth Rate Forecast (2019-2024) Figure China Market Value ($) and Growth Rate Forecast (2019-2024) Table China Consumption and Growth Rate Forecast (2019-2024) Figure Japan Market Value ($) and Growth Rate Forecast (2019-2024) Table Japan Consumption and Growth Rate Forecast (2019-2024) Figure Middle East & Africa Market Value ($) and Growth Rate Forecast (2019-2024) Table Middle East & Africa Consumption and Growth Rate Forecast (2019-2024) Figure India Market Value ($) and Growth Rate Forecast (2019-2024) Table India Consumption and Growth Rate Forecast (2019-2024) Figure South America Market Value ($) and Growth Rate Forecast (2019-2024) Table South America Consumption and Growth Rate Forecast (2019-2024) Figure Industry Resource/Technology/Labor Importance Analysis Table New Entrants SWOT Analysis Table New Project Analysis of Investment Recovery
Inquiry For Buying
Luxury Furniture
Request Sample
Luxury Furniture