OTC Herbal and Traditional Medicines Market Size, Share, and Trends Analysis Report
CAGR :

| Market Size 2023 (Base Year) | USD 38.8 Billion |
| Market Size 2032 (Forecast Year) | USD 53.67 Billion |
| CAGR | 3.67% |
| Forecast Period | 2024 - 2032 |
| Historical Period | 2018 - 2023 |
OTC Herbal and Traditional Medicines Market Insights
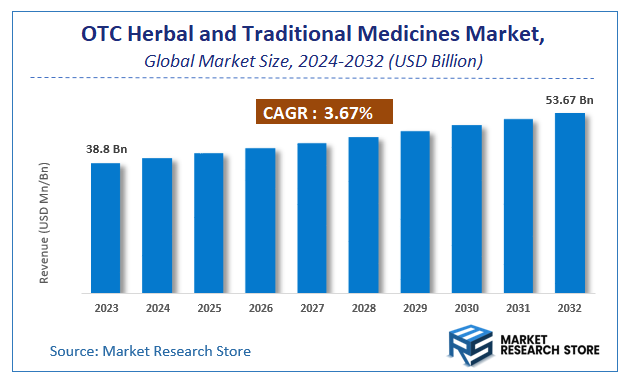
As per the published report by Market Research Store, the Global OTC Herbal and Traditional Medicines Market size was estimated at USD 38.8 Billion in 2023 and is anticipated to reach reach USD 53.67 Billion by 2032, growing at a projected CAGR of 3.67% during the forecast period 2024-2032. The report provides a detailed analysis of the global OTC Herbal and Traditional Medicines Market, including market trends, market dynamics, and market opportunities during the forecast period (2024-2032). It delves deeper into several market facets, such as market definition, size, growth, forecast, segmentation, competitive analysis, growth drivers, restraints, financial analysis, SWOT analysis, PORTER’s five force analysis, PESTEL analysis, market share analysis, cost-benefit analysis, challenges, restraints, strategic recommendations, and market players.
To Get more Insights, Request a Free Sample
OTC Herbal and Traditional Medicines Market: Overview
The growth of the OTC herbal and traditional medicines market is fueled by rising global demand across various industries and applications. The report highlights lucrative opportunities, analyzing cost structures, key segments, emerging trends, regional dynamics, and advancements by leading players to provide comprehensive market insights. The OTC herbal and traditional medicines market report offers a detailed industry analysis from 2024 to 2032, combining quantitative and qualitative insights. It examines key factors such as pricing, market penetration, GDP impact, industry dynamics, major players, consumer behavior, and socio-economic conditions. Structured into multiple sections, the report provides a comprehensive perspective on the market from all angles.
Key sections of the OTC herbal and traditional medicines market report include market segments, outlook, competitive landscape, and company profiles. Market Segments offer in-depth details based on Product Type, Application, and other relevant classifications to support strategic marketing initiatives. Market Outlook thoroughly analyzes market trends, growth drivers, restraints, opportunities, challenges, Porter’s Five Forces framework, macroeconomic factors, value chain analysis, and pricing trends shaping the market now and in the future. The Competitive Landscape and Company Profiles section highlights major players, their strategies, and market positioning to guide investment and business decisions. The report also identifies innovation trends, new business opportunities, and investment prospects for the forecast period.
Key Highlights:
- As per the analysis shared by our research analyst, the global OTC herbal and traditional medicines market is estimated to grow annually at a CAGR of around 3.67% over the forecast period (2024-2032).
- In terms of revenue, the global OTC herbal and traditional medicines market size was valued at around USD 38.8 Billion in 2023 and is projected to reach USD 53.67 Billion by 2032.
- The market is projected to grow at a significant rate due to growing consumer preference for natural remedies, increasing demand for preventive healthcare, and rising awareness of herbal medicine benefits.
- Based on the Product Type, the Herbal Medicine segment is growing at a high rate and will continue to dominate the global market as per industry projections.
- On the basis of Application, the Detoxification Medicine segment is anticipated to command the largest market share.
- Based on region, Asia-Pacific is projected to dominate the global market during the forecast period.
OTC Herbal and Traditional Medicines Market: Report Scope
This report thoroughly analyzes the OTC herbal and traditional medicines market, exploring its historical trends, current state, and future projections. The market estimates presented result from a robust research methodology, incorporating primary research, secondary sources, and expert opinions. These estimates are influenced by the prevailing market dynamics as well as key economic, social, and political factors. Furthermore, the report considers the impact of regulations, government expenditures, and advancements in research and development on the market. Both positive and negative shifts are evaluated to ensure a comprehensive and accurate market outlook.
| Report Attributes | Report Details |
|---|---|
| Report Name | OTC Herbal and Traditional Medicines Market |
| Market Size in 2023 | USD 38.8 Billion |
| Market Forecast in 2032 | USD 53.67 Billion |
| Growth Rate | CAGR of 3.67% |
| Number of Pages | 171 |
| Key Companies Covered | The Bioforce Group, The Nature's Bounty Co., Ricola AG, Amway Corporation, Medico Herbs, Bionorica SE, Phytomed Herbal Solutions, Nutra Green Biotechnology Co. Ltd., Biovontrade SARL, Dabur India Ltd., Herbalife International, Bio-Botanica Inc., Blackmore |
| Segments Covered | By Product Type, By Application, and By Region |
| Regions Covered | North America, Europe, Asia Pacific (APAC), Latin America, Middle East, and Africa (MEA) |
| Base Year | 2023 |
| Historical Year | 2018 to 2023 |
| Forecast Year | 2024 to 2032 |
| Customization Scope | Avail customized purchase options to meet your exact research needs. Request For Customization |
OTC Herbal and Traditional Medicines Market: Dynamics
Key Growth Drivers
The Over-the-Counter (OTC) Herbal and Traditional Medicines market in India is experiencing significant growth driven by a confluence of factors. A primary driver is the increasing consumer preference for natural and holistic healthcare solutions, with many perceiving these medicines as having fewer side effects compared to synthetic drugs. India's rich heritage of traditional medicine systems like Ayurveda, Unani, and Siddha, coupled with deep-rooted cultural trust and historical use, further fuels this demand. Rising health awareness, a growing middle class with higher disposable incomes, and the increasing accessibility of these products through pharmacies, online platforms, and modern trade channels also contribute significantly to market expansion. The government's support for traditional medicine systems and the growing body of research validating the efficacy of certain herbal remedies further bolster consumer confidence and market growth.
Restraints
Despite the strong growth momentum, the OTC Herbal and Traditional Medicines market in India faces several restraints. A key challenge is the lack of stringent quality control and standardization across the industry, leading to concerns about the efficacy and safety of some products. The limited scientific validation and clinical evidence for certain traditional remedies can also hinder wider acceptance by healthcare professionals and some consumers. Price sensitivity in the Indian market can lead to a preference for cheaper, potentially lower-quality products. Furthermore, navigating the complex and varying regulatory landscape for herbal and traditional medicines across different states and ensuring compliance with good manufacturing practices pose ongoing challenges for manufacturers. The potential for adulteration and contamination of raw materials and finished products also remains a significant concern.
Opportunities
The OTC Herbal and Traditional Medicines market in India presents numerous opportunities for future growth and development. The increasing focus on preventive healthcare and wellness is driving demand for herbal products that support immunity and overall well-being. The rapid expansion of e-commerce platforms provides a significant opportunity to reach a wider consumer base across the country. The development of innovative formulations that blend traditional knowledge with modern science and technology can attract new consumer segments. Furthermore, the growing global interest in natural and traditional medicines positions India as a potential hub for exports. Government initiatives promoting Ayush systems and investments in research and development create a favorable ecosystem for market players. The rising incidence of lifestyle diseases is also prompting consumers to seek natural and complementary remedies, further boosting market opportunities.
Challenges
The OTC Herbal and Traditional Medicines market in India faces several challenges that need to be addressed for sustainable and responsible growth. Ensuring consistent quality, safety, and efficacy of products through robust standardization and quality control measures is paramount. Building consumer trust by providing scientific validation and transparent labeling is crucial. Combating the issue of spurious and adulterated products requires stricter enforcement and greater consumer awareness. Harmonizing regulations across different states and aligning with international standards will facilitate smoother market operations and exports. Promoting collaboration between traditional medicine practitioners and modern healthcare professionals can lead to integrated healthcare solutions and wider acceptance. Finally, preserving India's rich biodiversity and ensuring sustainable sourcing of medicinal plants are essential for the long-term viability of the industry.
OTC Herbal and Traditional Medicines Market: Segmentation Insights
The global OTC herbal and traditional medicines market is segmented based on Product Type, Application, and Region. All the segments of the OTC herbal and traditional medicines market have been analyzed based on present & future trends and the market is estimated from 2024 to 2032.
Based on Product Type, the global OTC herbal and traditional medicines market is divided into Herbal Medicine, Traditional Medicine.
On the basis of Application, the global OTC herbal and traditional medicines market is bifurcated into Detoxification Medicine, Antipyretic Medicine, Digestive Medicine, Blood Circulation Medicine.
OTC Herbal and Traditional Medicines Market: Regional Insights
The Asia-Pacific (APAC) region dominates the global OTC herbal and traditional medicines market, accounting for the largest revenue share due to widespread cultural acceptance, extensive use of traditional medicine systems (such as Traditional Chinese Medicine, Ayurveda, and Kampo), and a strong presence of key manufacturers. According to recent market reports, APAC held over 40% of the global market share in 2023, driven by high demand in China, India, Japan, and South Korea. China is the largest contributor, fueled by government support for traditional medicine integration into healthcare. India follows closely, with Ayurveda gaining global traction.
North America and Europe are the next-largest markets, propelled by rising consumer preference for natural remedies, though their growth remains secondary to APAC. The Middle East & Africa and Latin America show steady growth, but their market shares remain comparatively smaller. APAC's dominance is expected to persist due to increasing exports, regulatory advancements, and sustained consumer reliance on herbal products.
OTC Herbal and Traditional Medicines Market: Competitive Landscape
The OTC herbal and traditional medicines market report offers a thorough analysis of both established and emerging players within the market. It includes a detailed list of key companies, categorized based on the types of products they offer and other relevant factors. The report also highlights the market entry year for each player, providing further context for the research analysis.
The "Global OTC Herbal and Traditional Medicines Market" study offers valuable insights, focusing on the global market landscape, with an emphasis on major industry players such as;
- The Bioforce Group
- The Nature's Bounty Co.
- Ricola AG
- Amway Corporation
- Medico Herbs
- Bionorica SE
- Phytomed Herbal Solutions
- Nutra Green Biotechnology Co. Ltd.
- Biovontrade SARL
- Dabur India Ltd.
- Herbalife International
- Bio-Botanica Inc.
- Blackmores Limited
- The Himalayan Drug Company
- Integria Healthcare Pty Ltd.
- Nutraceutical International Corporation
- Jiaherb Inc.
- Naturex SA
The Global OTC Herbal and Traditional Medicines Market is Segmented as Follows:
By Product Type
- Herbal Medicine
- Traditional Medicine
By Application
- Detoxification Medicine
- Antipyretic Medicine
- Digestive Medicine
- Blood Circulation Medicine
By Region
- North America
- The U.S.
- Canada
- Mexico
- Europe
- France
- The UK
- Spain
- Germany
- Italy
- Rest of Europe
- Asia Pacific
- China
- Japan
- India
- Australia
- South Korea
- Rest of Asia Pacific
- The Middle East & Africa
- Saudi Arabia
- UAE
- Egypt
- Kuwait
- South Africa
- Rest of the Middle East & Africa
- Latin America
- Brazil
- Argentina
- Rest of Latin America
Market Evolution
This section evaluates the market position of the product or service by examining its development pathway and competitive dynamics. It provides a detailed overview of the product's growth stages, including the early (historical) phase, the mid-stage, and anticipated future advancements influenced by innovation and emerging technologies.
Porter’s Analysis
Porter’s Five Forces framework offers a strategic lens for assessing competitor behavior and the positioning of key players in the OTC herbal and traditional medicines industry. This section explores the external factors shaping competitive dynamics and influencing market strategies in the years ahead. The analysis focuses on five critical forces:
- Competitive Rivalry
- Threat of New Entrants
- Threat of Substitutes
- Supplier Bargaining Power
- Buyer Bargaining Power
Value Chain & Market Attractiveness Analysis
The value chain analysis helps businesses optimize operations by mapping the product flow from suppliers to end consumers, identifying opportunities to streamline processes and gain a competitive edge. Segment-wise market attractiveness analysis evaluates key dimensions like product categories, demographics, and regions, assessing growth potential, market size, and profitability. This enables businesses to focus resources on high-potential segments for better ROI and long-term value.
PESTEL Analysis
PESTEL analysis is a powerful tool in market research reports that enhances market understanding by systematically examining the external macro-environmental factors influencing a business or industry. The acronym stands for Political, Economic, Social, Technological, Environmental, and Legal factors. By evaluating these dimensions, PESTEL analysis provides a comprehensive overview of the broader context within which a market operates, helping businesses identify potential opportunities and threats.
- Political factors assess government policies, stability, trade regulations, and political risks that could impact market operations.
- Economic factors examine variables like inflation, exchange rates, economic growth, and consumer spending power to determine market viability.
- Social factors explore cultural trends, demographics, and lifestyle changes that shape consumer behavior and preferences.
- Technological factors evaluate innovation, R&D, and technological advancements affecting product development and operational efficiencies.
- Environmental factors focus on sustainability, climate change impacts, and eco-friendly practices shaping market trends.
- Legal factors address compliance requirements, industry regulations, and intellectual property laws impacting market entry and operations.
Import-Export Analysis & Pricing Analysis
An import-export analysis is vital for market research, revealing global trade dynamics, trends, and opportunities. It examines trade volumes, product categories, and regional competitiveness, offering insights into supply chains and market demand. This section also analyzes past and future pricing trends, helping businesses optimize strategies and enabling consumers to assess product value effectively.
OTC Herbal and Traditional Medicines Market: Company Profiles
The report identifies key players in the OTC herbal and traditional medicines market through competitive landscape and company profiles, evaluating their offerings, financial performance, strategies, and market positioning. It includes a SWOT analysis of the top 3-5 companies, assessing strengths, weaknesses, opportunities, and threats. The competitive landscape highlights rankings, recent activities (mergers, acquisitions, partnerships, product launches), and regional footprints using the Ace matrix. Customization is available to meet client-specific needs.
Regional & Industry Footprint
This section details the geographic reach, sales networks, and market penetration of companies profiled in the OTC herbal and traditional medicines report, showcasing their operations and distribution across regions. It analyzes the alignment of companies with specific industry verticals, highlighting the industries they serve and the scope of their products and services within those sectors.
Ace Matrix
This section categorizes companies into four distinct groups—Active, Cutting Edge, Innovator, and Emerging—based on their product and business strategies. The evaluation of product strategy focuses on aspects such as the range and depth of offerings, commitment to innovation, product functionalities, and scalability. Key elements like global reach, sector coverage, strategic acquisitions, and long-term growth plans are considered for business strategy. This analysis provides a detailed view of companies' position within the market and highlights their potential for future growth and development.
Research Methodology
The qualitative and quantitative insights for the OTC herbal and traditional medicines market are derived through a multi-faceted research approach, combining input from subject matter experts, primary research, and secondary data sources. Primary research includes gathering critical information via face-to-face or telephonic interviews, surveys, questionnaires, and feedback from industry professionals, key opinion leaders (KOLs), and customers. Regular interviews with industry experts are conducted to deepen the analysis and reinforce the existing data, ensuring a robust and well-rounded market understanding.
Secondary research for this report was carried out by the Market Research Store team, drawing on a variety of authoritative sources, such as:
- Official company websites, annual reports, financial statements, investor presentations, and SEC filings
- Internal and external proprietary databases, as well as relevant patent and regulatory databases
- Government publications, national statistical databases, and industry-specific market reports
- Media coverage, including news articles, press releases, and webcasts about market participants
- Paid industry databases for detailed market insights
Market Research Store conducted in-depth consultations with various key opinion leaders in the industry, including senior executives from top companies and regional leaders from end-user organizations. This effort aimed to gather critical insights on factors such as the market share of dominant brands in specific countries and regions, along with pricing strategies for products and services.
To determine total sales data, the research team conducted primary interviews across multiple countries with influential stakeholders, including:
- Distributors
- Marketing, Brand, and Product Managers
- Procurement and Production Managers
- Sales and Regional Sales Managers, Country Managers
- Technical Specialists
- C-Level Executives
These subject matter experts, with their extensive industry experience, helped validate and refine the findings. For secondary research, data was sourced from a wide range of materials, including online resources, company annual reports, industry publications, research papers, association reports, and government websites. These various sources provide a comprehensive and well-rounded perspective on the market.
Frequently Asked Questions
Table Of Content
List of Tables and Figures Figure Product Picture of OTC Herbal and Traditional Medicines Table Product Specification of OTC Herbal and Traditional Medicines Figure Market Concentration Ratio and Market Maturity Analysis of OTC Herbal and Traditional Medicines Figure Global OTC Herbal and Traditional Medicines Value ($) and Growth Rate from 2014-2024 Table Different Types of OTC Herbal and Traditional Medicines Figure Global OTC Herbal and Traditional Medicines Value ($) Segment by Type from 2014-2019 Figure OTC Herbal Picture Figure Traditional Medicine Picture Table Different Applications of OTC Herbal and Traditional Medicines Figure Global OTC Herbal and Traditional Medicines Value ($) Segment by Applications from 2014-2019 Figure Pharmacy Picture Figure Drug Store Picture Figure Modern Trade Picture Figure Online Picture Figure Other OTC Format Picture Table Research Regions of OTC Herbal and Traditional Medicines Figure North America OTC Herbal and Traditional Medicines Production Value ($) and Growth Rate (2014-2019) Figure Europe OTC Herbal and Traditional Medicines Production Value ($) and Growth Rate (2014-2019) Table China OTC Herbal and Traditional Medicines Production Value ($) and Growth Rate (2014-2019) Table Japan OTC Herbal and Traditional Medicines Production Value ($) and Growth Rate (2014-2019) Table Middle East & Africa OTC Herbal and Traditional Medicines Production Value ($) and Growth Rate (2014-2019) Table India OTC Herbal and Traditional Medicines Production Value ($) and Growth Rate (2014-2019) Table South America OTC Herbal and Traditional Medicines Production Value ($) and Growth Rate (2014-2019) Table Emerging Countries of OTC Herbal and Traditional Medicines Table Growing Market of OTC Herbal and Traditional Medicines Figure Industry Chain Analysis of OTC Herbal and Traditional Medicines Table Upstream Raw Material Suppliers of OTC Herbal and Traditional Medicines with Contact Information Table Major Players Manufacturing Base and Market Share ($) of OTC Herbal and Traditional Medicines in 2018 Table Major Players OTC Herbal and Traditional Medicines Product Types in 2018 Figure Production Process of OTC Herbal and Traditional Medicines Figure Manufacturing Cost Structure of OTC Herbal and Traditional Medicines Figure Channel Status of OTC Herbal and Traditional Medicines Table Major Distributors of OTC Herbal and Traditional Medicines with Contact Information Table Major Downstream Buyers of OTC Herbal and Traditional Medicines with Contact Information Table Global OTC Herbal and Traditional Medicines Value ($) by Type (2014-2019) Table Global OTC Herbal and Traditional Medicines Value ($) Share by Type (2014-2019) Figure Global OTC Herbal and Traditional Medicines Value ($) Share by Type (2014-2019) Table Global OTC Herbal and Traditional Medicines Production by Type (2014-2019) Table Global OTC Herbal and Traditional Medicines Production Share by Type (2014-2019) Figure Global OTC Herbal and Traditional Medicines Production Share by Type (2014-2019) Figure Global OTC Herbal and Traditional Medicines Value ($) and Growth Rate of OTC Herbal Figure Global OTC Herbal and Traditional Medicines Value ($) and Growth Rate of Traditional Medicine Figure Global OTC Herbal and Traditional Medicines Price by Type (2014-2019) Table Global OTC Herbal and Traditional Medicines Consumption by Application (2014-2019) Table Global OTC Herbal and Traditional Medicines Consumption Market Share by Application (2014-2019) Figure Global OTC Herbal and Traditional Medicines Consumption Market Share by Application (2014-2019) Table Downstream Buyers Introduction by Application Figure Global OTC Herbal and Traditional Medicines Consumption and Growth Rate of Pharmacy (2014-2019) Figure Global OTC Herbal and Traditional Medicines Consumption and Growth Rate of Drug Store (2014-2019) Figure Global OTC Herbal and Traditional Medicines Consumption and Growth Rate of Modern Trade (2014-2019) Figure Global OTC Herbal and Traditional Medicines Consumption and Growth Rate of Online (2014-2019) Figure Global OTC Herbal and Traditional Medicines Consumption and Growth Rate of Other OTC Format (2014-2019) Table Global OTC Herbal and Traditional Medicines Value ($) by Region (2014-2019) Table Global OTC Herbal and Traditional Medicines Value ($) Market Share by Region (2014-2019) Figure Global OTC Herbal and Traditional Medicines Value ($) Market Share by Region (2014-2019) Table Global OTC Herbal and Traditional Medicines Production by Region (2014-2019) Table Global OTC Herbal and Traditional Medicines Production Market Share by Region (2014-2019) Figure Global OTC Herbal and Traditional Medicines Production Market Share by Region (2014-2019) Table Global OTC Herbal and Traditional Medicines Production, Value ($), Price and Gross Margin (2014-2019) Table North America OTC Herbal and Traditional Medicines Production, Value ($), Price and Gross Margin (2014-2019) Table Europe OTC Herbal and Traditional Medicines Production, Value ($), Price and Gross Margin (2014-2019) Table China OTC Herbal and Traditional Medicines Production, Value ($), Price and Gross Margin (2014-2019) Table Japan OTC Herbal and Traditional Medicines Production, Value ($), Price and Gross Margin (2014-2019) Table Middle East & Africa OTC Herbal and Traditional Medicines Production, Value ($), Price and Gross Margin (2014-2019) Table India OTC Herbal and Traditional Medicines Production, Value ($), Price and Gross Margin (2014-2019) Table South America OTC Herbal and Traditional Medicines Production, Value ($), Price and Gross Margin (2014-2019) Table Global OTC Herbal and Traditional Medicines Consumption by Regions (2014-2019) Figure Global OTC Herbal and Traditional Medicines Consumption Share by Regions (2014-2019) Table North America OTC Herbal and Traditional Medicines Production, Consumption, Export, Import (2014-2019) Table Europe OTC Herbal and Traditional Medicines Production, Consumption, Export, Import (2014-2019) Table China OTC Herbal and Traditional Medicines Production, Consumption, Export, Import (2014-2019) Table Japan OTC Herbal and Traditional Medicines Production, Consumption, Export, Import (2014-2019) Table Middle East & Africa OTC Herbal and Traditional Medicines Production, Consumption, Export, Import (2014-2019) Table India OTC Herbal and Traditional Medicines Production, Consumption, Export, Import (2014-2019) Table South America OTC Herbal and Traditional Medicines Production, Consumption, Export, Import (2014-2019) Figure North America OTC Herbal and Traditional Medicines Production and Growth Rate Analysis Figure North America OTC Herbal and Traditional Medicines Consumption and Growth Rate Analysis Figure North America OTC Herbal and Traditional Medicines SWOT Analysis Figure Europe OTC Herbal and Traditional Medicines Production and Growth Rate Analysis Figure Europe OTC Herbal and Traditional Medicines Consumption and Growth Rate Analysis Figure Europe OTC Herbal and Traditional Medicines SWOT Analysis Figure China OTC Herbal and Traditional Medicines Production and Growth Rate Analysis Figure China OTC Herbal and Traditional Medicines Consumption and Growth Rate Analysis Figure China OTC Herbal and Traditional Medicines SWOT Analysis Figure Japan OTC Herbal and Traditional Medicines Production and Growth Rate Analysis Figure Japan OTC Herbal and Traditional Medicines Consumption and Growth Rate Analysis Figure Japan OTC Herbal and Traditional Medicines SWOT Analysis Figure Middle East & Africa OTC Herbal and Traditional Medicines Production and Growth Rate Analysis Figure Middle East & Africa OTC Herbal and Traditional Medicines Consumption and Growth Rate Analysis Figure Middle East & Africa OTC Herbal and Traditional Medicines SWOT Analysis Figure India OTC Herbal and Traditional Medicines Production and Growth Rate Analysis Figure India OTC Herbal and Traditional Medicines Consumption and Growth Rate Analysis Figure India OTC Herbal and Traditional Medicines SWOT Analysis Figure South America OTC Herbal and Traditional Medicines Production and Growth Rate Analysis Figure South America OTC Herbal and Traditional Medicines Consumption and Growth Rate Analysis Figure South America OTC Herbal and Traditional Medicines SWOT Analysis Figure Top 3 Market Share of OTC Herbal and Traditional Medicines Companies Figure Top 6 Market Share of OTC Herbal and Traditional Medicines Companies Table Mergers, Acquisitions and Expansion Analysis Table Company Profiles Table Product Introduction Table The Bioforce Group Production, Value ($), Price, Gross Margin 2014-2019 Figure The Bioforce Group Production and Growth Rate Figure The Bioforce Group Value ($) Market Share 2014-2019 Figure The Bioforce Group Market Share of OTC Herbal and Traditional Medicines Segmented by Region in 2018 Table Company Profiles Table Product Introduction Table The Nature's Bounty Co. Production, Value ($), Price, Gross Margin 2014-2019 Figure The Nature's Bounty Co. Production and Growth Rate Figure The Nature's Bounty Co. Value ($) Market Share 2014-2019 Figure The Nature's Bounty Co. Market Share of OTC Herbal and Traditional Medicines Segmented by Region in 2018 Table Company Profiles Table Product Introduction Table Ricola AG Production, Value ($), Price, Gross Margin 2014-2019 Figure Ricola AG Production and Growth Rate Figure Ricola AG Value ($) Market Share 2014-2019 Figure Ricola AG Market Share of OTC Herbal and Traditional Medicines Segmented by Region in 2018 Table Company Profiles Table Product Introduction Table Amway Corporation Production, Value ($), Price, Gross Margin 2014-2019 Figure Amway Corporation Production and Growth Rate Figure Amway Corporation Value ($) Market Share 2014-2019 Figure Amway Corporation Market Share of OTC Herbal and Traditional Medicines Segmented by Region in 2018 Table Company Profiles Table Product Introduction Table Medico Herbs Production, Value ($), Price, Gross Margin 2014-2019 Figure Medico Herbs Production and Growth Rate Figure Medico Herbs Value ($) Market Share 2014-2019 Figure Medico Herbs Market Share of OTC Herbal and Traditional Medicines Segmented by Region in 2018 Table Company Profiles Table Product Introduction Table Bionorica SE Production, Value ($), Price, Gross Margin 2014-2019 Figure Bionorica SE Production and Growth Rate Figure Bionorica SE Value ($) Market Share 2014-2019 Figure Bionorica SE Market Share of OTC Herbal and Traditional Medicines Segmented by Region in 2018 Table Company Profiles Table Product Introduction Table Phytomed Herbal Solutions Production, Value ($), Price, Gross Margin 2014-2019 Figure Phytomed Herbal Solutions Production and Growth Rate Figure Phytomed Herbal Solutions Value ($) Market Share 2014-2019 Figure Phytomed Herbal Solutions Market Share of OTC Herbal and Traditional Medicines Segmented by Region in 2018 Table Company Profiles Table Product Introduction Table Nutra Green Biotechnology Co., Ltd. Production, Value ($), Price, Gross Margin 2014-2019 Figure Nutra Green Biotechnology Co., Ltd. Production and Growth Rate Figure Nutra Green Biotechnology Co., Ltd. Value ($) Market Share 2014-2019 Figure Nutra Green Biotechnology Co., Ltd. Market Share of OTC Herbal and Traditional Medicines Segmented by Region in 2018 Table Company Profiles Table Product Introduction Table Biovontrade SARL Production, Value ($), Price, Gross Margin 2014-2019 Figure Biovontrade SARL Production and Growth Rate Figure Biovontrade SARL Value ($) Market Share 2014-2019 Figure Biovontrade SARL Market Share of OTC Herbal and Traditional Medicines Segmented by Region in 2018 Table Company Profiles Table Product Introduction Table Dabur India Ltd. Production, Value ($), Price, Gross Margin 2014-2019 Figure Dabur India Ltd. Production and Growth Rate Figure Dabur India Ltd. Value ($) Market Share 2014-2019 Figure Dabur India Ltd. Market Share of OTC Herbal and Traditional Medicines Segmented by Region in 2018 Table Company Profiles Table Product Introduction Table Herbalife International Production, Value ($), Price, Gross Margin 2014-2019 Figure Herbalife International Production and Growth Rate Figure Herbalife International Value ($) Market Share 2014-2019 Figure Herbalife International Market Share of OTC Herbal and Traditional Medicines Segmented by Region in 2018 Table Company Profiles Table Product Introduction Table Bio-Botanica, Inc. Production, Value ($), Price, Gross Margin 2014-2019 Figure Bio-Botanica, Inc. Production and Growth Rate Figure Bio-Botanica, Inc. Value ($) Market Share 2014-2019 Figure Bio-Botanica, Inc. Market Share of OTC Herbal and Traditional Medicines Segmented by Region in 2018 Table Company Profiles Table Product Introduction Table Blackmores Limited Production, Value ($), Price, Gross Margin 2014-2019 Figure Blackmores Limited Production and Growth Rate Figure Blackmores Limited Value ($) Market Share 2014-2019 Figure Blackmores Limited Market Share of OTC Herbal and Traditional Medicines Segmented by Region in 2018 Table Company Profiles Table Product Introduction Table The Himalayan Drug Company Production, Value ($), Price, Gross Margin 2014-2019 Figure The Himalayan Drug Company Production and Growth Rate Figure The Himalayan Drug Company Value ($) Market Share 2014-2019 Figure The Himalayan Drug Company Market Share of OTC Herbal and Traditional Medicines Segmented by Region in 2018 Table Company Profiles Table Product Introduction Table Integria Healthcare Pty Ltd. Production, Value ($), Price, Gross Margin 2014-2019 Figure Integria Healthcare Pty Ltd. Production and Growth Rate Figure Integria Healthcare Pty Ltd. Value ($) Market Share 2014-2019 Figure Integria Healthcare Pty Ltd. Market Share of OTC Herbal and Traditional Medicines Segmented by Region in 2018 Table Company Profiles Table Product Introduction Table Nutraceutical International Corporation Production, Value ($), Price, Gross Margin 2014-2019 Figure Nutraceutical International Corporation Production and Growth Rate Figure Nutraceutical International Corporation Value ($) Market Share 2014-2019 Figure Nutraceutical International Corporation Market Share of OTC Herbal and Traditional Medicines Segmented by Region in 2018 Table Company Profiles Table Product Introduction Table Jiaherb Inc. Production, Value ($), Price, Gross Margin 2014-2019 Figure Jiaherb Inc. Production and Growth Rate Figure Jiaherb Inc. Value ($) Market Share 2014-2019 Figure Jiaherb Inc. Market Share of OTC Herbal and Traditional Medicines Segmented by Region in 2018 Table Company Profiles Table Product Introduction Table Naturex SA Production, Value ($), Price, Gross Margin 2014-2019 Figure Naturex SA Production and Growth Rate Figure Naturex SA Value ($) Market Share 2014-2019 Figure Naturex SA Market Share of OTC Herbal and Traditional Medicines Segmented by Region in 2018 Table Global OTC Herbal and Traditional Medicines Market Value ($) Forecast, by Type Table Global OTC Herbal and Traditional Medicines Market Volume Forecast, by Type Figure Global OTC Herbal and Traditional Medicines Market Value ($) and Growth Rate Forecast of OTC Herbal (2019-2024) Figure Global OTC Herbal and Traditional Medicines Market Volume and Growth Rate Forecast of OTC Herbal (2019-2024) Figure Global OTC Herbal and Traditional Medicines Market Value ($) and Growth Rate Forecast of Traditional Medicine (2019-2024) Figure Global OTC Herbal and Traditional Medicines Market Volume and Growth Rate Forecast of Traditional Medicine (2019-2024) Table Global Market Value ($) Forecast by Application (2019-2024) Table Global Market Volume Forecast by Application (2019-2024) Figure Global OTC Herbal and Traditional Medicines Consumption and Growth Rate of Pharmacy (2014-2019) Figure Global OTC Herbal and Traditional Medicines Consumption and Growth Rate of Drug Store (2014-2019) Figure Global OTC Herbal and Traditional Medicines Consumption and Growth Rate of Modern Trade (2014-2019) Figure Global OTC Herbal and Traditional Medicines Consumption and Growth Rate of Online (2014-2019) Figure Global OTC Herbal and Traditional Medicines Consumption and Growth Rate of Other OTC Format (2014-2019) Figure Market Value ($) and Growth Rate Forecast of Other OTC Format (2019-2024) Figure Market Volume and Growth Rate Forecast of Other OTC Format (2019-2024) Figure North America Market Value ($) and Growth Rate Forecast (2019-2024) Table North America Consumption and Growth Rate Forecast (2019-2024) Figure Europe Market Value ($) and Growth Rate Forecast (2019-2024) Table Europe Consumption and Growth Rate Forecast (2019-2024) Figure China Market Value ($) and Growth Rate Forecast (2019-2024) Table China Consumption and Growth Rate Forecast (2019-2024) Figure Japan Market Value ($) and Growth Rate Forecast (2019-2024) Table Japan Consumption and Growth Rate Forecast (2019-2024) Figure Middle East & Africa Market Value ($) and Growth Rate Forecast (2019-2024) Table Middle East & Africa Consumption and Growth Rate Forecast (2019-2024) Figure India Market Value ($) and Growth Rate Forecast (2019-2024) Table India Consumption and Growth Rate Forecast (2019-2024) Figure South America Market Value ($) and Growth Rate Forecast (2019-2024) Table South America Consumption and Growth Rate Forecast (2019-2024) Figure Industry Resource/Technology/Labor Importance Analysis Table New Entrants SWOT Analysis Table New Project Analysis of Investment Recovery
Inquiry For Buying
OTC Herbal and Traditional Medicines
Request Sample
OTC Herbal and Traditional Medicines